
.gif)
National Weather Service
Goodland, KS
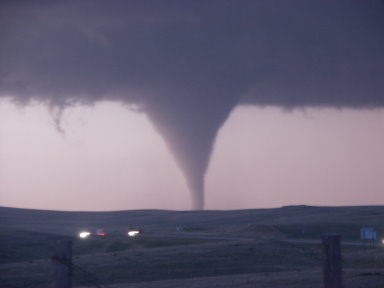
Tornado Climatology for the Tri-State Area
Written evidence of tornado occurrence in the United States dates back to the late 1500s. The first confirmed tornado in the United States, according to one author, occurred at Cambridge, MA on July 8, 1680. As one can imagine, finding reliable tornado records from the 1600s and 1700s, which provide exact dates, times and location of events is difficult. By the end of the 1870s however, John Park Finley had become the nation's premier documenter of tornadoes. In 1880, he had recorded more than 100 tornadoes in a single year, the first time in history.
While tornado records became somewhat more organized starting around 1880 thanks to John Finley, for the most part there continued to be inconsistencies and irregular documentation for the nation as a whole. The official counting of tornadoes began in 1916, as part of the Report of the Chief of the Weather Bureau. The annual number of tornadoes reported in the United states gradually increased from 90 in 1916 to 249 in 1949 thanks to better documentation during this period.
The "official" tornado record in the United States began in 1950 when information was collected and tabulated at the National Severe Storms Forecast Center (NSSFC) in Kansas City, Missouri. In 1953, serious efforts to count all tornadoes began since that was the first year in which the Weather Bureau (later renamed National Weather Service in 1970) began issuing tornado watches. As a result, just about all of the information contained in this document refers to events occurring in 1950 or later. For the period 1880-1949, a list of documented significant tornadoes (F2-F5) in the Tri-State area will be included (a total of 78 events). This information is taken from the book Significant Tornadoes 1680-1991, by Thomas Grazulis.
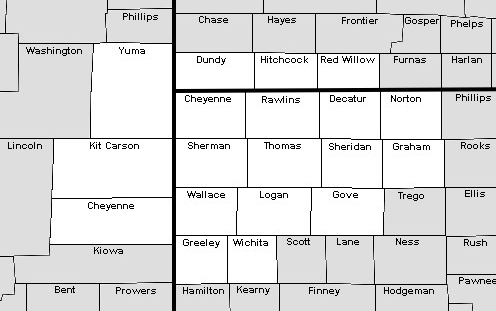
The National Weather Service (NWS) Forecast Office in Goodland, Kansas serves 19 counties in the Tri-State area as shown in the first chart below. This is called the Goodland County Warning Area (CWA). The information on this main tornado climatology page provides an overview of tornado occurrence for all of our 19 counties. Click on the images below for a larger view. Scroll down to the county links for more detailed tornado information for each county.
|
This map shows the 19 counties included in this tornado climatology. |
|
||||||||||||
| The graph at the right shows the number of tornadoes reported each year since 1950. The numbers shown are likely an underestimate of the true tornado count since some events, especially in rural areas, go unreported. In the early 1990s, a major modernization program within NWS took place, which included the deployment of Doppler radar and a more vigorous spotter training program. In addition, the 1990s saw an increasing number of storm chasers using video cameras and cell phones to document and report severe weather. These facts are likely responsible for the dramatic increase in annual tornadoes reported since 1990. |
|
||||||||||||
| Another way to illustrate the increase in reported tornadoes in recent years is to take a look at the number of tornado reports in each decade since 1950. From the 1950s through the 1980s, the number of tornadoes reported in the Tri-State area was fairly consistent with 65 to 85 events logged in each ten year period. Since 1990 however, the number of tornado events logged is about three times that of prior decades. |  |
||||||||||||
| Still another way to look at this trend is to again divide the data into decades, but now calculate the average number of tornadoes each year within that decade. For example, in the 1950s, 87 tornadoes were reported over the ten years, giving an average of 9 tornadoes each year from 1950-1959. Again notice that from the 1950s through the 1980s, the average annual tornado count was consistent between 7 and 9 tornadoes. In the past two decades however, over 200 tornadoes have been logged during each 10-year period, giving a more recent annual average of 24 tornadoes per year. |  |
||||||||||||
| The next two charts illustrate the month-to-month variation in tornado reports. Although tornadoes can occur in any month given the right atmospheric conditions, over the past 59 years, no tornadoes have occurred between November 1 and February 28. The peak months for tornadoes in the Tri-State area historically are May and June, and to a lesser extent, July. | .png) |
||||||||||||
| This chart takes the monthly information above and breaks each month's tornado count down into a percentage of the total. Taking June as an example, 34 percent of all tornado reports received since 1950 have occurred during that month, while 30 percent have occurred in May. | .png) |
||||||||||||
| Dr. Ted Fujita developed the F-Scale in 1971to provide a method to rate the intensity of tornadoes. The intent of the scale was to distinguish between weak and strong tornadoes. Dr. Fujita's scale was quickly accepted by the NWS and came into wide use by the mid-1970s. Values on the scale range from F0 for tornadoes producing minimal damage, to F5 for tornadoes causing devastating damage. A rough estimate of the wind speeds responsible for the damage could then be inferred using the F scale. In February 2006, this scale was modified and is now referred to as the "EF" scale, or Enhanced Fujita Scale. | .png) |
||||||||||||
|
This chart expresses the EF ratings in the chart above as a percentage. Tornadoes rated EF0 and EF1 are considered weak, tornadoes rated EF2 and EF3 are considered strong, and those with ratings of EF4 and EF5 are considered violent. It would appear that most tornadoes in the Tri-State area are weak since 83% are either EF0 or EF1. This is likely not the case however. Tornado ratings are based on observed damage. In rural areas with vast expanses of open fields there are simply less things to damage compared to urban areas. Thus, a tornado which in reality might be violent, will receive an EF0 rating if it remains over open country producing no damage. |
.png) |
||||||||||||
| The number of tornadoes reported in each of the 19 counties in the Goodland CWA varies quite a bit over the years. Sherman county Kansas takes the dubious honor of having the most tornadoes reported since 1950, with Kit Carson and Yuma counties in Colorado coming in 2nd and 3rd. Norton county Kansas has had the fewest number of tornadoes reported at 19. Also note there are two Cheyenne counties. The one at the far left is Cheyenne county Kansas, while the one toward the right is Cheyenne county Colorado. | .png) |
||||||||||||
|
The graph in the previous slide is somewhat misleading in that the size of the counties is not uniform. It would seem logical that if county A is twice as large as county B that there would be more tornadoes reported in county A, all other things being equal. To remove some of that bias, each county's tornado count in the slide above was divided by the area of the county and normalized to 1000 square miles. The graph to the right shows a more uniform tornado tally among the counties when this factor is taken into account. Sherman county Kansas still comes in with a high number of tornado reports. And no, the presence of the Doppler radar in Goodland is not to blame! |
.png) |
||||||||||||
|
1950-2008 Early Season Tornadoes By County |
1950-2008 Late Season Tornadoes By County |
||||||||||||
|
1950-2008 Tornadoes By County |
1950-2008 Weak Tornadoes By County |
||||||||||||
|
1950-2008 Strong Tornadoes By County |
1950-2008 Violent Tornadoes By County |
||||||||||||
|
1950-2008 Tornado Fatalities By County |
1950-2008 Tornado Injuries By County |
||||||||||||
|
1950-2008 March Tornadoes By County |
1950-2008 April Tornadoes By County |
||||||||||||
|
1950-2008 May Tornadoes By County |
1950-2008 June Tornadoes By County |
||||||||||||
|
1950-2008 July Tornadoes By County |
1950-2008 August Tornadoes By County |
||||||||||||
|
1950-2007 September Tornadoes By County |
1950-2007 October Tornadoes By County |
||||||||||||
|
Click on the county names below to view the following tornado information for that county: a graph of annual tornadoes since 1950, a graph of tornadoes and tornado days by month and a list of every tornado occurrence since 1950. KANSAS: Cheyenne Decatur Gove Graham Greeley Logan Norton |
|||||||||||||
|
Click here for a table of significant tornadoes (EF2-EF5) in the Tri-State area since 1880, listed by year. Click here for a table of significant tornadoes (EF2-EF5) in the Tri-State area since 1880, listed by county. Click here for a table of early season (March-April) and late season (October-November) tornado events in the Tri-State area since 1880 |
|||||||||||||
| Click on the state links below for additional tornado information for that state: | |||||||||||||
| Click here to visit the Storm Prediction Center's web page and learn more about the Enhanced Fujita Scale. | |||||||||||||


.png)
.png)
.png)
.png)
.png)
.png)
.png)
.png)
.png)
.png)
.png)
.png)

