Skip all navigation and jump to content Jump to site navigation Jump to section navigation.
NASA Logo - Goddard Space Flight Center + Visit NASA.gov
HOME PROJECTS RESOURCES SEARCH MAP

+ Advanced Search
Home
Home
View Most Recently Released Imagery
View Gallery of Imagery: A topical collection of SVS Imagery
Search Imagery by the keywords assigned to it
Search Imagery by the instruments that supplied data for a visualization product
Search Imagery by the series of visualizations that have been produced
Search Imagery by the scientist providing the data used in a visualization product
Search Imagery by the animator that created the product
Search Imagery by the identification number assigned to the visualization product
See other search options
Learn about the SVS Image Server
  + About the Server
  + Animation List
  + How to Use the Server


  + RSS Feeds
blank image
Previous Animation
Next Animation
Wind Anomalies during El Nino/La Nina Event of 1997-1998 (WMS)

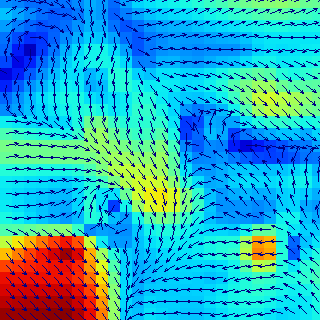
The El Nino/La Nina event in 1997-1999 was particularly intense, but was also very well observed by satellites and buoys. Deviations from normal winds speeds and directions of the were computed using data from the Special Sensor Microwave/Imager (SSMI) on the Tropical Rainfall Measuring Mission (TRMM) satellite.

This animation shows El Nino and La Nina from
1997 through 1998. Each frame is a ten-day average of wind
anomalies--that is, of differences from normal wind velocities.
The area shown in the animation is the Pacific ocean
from -21 to +21 latitude and +120 to +290 East
longitude.    This animation shows El Nino and La Nina from 1997 through 1998. Each frame is a ten-day average of wind anomalies--that is, of differences from normal wind velocities. The area shown in the animation is the Pacific ocean from -21 to +21 latitude and +120 to +290 East longitude.
Duration: 60.0 seconds
Available formats:
  320x320     PNG           29 KB
  2040x504   Frames
  160x80       PNG           13 KB
  80x40         PNG           6 KB
  2040x504 (29.97 fps) MPEG-1   13 MB
How to play our movies

This product is available through our Web Map Service.   Click here to learn more.


Color scale for wind speed anomalies. The values range from 0 to 1.5 meters per second. The direction of the wind anomaly in each cell is shown by an arrow.
   Color scale for wind speed anomalies. The values range from 0 to 1.5 meters per second. The direction of the wind anomaly in each cell is shown by an arrow.

Available formats:
  320 x 90           PNG   1 KB

Animation Number:3171
Animator:Jeff de La Beaujardiere (SVS) (Lead)
Completed:2005-06-01
Instrument:TRMM/3B4XRT
Data set:Sea Surface Wind Anomaly
Data Collected:1997-01-01 through 1999-12-27, every 8 days
Series:El Niño and La Niña
 WMS
Keywords:
DLESE >> Physical oceanography
GCMD >> EARTH SCIENCE >> Atmosphere >> Atmospheric Winds >> Surface Winds
GCMD >> EARTH SCIENCE >> Climate Indicators >> Teleconnections >> El Nino Southern Oscillation
GCMD >> EARTH SCIENCE >> Oceans >> Ocean Winds >> Surface Winds
GCMD >> Location >> Pacific Ocean
View Animation in Google Earth Google Earth KML file is available here.
DEPC Metadata is available here.
 
 
Please give credit for this item to
NASA/Goddard Space Flight Center
Scientific Visualization Studio


Back to Top

USA.gov logo - the U.S. Government's official Web portal. + Privacy Policy and Important Notices
+ Reproduction Guidelines
NASA NASA Official:
SVS Contact:
Curator: