Sea Surface Height Anomalies during El Nino/La Nina Event of 1997-1998 (WMS)
|
The El Nino/La Nina event in 1997-1999 was particularly intense, but was also very well observed by satellites and buoys. Changes in the normal height of the ocean's surface were observed by the TOPEX/Poseidon altimeter.
|
|
|
|
This animation shows El Nino and La Nina from
1997 through 1998. Each frame is a ten-day average of sea
surface height (SSH) anomalies--that is, of differences from
normal SSH values. The area shown in the animation is the
Pacific ocean from -20.5 to +20.5 latitude and +120.5 to +289.5
East longitude.
Duration: 3.0 seconds
Available formats:
1020x252 (29.97 fps)
MPEG-1
808 KB
320x84
JPEG
11 KB
80x40
PNG
5 KB
160x80
PNG
17 KB
How to play our movies
|
|
This product is available through our Web Map Service.
Click here to learn more.
|
|
|
|
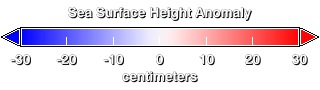
Color bar showing sea surface height anomalies ranging from -30cm (-12in) below normal (blue areas) to +30 cm (12 in) above normal (red areas).
Available formats:
320 x 90
PNG
1 KB
|
|
|
Back to Top
|


