Sea Surface Temperature Anomalies during El Nino/La Nina Event of 1997-1998 (WMS)
|
The El Nino/La Nina event in 1997-1999 was particularly intense, but was also very well observed by satellites and buoys. A strong upwelling of unusually warm water was observed in the Pacific Ocean during the El Nino phase, followed by unusually cold water in the La Nina phase. The Advanced Very High Resolution Radiometer (AVHRR) instrument on the US National Oceanic and Atmospheric Administration's NOAA-14 spacecraft observed the changes in sea surface temperature shown here.
|
|

|
|
This animation shows El Nino and La Nina from
1997 through 1998. Each frame is a ten-day average of sea
surface temperature (SST) anomalies--that is, of differences from
normal SST values. The area shown in the animation is the
Pacific ocean from -20.5 to +20.5 latitude and +120.5 to +289.5
East longitude.
Duration: 3.0 seconds
Available formats:
1016x248 (29.97 fps)
MPEG-1
807 KB
80x40
PNG
5 KB
320x84
JPEG
4 KB
160x80
PNG
15 KB
How to play our movies
|
|
This product is available through our Web Map Service.
Click here to learn more.
|
|

|
|
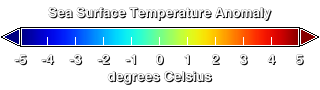
Color bar showing temperature anomalies ranging from 5 degrees Celsius (9 Farenheit) hotter (red areas) during
El Nino to 5 C (9 F) cooler (blue areas) during La Nina.
Available formats:
320 x 90
PNG
1 KB
|
|
|
Back to Top
|


