Skip all navigation and jump to content Jump to site navigation Jump to section navigation.
NASA Logo - Goddard Space Flight Center + Visit NASA.gov
HOME PROJECTS RESOURCES SEARCH MAP

+ Advanced Search
Home
Home
View Most Recently Released Imagery
View Gallery of Imagery: A topical collection of SVS Imagery
Search Imagery by the keywords assigned to it
Search Imagery by the instruments that supplied data for a visualization product
Search Imagery by the series of visualizations that have been produced
Search Imagery by the scientist providing the data used in a visualization product
Search Imagery by the animator that created the product
Search Imagery by the identification number assigned to the visualization product
See other search options
Learn about the SVS Image Server
  + About the Server
  + Animation List
  + How to Use the Server


  + RSS Feeds
blank image
Previous Animation
Next Animation
Sea Surface Temperature, Clouds, and Tropical Depression/Storm/Hurricane Tracks from June 1, 2005 to August 29, 2005

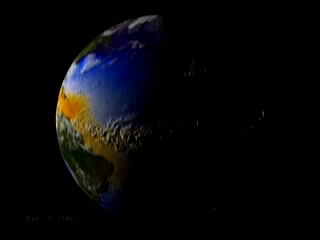
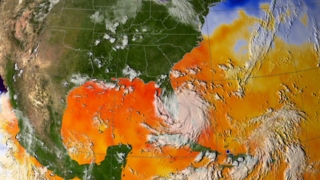
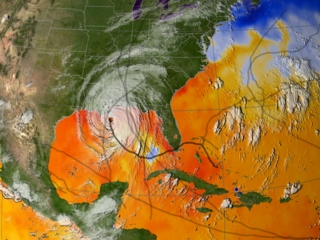
This visualization shows sea surface temperatures during the early part of the 2005 hurricane season. Overlaid are infrared cloud data and storm track data. Ocean temperatures are the fuel that drive hurricanes. Notice the correspondence between the storm tracks and the sea surface temperature response; this is particulary noticeable for hurricanes Dennis, Emily, and Katrina.

Sea surface temperature with clouds and storm tracks overlaid showing the first half of the 2005 hurricane season    Sea surface temperature with clouds and storm tracks overlaid showing the first half of the 2005 hurricane season
Duration: 1.4 minutes
Available formats:
  720x480 (29.97 fps) MPEG-2   62 MB
  640x480 (29.97 fps) MPEG-1   31 MB
  320x240 (29.97 fps) MPEG-1   30 MB
  320x240     JPEG         13 KB
  1280x720 (29.97 fps) MPEG-2   176 MB
  1280x720 (30 fps) Frames (Sst goes tracksHD)
  720x480     Frames (Sst goes tracks)
How to play our movies


Sea surface temperature with clouds overlaid showing the first half of the 2005 hurricane season  (no storm tracks)    Sea surface temperature with clouds overlaid showing the first half of the 2005 hurricane season (no storm tracks)
Duration: 1.4 minutes
Available formats:
  1280x720 (29.97 fps) MPEG-2   176 MB
  1280x720 (30 fps) Frames (Sst goes noTracksHD)
  720x486     Frames (Sst goes noTracks)
  320x180     JPEG         59 KB
  160x80       PNG           37 KB
  80x40         PNG           9 KB
How to play our movies


Overlay frames (with alpha) of Katrina's storm track    Overlay frames (with alpha) of Katrina's storm track

Available formats:
  720x486     Frames (TracksKatrina 24fpd)
  320x216     PNG           1 KB
How to play our movies


Overlay frames (with alpha) of storm tracks up to Katrina (not including Katrina)    Overlay frames (with alpha) of storm tracks up to Katrina (not including Katrina)

Available formats:
  720x486     Frames (TracksNoKatrina 24fpd)
  320x216     PNG           9 KB
How to play our movies


Sea surface temperature with clouds and tracks on Aug 29, 2005    Sea surface temperature with clouds and tracks on Aug 29, 2005

Available formats:
  2560 x 1920     TIFF 10 MB
  320 x 240         JPEG 74 KB
  80 x 40             PNG   8 KB
  160 x 80           PNG 31 KB


Sea surface temperature color bar (blue is about 20 degrees C and less, red is about 30 degrees C and higher)
   Sea surface temperature color bar (blue is about 20 degrees C and less, red is about 30 degrees C and higher)

Available formats:
  320 x 90           TIFF 11 KB
  320 x 90           PNG   1016 B

Animation Number:3226
Animators:Greg Shirah (SVS) (Lead)
 Alex Kekesi (SVS)
 Lori Perkins (SVS)
Completed:2005-09-02
Scientists:J. Marshall Shepherd (NASA/GSFC)
 Jeff Halverson (JCET UMBC)
Instrument:GOES/IR4
Data sets:Blue Marble
 Unisys Hurricane Tracking Data
Data Collected:2005/06/01 through 2005/08/29
Series:Hurricane Katrina
Keywords:
DLESE >> Agricultural science
SVS >> HDTV
SVS >> Hurricane
GCMD >> EARTH SCIENCE >> Atmosphere >> Atmospheric Phenomena >> Hurricanes
GCMD >> EARTH SCIENCE >> Oceans >> Ocean Temperature >> Sea Surface Temperature
 
 
Please give credit for this item to
NASA/Goddard Space Flight Center Scientific Visualization Studio


Back to Top

USA.gov logo - the U.S. Government's official Web portal. + Privacy Policy and Important Notices
+ Reproduction Guidelines
NASA NASA Official:
SVS Contact:
Curator: