

 Climate Monitoring / Climate of 2006 / Atlantic Hurricanes / Help Climate Monitoring / Climate of 2006 / Atlantic Hurricanes / Help
Use these links to access detailed analyses of Global and U.S. data 
JUNE | JULY | AUGUST | SEPTEMBER | OCTOBER | NOVEMBER | SEASONAL SUMMARY | links [Alberto (6/10-14) | Beryl (7/18-21) Chris (8/1-5) | Debby (8/21-27) | Ernesto (8/24 - 9/1) Florence(9/5-15) | Gordon (9/11-21) | Helene (9/14-27) | Isaac (9/28-10/2)]
|
||||||||||||||||||||||||||||||||||||||||||||||||||||||
|
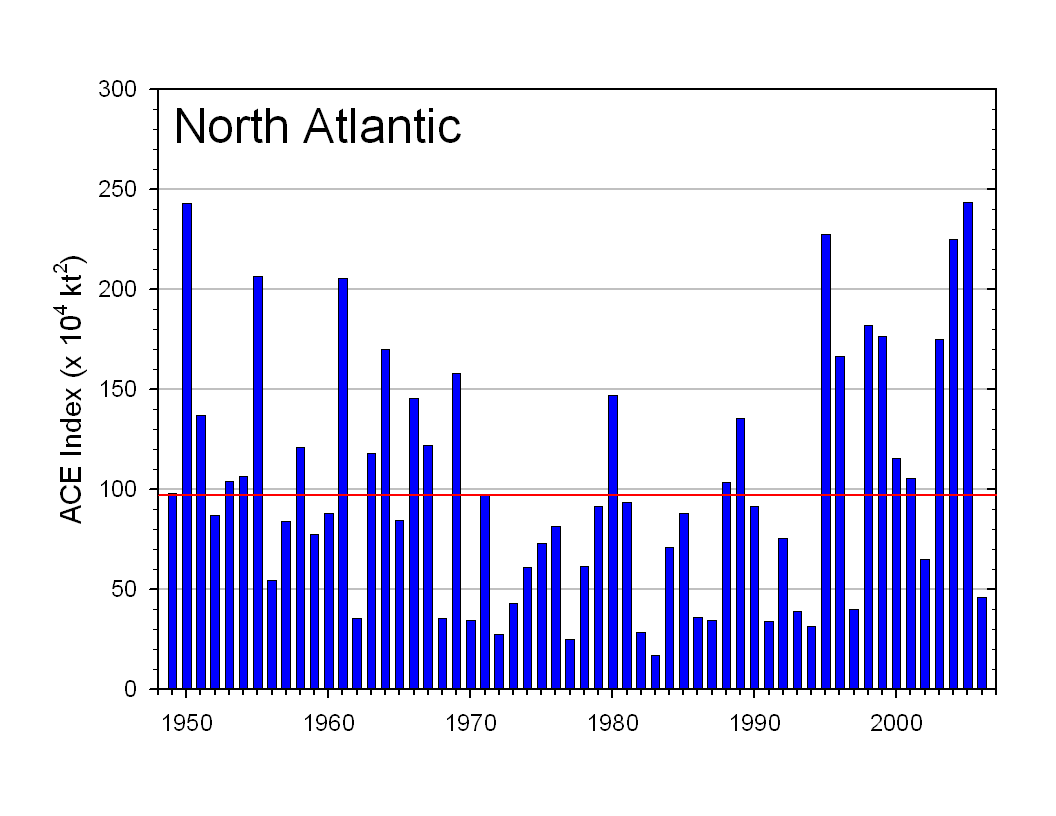
Averages: Click here for information on the 2005 North Atlantic Hurricane season. |
 Click for larger image |
|
2006 season summary: |
|
|
Summaries of each 2006 Atlantic basin storm, organized by month, are available below.
Please note, convention reports tropical storm winds in knots (kt) and pressures in millibars (mb). |
 November
No tropical activity reported in the Atlantic basin in November.
October
No tropical activity reported in the Atlantic basin in October.
September
 Hurricane Florence Satellite Image |
 Hurricane Florence Track  Saffir-Simpson Scale Color Legend |
| Florence formed between Africa and the Lesser Antillies on September 3rd and began tracking to the Northwest. Florence became a Category 1 hurricane and brushed the western coast of Bermuda causing large swells, rip tides and undertows. Maximum winds for Florence were 80 kt and minimum central pressure was 972 millibars (28.70 inches of mercury). The ACE Index Value was 12.2207 x 10⁴ kt2. More information on Florence is available from the NOAA National Hurricane Center.
| |
 Hurricane Gordon Satellite Image |
 Hurricane Gordon Track Saffir-Simpson Scale Color Legend |
| Northeast of the Lesser Antilles, Gordon became organized on the 10th and began a northwesterly track. The storm attained Category 3 status with winds of 105 kt on the 13th, the first major hurricane of the Atlantic season. Minimum central pressure was 955 millibars (28.20 inches of mercury). Gordon eventually turned to the northeast and became extratropical. The ACE value for Gordon was 21.415 x 10⁴ kt2. More information on Gordon is available from the NOAA National Hurricane Center.
| |
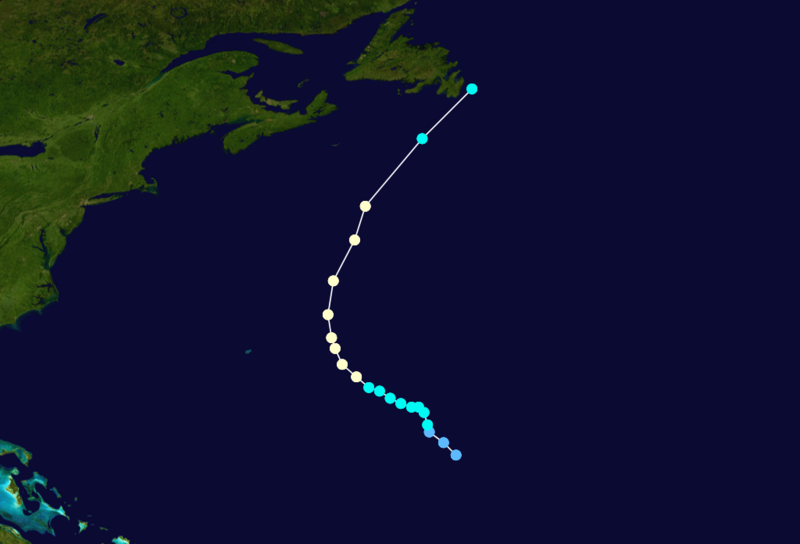
 Hurricane Helene Satellite Image |
 Hurricane Helene Track Saffir-Simpson Scale Color Legend |
| A tropical wave formed off the African coast on the 11th and quickly orgranized. Helene went from a tropical depression to a major hurricane in just 5 days and remained in the central Atlantic before dissipating. While a major hurricane, Helene's maximum sustained winds were 110 kt and mimimum central pressure was 954 millibars (28.17 inches of mercury). The ACE value for Helene was 27.8713 x 10⁴ kt2. More information on Helene is available from the NOAA National Hurricane Center.
| |
 Hurricane Isaac Satellite Image |
 Hurricane Isaac Track Saffir-Simpson Scale Color Legend |
| Isaac became a depression in the central Atlantic on the 27th and passed about 280 miles (450 km) east of Bermuda as a Category 1 hurricane with winds sustained at 75 kt and a mimimum central pressure of 985 millibars (29.09 inches of mercury). Isaac continued tracking to the north and began to weaken. It brushed the Newfoundland coast as a tropical storm before dissipating. The ACE value for Isaac was 6.725 x 10⁴ kt2. More information on Isaac is available from the NOAA National Hurricane Center.
| |
August
 TS Chris Satellite Image |
 TS Chris Track Saffir-Simpson Scale Color Legend |
| Chris formed just west of the Leeward Islands on August 1st and became a tropical storm the same day. The storm tracked west-northwest to the north of Puerto Rico and the Dominican Republic before weakening to a depression on August 4th, and dissipating along the northern coast of Cuba on the 5th. Maximum sustained winds and minimum central pressure for Chris were 55 knots (63 mph or 102 kph) and 1001 millibars (29.56 inches of mercury), respectively, and its overall ACE value was 2.358 x 10⁴ kt2. More information on Chris is available from the NOAA National Hurricane Center.
|
|
 TS Debby Satellite Image |
 TS Debby Track Saffir-Simpson Scale Color Legend |
| Tropical storm Debby formed on 21 August, about 250 miles southeast of the Cape Verde Islands and tracked to the northwest. Debby became a tropical storm on the 23rd, and reached maximum sustained winds of 45 kts (52 mph or 83 kph) and a minimum central pressure of 1000 mb (29.53 inches of mercury). The storm was downgraded to a depression on 26 August and dissipated the next day, without ever making landfall. Debby's overall ACE value was 2.1425 x 10⁴ kt2. More information on Debby is available from the NOAA National Hurricane Center.
|
|
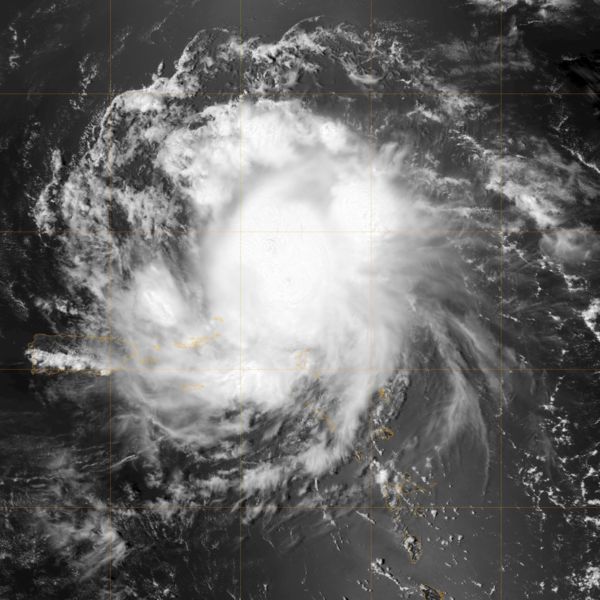
 H Ernesto Satellite Image |
 H Ernesto Track Saffir-Simpson Scale Color Legend |
| The first Hurricane of the 2006 Atlantic season, Ernesto, formed on August 24th, about 155 miles southeast of Martinique in the Windward Islands and tracked to the west, becoming a tropical storm in the evening of the 25th. Ernesto briefly strengthened to a category 1 hurricane the morning of August 27th, off of the southern coast of Haiti before returning to tropical storm intensity. As a tropical storm, Ernesto made its first landfall near Guantanamo Bay, Cuba early on the 28th. Although strengthening slightly, Ernesto did not regain hurricane intensity, and made its second landfall in southwestern Dade County, Florida in the early morning of August 30th. After traversing Florida to near Cape Canaveral, Ernesto moved into the Atlantic and restrengthened, resuming a more northerly course and making its final landfall near Long Beach, North Carolina in the late evening of the 31st. Two deaths were reported in Haiti in flooding connected with Ernesto, while 6 storm-related fatalities occurred in the United States. At its height, Ernesto's maximum sustained winds were 65 kts (75 mph or 120 kph) and it's minimum central pressure was 987 mb (29.15 inches of mercury). The overall ACE value was 3.59 x 10⁴ kt2. More information on Ernesto is available from the NOAA National Hurricane Center. | |
July
 TS Beryl Satellite Image |
 TS Beryl Track Forecast |
| One tropical storm, Beryl, occurred in July. The storm formed approximately 220 miles to the southeast of the Outer Banks of North Carolina and was listed as Tropical Depression-02 at 1500 UTC (1100 EDT) on 18 July. Beryl intensified into a tropical storm at 0000 UTC (2000 EDT) the next day. The storm tracked north northeast toward Massachusetts, and crossed Nantucket Island before dissipating to the southwest of Nova Scotia, Canada at 1500 UTC (1100 EDT) on 21 July. Beryl's maximum sustained winds and minimum central pressure were 50 knots (57 mph or 93 kph) and 1001 millibars (29.56 inches of mercury), respectively and its ACE value was 2.173 x 10⁴ kt2. More information on Beryl is available from the NOAA National Hurricane Center. | |
June
 TS Alberto Satellite Image |
 TS Alberto Track Forecast |
| June 1 is the start of the official North Atlantic tropical cyclone season for 2006. On June 10, tropical storm Alberto developed as a loosely organized depression about 50 miles (80 km) south-southwest of the western tip of Cuba. Alberto strengthened to a tropical storm at 1500 UTC (1000 CDT) on June 11th. The storm tracked north, then northeast, eventually making landfall as a tropical storm along the Big Bend area of Florida, at Apalachee Bay at 1530 UTC (1130 EDT) on June 13. After tracking across the southeastern US, Alberto moved into the North Atlantic and dissipated from tropical storm strength on the 14th. At its height, Alberto's maximum sustained winds were 60 knots (70 mph), and it had a minimum central pressure of 995 millibars (29.38 inches of mercury). More information on Alberto is available from the NOAA National Hurricane Center. | |
Useful Links
|
Questions?
|
For all climate questions other than questions concerning this report, please contact the National Climatic Data Center's Climate Services Division: Climate Services Division NOAA/National Climatic Data Center 151 Patton Avenue Asheville, NC 28801-5001 fax: 828-271-4876 phone: 828-271-4800 email: questions@ncdc.noaa.gov For further information on the historical climate perspective presented in this report, contact: David Levinson NOAA/National Climatic Data Center 151 Patton Avenue Asheville, NC 28801-5001 fax: 828-271-4328 email: David.Levinson@noaa.gov |
NCDC / Climate Monitoring / Climate of 2006 / hurricanes / Help