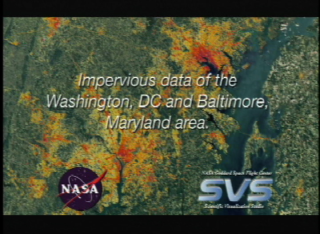
Impervious Data of the Washington, DC and Baltimore, Maryland Area.
|
Here we see an image of the Washington, D.C.-Baltimore area taken with the Landsat satellite on March 27, 1998. For over 26 years, Landsat images have been used to help urban planners understand where growth is taking place and help geographers evaluate how different urban planning programs effect population growth and land use.
|
|
|
|
The animation is using Landsat data (from 1986, 1990, 1996, and 2000) of the Washington-Baltimore area, however a special algorithm has been applied to it to illuminate the changes in low-density residential land use which exemplify sprawl.
Duration: 8.0 seconds
Available formats:
320x240 (30 fps)
MPEG-1
1 MB
320x240
JPEG
14 KB
720x480 (29.97 fps)
DV
40 MB
How to play our movies
|
|
|
|
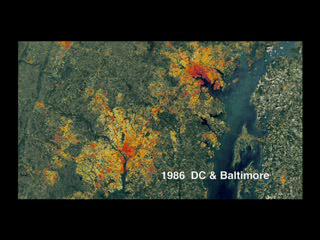
This Landsat data from 1986 of the Washington-Baltimore area, however a special algorithm has been applied to it to illuminate the changes in low-density residential land use which exemplify sprawl.
Available formats:
1280 x 720
TIFF
2 MB
160 x 80
PNG
27 KB
320 x 180
JPEG
22 KB
80 x 40
PNG
6 KB
|
|

|
|
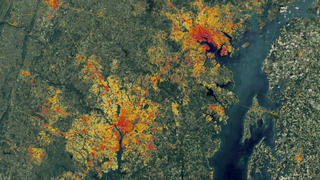
This Landsat data from 1990 of the Washington-Baltimore area, however a special algorithm has been applied to it to illuminate the changes in low-density residential land use which exemplify sprawl.
Available formats:
1280 x 720
TIFF
2 MB
320 x 180
JPEG
23 KB
|
|
|
|
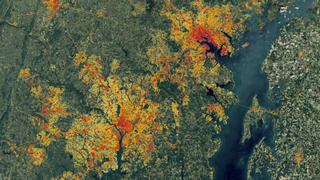
This Landsat data from 1996 of the Washington-Baltimore area, however a special algorithm has been applied to it to illuminate the changes in low-density residential land use which exemplify sprawl.
Available formats:
1280 x 720
TIFF
2 MB
320 x 180
JPEG
23 KB
|
|

|
|
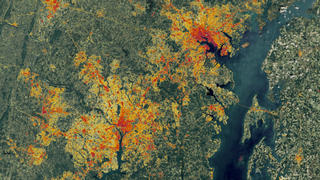
This Landsat data from 2000 of the Washington-Baltimore area, however a special algorithm has been applied to it to illuminate the changes in low-density residential land use which exemplify sprawl.
Available formats:
1280 x 720
TIFF
2 MB
320 x 180
JPEG
24 KB
|
|

|
|
None
Available formats:
720 x 528
JPEG
196 KB
320 x 234
PNG
372 KB
|
|
|
Back to Top
|

