| |
|
CDC, through its various operating units, for
example the
National Center for
Birth Defects and Developmental Disabilities (NCBDDD)
and the
National Center for Injury Prevention and Control
(NCIPC)
aims to promote the health of people with disabilities, prevent
secondary conditions, and eliminate disparities between people with
and without disabilities in the U.S. population. |
|
This aim is consistent
with
Healthy People 2010, a set of health objectives for the Nation
to achieve over the first decade of the new century. |
| |
|
|
| |
| To monitor progress toward
the achievement of HP2010 goals for disability and secondary
conditions, HP2010 defines disability in terms of interactions
between individuals with a health condition and barriers in their
environment. In this context, the Nation defined people with
disabilities as people identified as having an activity limitation
or who use assistance or who perceive themselves as having a
disability. 1 |
|
Top
of Page |
|
Disability
Demographics |
| |
According to the Census
2000,
there are an estimated 49.7 million persons in the United
States,
or nearly 20 percent of the population,
who are living with
disabilities.2 |
| In addition, there are more than
25 million family caregivers whose
own health is at risk from the duration and intensity of care and
assistance that they provide.3 |
| Peoples with disabilities, and their caregivers, are an important
emerging emphasis in public health. |
|
Top
of Page |
|
Public Health Approach |
| |
| Traditionally, public
health has equated disability with poor health and thus addressed it
from a primary prevention standpoint e.g., injury prevention. As a
result, people with disabilities have typically been discussed in
the context of specialized medical care, physical or occupational
rehabilitation, and long-term care financing. |
However, approaches to date
have failed to acknowledge that:
| 1) |
many people with disabilities can live
healthy active lives, |
| 2) |
people with disabilities are can also be
affected by common conditions like high blood pressure and
cancer, |
| 3) |
public health surveys don’t query people
with disabilities by using a standard definition of
“disability,” and |
| 4) |
the environment plays a critical role in the
disabling process. |
|
| The traditional approach to serving people with disabilities in
public health has led to an under-emphasis of health promotion and
disease prevention activities targeting people with disabilities.
1 |
| Currently however for the
first time in history, academics, researchers and clinicians are
examining ways that people with a "disabling" condition can be
healthy. 4 |
| As evidence to the emerging
national shift in the field of disability, there are currently
several surveys that identify people with disabilities as a
subpopulation, e.g. the Census, ACS, NHIS, NHANES, YRBS, and BRFSS. |
| This shift permits epidemiologists to distinguish people with
disabilities from people without disabilities and for the first
time, health data are available for people with disabilities.
Health inequities that have been identified to date are largely
reported in
Data 2010. |
|
Top
of Page |
|
Disability Rates by
Population |
| |
| |
 |
| |
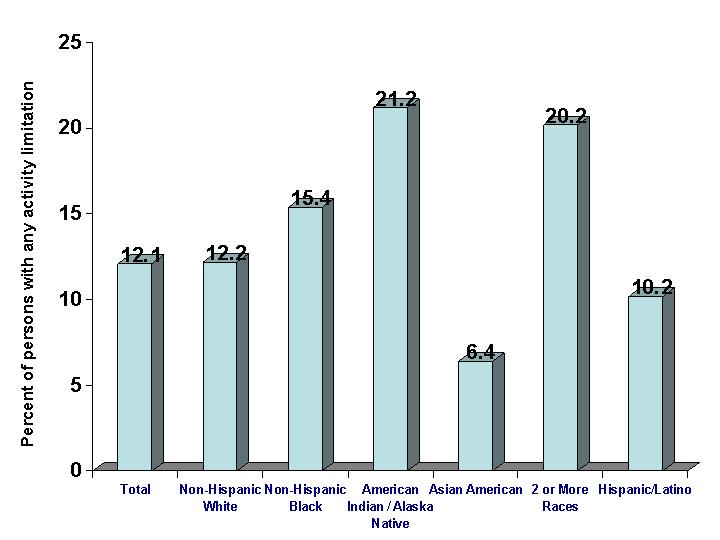
In 2003, American Indians and Alaska
Natives (AI/ANs) were the most likely to have limitations of
activity caused by chronic conditions (21.2%), followed by those of
two or more races (20.2%). Asian Americans were the least likely to
have such limitations (6.4%).5 |
| |
Limitation of
Activity Caused by Chronic Conditions
by Race and Hispanic Origin: U.S., 2003 |
| |
 |
| |
Source:
CDC,
NCHS, Health United States, 2005, table 58 |
| |
From January-June 2004,
Hispanics/Latinos were most likely to need help with personal care
(10.1%), followed by non-Hispanic blacks (9.3%). This compares to
5.6% of non-Hispanic white persons who needed help with personal
care.6 |
|
Top
of Page |
|
Examples of Important Health
Disparities |
| |
Age |
| |
Limitations of activity due to chronic
conditions increase with age: in 2003, 13.0% of adults ages 45-54
years have activity limitations, compared to 44.0% of those ages 75+
years who have such limitations.5 |
| |
Limitation of
Activity Caused by Chronic Conditions
by Age: U.S., 2003 |
| |
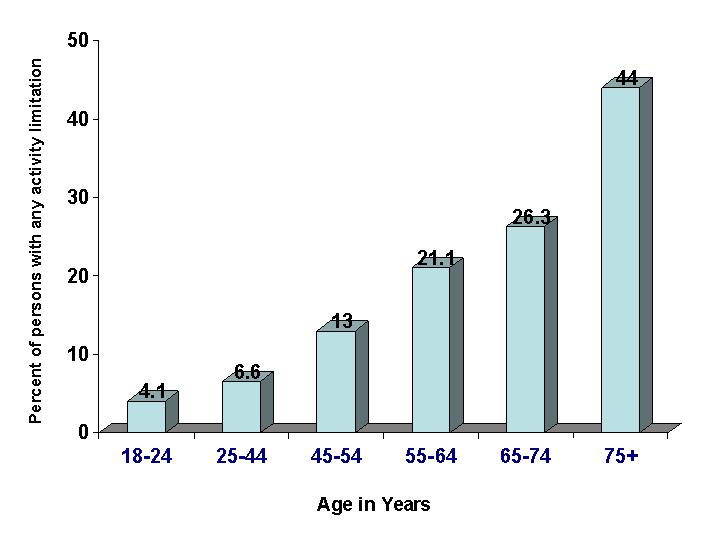 |
| |
Source:
CDC,
NCHS, Health United States, 2005, table 58 |
| |
In January – June 2004, adults ages 85
years and over were more than five times as likely as those ages
65-74 to need help with personal care (17% vs. 3.2%).6 |
|
Top
of Page |
| |
Gender |
| |
In 2003, women ages 18+ were slightly
more likely to have activity limitations because of physical,
mental, or emotional problems compared with men in the same age
group (19.2% vs. 17.6%).7 |
| |
Among adults ages 65 years and older,
women were substantially more likely to require help with personal
care compared with men in the same age group (7.5% vs. 4.9%).6 |
|
Top
of Page |
| |
Geography |
| |
In 2002, people who lived outside a
Metropolitan Statistical Area (MSA) were more likely to have
activity limitations than those who live within an MSA (15.7% vs.
11.2%).5 |
|
Top
of Page |
| |
Socioeconomic Status (SES) |
| |
Both being poor*
is associated with disability and having a disability is associated
with being poor. In 2003, compared with those who are not poor.
Americans who are poor are more likely to have limitations on their
activity due to chronic condition (poor: 23.1%; near poor: 17.0%;
nonpoor: 9.2%).5 |
| |
In 2003, people making less than
$15,000 per year were 2.7 times more likely to have physical
limitations than people making $50,000 or more per year (34.7% vs.
12.9%).8 |
| |
In 2003, poor Hispanics/Latinos were
less likely to have physical limitations (15.5%) than poor
non-Hispanic whites (26.2%) and poor non-Hispanic blacks (26.1%).5
In 2003, 25.2% of people who did not finish high school reported
physical limitations, compared with 15.0% of college graduates.9 |
| |
*
Poor persons are defines as below the poverty
threshold. Near poor persons have incomes of 100 percent to less
than 200 percent of the poverty threshold. Nonpoor persons have
incomes of 200 percent or greater than the poverty threshold. |
|
Top
of Page |
|
Statistics |
| |
| CDC's National Center
for Health Statistics (NCHS) |
| |
Disabilities / Limitations, Fast Stats |
| |
Health Data for All Ages |
| |
Health, United States, 2006 |
| |
Disability |
|
Healthy People 2010 |
| |
Data 2010 |
| |
Mid Course Review |
| U.S. Census Bureau |
| |
Current Population Survey (CPS) Disability Data |
| |
American Community Survey (ACS), 2005 |
| |
Americans with Disabilities, 2002 |
|
Top
of Page |
|
Government Resources |
| |
| Centers for Disease Control and
Prevention (CDC) |
| |
October is National Disabiltiy Awareness Month |
| |
National Center for
Birth Defects and Developmental Disabilities (NCBDDD) |
| |
|
Disabilties |
| |
|
Disabiltiy and Health |
| |
|
|
HP2010 Objectives
for People with Disabilities |
| |
|
|
Minorities with Disabilities |
| |
|
|
Women with
Disabilities |
| |
Injury Center - National Center for Injury Prevention and Control
(NCIPC) |
| |
Chronic Disease Prevention - National Center for
Chronic Disease Prevention and
Health Promotion (NCCDPHP) |
| |
Vaccines &
Immunizations - National Immunization Program
(NIP) |
| Department of Health and Human Services
(HHS) |
| |
DisabilityInfo.gov,
Minority Populations |
| |
National Cancer Institute (NCI) |
| |
National Institute of Diabetes and Digestive and Kidney Diseases
(NIDDK) |
| |
National Institute of Neurological Disorders and Stroke
(NINDS) |
| |
Healthy People 2010 |
| |
|
Chapter 6: Disability |
|
Non-Government Resources |
| |
| |
American Cancer Society (ACS) |
| |
American
Diabetes Association
(ADA) |
|
Top
of Page |
|
Funding |
| |
|
CDC Funding Opportunities |
|
Top
of Page |
|
Sources |
| |
|
1. |
Healthy People, 2010, Chapter 6:
Disability and Secondary Conditions |
|
2. |
U.S. Census Bureau, Disability Status,
2000 |
|
3. |
Family Caregiver Alliance, Selected
Caregiver Statistics |
|
4. |
Centers for Disease Control and
Prevention (CDC), National Center on Birth Defects and Developmental
Disabilities (NCBDDD), Disability and Health, 2006 |
|
5. |
CDC, National Center for Health
Statistics (NCHS), Health United States 2005, table 58 |
|
6. |
CDC, NCHS, Early Release of Selected
Estimates Based on Data from the January-June 2004 National Health
Interview Survey |
|
7. |
CDC, National Center for Chronic
Disease Prevention and Health Promotion (NCCDPHP), Behavioral Risk
Factor Surveillance Survey (BRFSS), Adults who are limited in any
activities because of physical, mental, or emotional problems,
Grouped by Gender |
|
8. |
CDC, National Center for Chronic
Disease Prevention and Health Promotion (NCCDPHP), Behavioral Risk
Factor Surveillance Survey (BRFSS), Adults who are limited in any
activities because of physical, mental, or emotional problems,
Grouped by Income |
|
9. |
CDC, National Center for Chronic
Disease Prevention and Health Promotion (NCCDPHP), Behavioral Risk
Factor Surveillance Survey (BRFSS), Adults who are limited in any
activities because of physical, mental, or emotional problems,
Grouped by Education |
|
Top
of Page |