Skip all navigation and jump to content Jump to site navigation Jump to section navigation.
NASA Logo - Goddard Space Flight Center + Visit NASA.gov
HOME PROJECTS RESOURCES SEARCH MAP

+ Advanced Search
Home
Home
View Most Recently Released Imagery
View Gallery of Imagery: A topical collection of SVS Imagery
Search Imagery by the keywords assigned to it
Search Imagery by the instruments that supplied data for a visualization product
Search Imagery by the series of visualizations that have been produced
Search Imagery by the scientist providing the data used in a visualization product
Search Imagery by the animator that created the product
Search Imagery by the identification number assigned to the visualization product
See other search options
Learn about the SVS Image Server
  + About the Server
  + Animation List
  + How to Use the Server


  + RSS Feeds
blank image
Previous Animation
Next Animation
Global Surface Latent Heat Flux during Hurricane Frances (WMS)

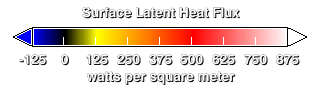
As the Sun's energy reaches the Earth, it is either reflected, absorbed by the clouds, or absorbed by the Earth's surface. The part absorbed by the surface heats the Earth, which causes surface water to evaporate to the air, particularly over oceans or moist land. Similarly, a cold surface causes water to condense from the air onto the land or ocean. Latent heat flux is the amount of energy moving from the surface to the air due to evaporation (positive values) or from the air to the land due to condensation (negative values). This animation shows the latent heat flux for the whole globe from September 1, 2004, through September 5, 2004, during the period of Hurricane Frances in the western Atlantic Ocean and Typhoon Songda in the western Pacific Ocean. The animation clearly shows the evaporation over land only during the heat of the day, while the evaporation over the ocean is continuous throughout the day. The highest positive latent heat flux occurs during hurricanes and typhoons, as these events are powered by the movement of heat energy from the warm ocean to the atmosphere, seen here in Hurricane Frances and Typhoon Songda. Significant negative latent heat flux is somewhat rare and occurs over the ocean only during certain configurations of air and surface conditions.

Global surface latent heat flux from the 0.25 degree resolution fvGCM atmospheric model for the period 9/1/2005 through 9/5/2005.    Global surface latent heat flux from the 0.25 degree resolution fvGCM atmospheric model for the period 9/1/2005 through 9/5/2005.
Duration: 20.0 seconds
Available formats:
  320x160     JPEG         18 KB
  160x80       PNG           29 KB
  80x40         PNG           8 KB
  640x320 (29.97 fps) MPEG-1   5 MB
  1000x721   Frames
How to play our movies

This product is available through our Web Map Service.   Click here to learn more.


Legend for the surface latent heat flux.
   Legend for the surface latent heat flux.

Available formats:
  320 x 90           PNG   1 KB

Animation Number:3199
Animator:Horace Mitchell (SVS) (Lead)
Completed:2005-07-25
Scientist:William Putman (NASA/GSFC)
Data set:fvGCM
Data Collected:2005-09-01T03:00 -- 2005-09-05T24:00
Series:WMS
 fvGCM
Keywords:
DLESE >> Atmospheric science
DLESE >> Natural hazards
GCMD >> EARTH SCIENCE >> Atmosphere >> Atmospheric Phenomena >> Hurricanes
GCMD >> EARTH SCIENCE >> Atmosphere >> Atmospheric Phenomena >> Typhoons
GCMD >> EARTH SCIENCE >> Atmosphere >> Atmospheric Radiation >> Heat Flux
GCMD >> EARTH SCIENCE >> Human Dimensions >> Natural Hazards >> Meteorological Hazards
GCMD >> Location >> Global
SVS >> Hurricane Frances
View Animation in Google Earth Google Earth KML file is available here.
DEPC Metadata is available here.
 
 
Please give credit for this item to
NASA/Goddard Space Flight Center Scientific Visualization Studio


Back to Top

USA.gov logo - the U.S. Government's official Web portal. + Privacy Policy and Important Notices
+ Reproduction Guidelines
NASA NASA Official:
SVS Contact:
Curator: