Skip all navigation and jump to content Jump to site navigation Jump to section navigation.
NASA Logo - Goddard Space Flight Center + Visit NASA.gov
HOME PROJECTS RESOURCES SEARCH MAP

+ Advanced Search
Home
Home
View Most Recently Released Imagery
View Gallery of Imagery: A topical collection of SVS Imagery
Search Imagery by the keywords assigned to it
Search Imagery by the instruments that supplied data for a visualization product
Search Imagery by the series of visualizations that have been produced
Search Imagery by the scientist providing the data used in a visualization product
Search Imagery by the animator that created the product
Search Imagery by the identification number assigned to the visualization product
See other search options
Learn about the SVS Image Server
  + About the Server
  + Animation List
  + How to Use the Server


  + RSS Feeds
blank image
Previous Animation
Next Animation
Global Atmospheric Surface Pressure during Hurricane Frances (WMS)

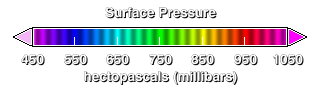
The weight of the Earth's atmosphere exerts pressure on the surface of the Earth. This pressure varies from place-to-place due the variations in the Earth's surface since higher altitudes have less atmosphere above them than lower altitudes. Atmospheric pressure also varies from time-to-time due to the uneven heating of the atmosphere by the sun and the rotation of the Earth, causing weather. This animation shows the atmospheric surface pressure for the whole globe from September 1, 2004, through September 5, 2004, during the period of Hurricane Frances in the western Atlantic Ocean and Typhoon Songda in the western Pacific Ocean. The major changes in pressure occur over land where the surface altitude varies, but the sharp, moving low pressures areas for Frances and Songda can be clearly seen in the oceans. Since changing surface pressure areas over land are hard to see in these images due to the strong altitude variations, plots of the atmospheric surface pressure are almost never used to study the weather. A different plot, of sea-level pressure, is used instead.

Global atmospheric surface pressure from the 0.25 degree resolution fvGCM atmospheric model for the period 9/1/2005 through 9/5/2005.    Global atmospheric surface pressure from the 0.25 degree resolution fvGCM atmospheric model for the period 9/1/2005 through 9/5/2005.
Duration: 20.0 seconds
Available formats:
  320x160     JPEG         11 KB
  160x80       PNG           24 KB
  80x40         PNG           6 KB
  1000x721   Frames
  640x320 (29.97 fps) MPEG-1   5 MB
How to play our movies

This product is available through our Web Map Service.   Click here to learn more.


Legend for the atmospheric surface pressure.
   Legend for the atmospheric surface pressure.

Available formats:
  320 x 90           PNG   1 KB

Animation Number:3197
Animator:Horace Mitchell (SVS) (Lead)
Completed:2005-07-25
Scientist:William Putman (NASA/GSFC)
Data set:fvGCM
Data Collected:2005-09-01T03:00 -- 2005-09-05T24:00
Series:WMS
 fvGCM
Keywords:
DLESE >> Atmospheric science
DLESE >> Natural hazards
GCMD >> EARTH SCIENCE >> Atmosphere >> Atmospheric Phenomena >> Hurricanes
GCMD >> EARTH SCIENCE >> Atmosphere >> Atmospheric Phenomena >> Typhoons
GCMD >> EARTH SCIENCE >> Atmosphere >> Atmospheric Pressure >> Surface Pressure
GCMD >> EARTH SCIENCE >> Human Dimensions >> Natural Hazards >> Meteorological Hazards
GCMD >> Location >> Global
SVS >> Hurricane Frances
View Animation in Google Earth Google Earth KML file is available here.
DEPC Metadata is available here.
 
 
Please give credit for this item to
NASA/Goddard Space Flight Center Scientific Visualization Studio


Back to Top

USA.gov logo - the U.S. Government's official Web portal. + Privacy Policy and Important Notices
+ Reproduction Guidelines
NASA NASA Official:
SVS Contact:
Curator: