Rainfall Accumulation from Hurricane Isabel (WMS)
|
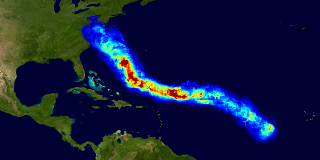
Hurricane Isabel generated large amounts of rain over the Atlantic ocean as it approached East coast of the United States in September 2003. In fact, unlike many hurricanes, most of the Isabel's rainfall did not occur over land; flooding on land was caused mainly by storm surge. This animation shows accumulation of rainfall from the hurricane--each frame shows the total amount of rain since the start of the measurement period. Rain from other sources has been masked out, so the hurricane track is clearly visible as the storm moves across the Atlantic.
|
|
|
|
Animation of Hurricane Isabel rainfall
accumulation from September 6 through 19, 2003. Frames were
taken every 3 hours starting at 00:00UT on 2003-09-06. Each
pixel covers 0.25deg of longitude and latitude; the total area shown
is 80x40 degrees.
Duration: 2.0 seconds
Available formats:
320x160 (29.97 fps)
MPEG-1
485 KB
80x40
PNG
8 KB
320x160
PNG
70 KB
160x80
PNG
27 KB
How to play our movies
|
|
This product is available through our Web Map Service.
Click here to learn more.
|
|
|
|
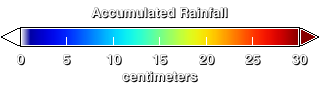
Color scale for accumulated rainfall map, ranging from deep blue (less than 5cm) up to deep red (30cm or more).
Available formats:
320 x 90
PNG
886 B
|
|
|
Back to Top
|


