|
|
 |
Super-Typhoon Pongsona Visualized from AIRS Instrument Suite Data
|
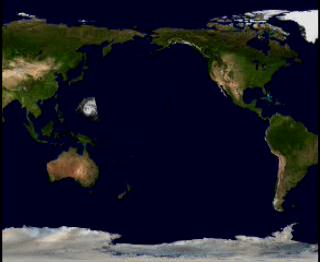
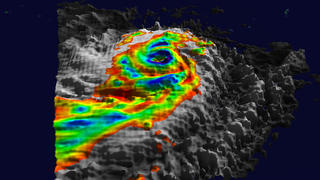
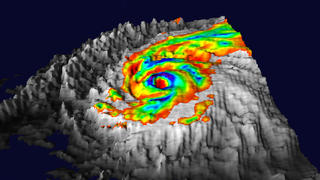
Packing gusts of nearly 300 kilometers per hour (184 miles per hour) and sustained winds of 240 kilometers per hour (150 miles per hour), Super-Typhoon Pongsona struck the U.S. Island of Guam on December 8, 2002. This 3D model of the hurricane shows the outline of the clouds, based on cloud top heights derived from AIRS observations. The color overlay represents the brightness temperatures observed in one of the HSB channels. Blue areas indicate intense convection and rain, while green and yellow reflect the internal temperature of the clouds. Microwaves, unlike infrared radiation, penetrate clouds and look into them or even through them. Red, most of which has been removed from the picture for clarity, represents areas where HSB penetrates all the way to the surface.
|
|
|
|
The 3D model represents cloud tops estimated from an AIRS window channel. (This channel essentially measures the temperature of the nearest impenetrable surface seen from the satellite, either clouds or ocean-land. Using an estimate of the vertical temperature distribution in the atmosphere, the temperature field is then converted to a cloud top height field.)
Duration: 21.0 seconds
Available formats:
320x240 (14.98 fps)
QT
1 MB
320x240 (29.97 fps)
MPEG-1
2 MB
320x262
JPEG
10 KB
640x480 (29.97 fps)
MPEG-1
8 MB
720x480 (29.97 fps)
MPEG-2
15 MB
720x480 (29.97 fps)
DV
72 MB
320x240 (29.97 fps)
X-FLV
709 KB
How to play our movies
|
|
|
|
The color overlay represents the brightness temperature observed in one of the HSB channels. The most important color is blue, which indicates intense convection and likely rain cells. Green generally indicates thick clouds, while red indicates thin low clouds. (Microwave, unlike infrared, penetrates clouds and looks into them or even through them.)
Available formats:
1920 x 1080
TIFF
1 MB
160 x 80
PNG
12 KB
320 x 180
JPEG
9 KB
80 x 40
PNG
4 KB
|
|

|
|
The deepest red from HSB has been removed from the overlay, so that grey indicates clouds detected by AIRS that are more or less transparent to HSB.
Available formats:
1920 x 1080
TIFF
1 MB
320 x 180
JPEG
14 KB
|
|
|
|
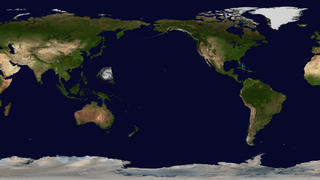
Super-Typhoon Pongsona struck the U.S. Island of Guam on December 8, 2002.
Available formats:
1920 x 1080
TIFF
1 MB
320 x 180
JPEG
15 KB
|
|

|
|
None
Available formats:
720 x 528
JPEG
135 KB
320 x 234
PNG
344 KB
|
|
|
Back to Top
|
|
|
|

