

|
(PDF)
Tomorrow's JobsMaking informed career decisions requires reliable information about opportunities in the future. Opportunities result from the relationships between the population, labor force, and the demand for goods and services. Population ultimately limits the size of the labor force—individuals working or looking for work—which limits the goods and services that can be produced. Demand for various goods and services is largely responsible for employment in the industries providing them. Employment opportunities, in turn, result from demand for skills needed within specific industries. Opportunities for medical assistants and other healthcare occupations, for example, have surged in response to rapid growth in demand for health services. Examining the past and present, and projecting changes in these relationships is the foundation of the Occupational Outlook Program. This chapter presents highlights of Bureau of Labor Statistics’ projections of the labor force and occupational and industry employment that can help guide your career plans.
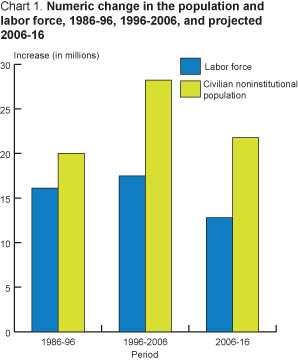
Population trends affect employment opportunities in a number of ways. Changes in population influence the demand for goods and services. For example, a growing and aging population has increased the demand for health services. Equally important, population changes produce corresponding changes in the size and demographic composition of the labor force. The U.S. civilian noninstitutional population is expected to increase by 21.8 million over the 2006-2016 period (Chart 1). The 2006-2016 rate of growth is slower than the growth rate over the 1986-1996 and 1996-2006 periods—9 percent, 11 percent, and 13 percent, respectively. Continued growth, however, will mean more consumers of goods and services, spurring demand for workers in a wide range of occupations and industries. The effects of population growth on various occupations will differ. The differences are partially accounted for by the age distribution of the future population.  As the baby boomers continue to age, the 55 to 64 age group will increase by 30.3 percent or 9.5 million persons, more than any other group. The 35 to 44 age group will decrease by 5.5 percent, reflecting a slowed birth rate following the baby boom generation, while the youth population, aged 16 to 24, will decline 1.1 percent over the 2006-2016 period. Minorities and immigrants will constitute a larger share of the U.S. population in 2016. The number of Asians and people of Hispanic origin are projected to continue to grow much faster than other racial and ethnic groups.
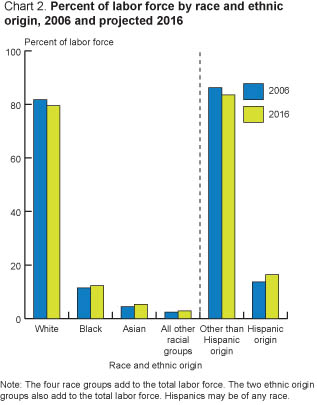
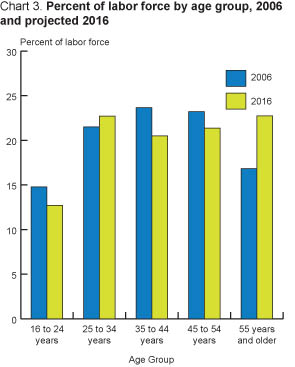
Population is the single most important factor in determining the size and composition of the labor force—people either working or looking for work. The civilian labor force is projected to increase by 12.8 million, or 8.5 percent, to 164.2 million over the 2006-2016 period. TThe U.S. workforce will become more diverse by 2016. White, non-Hispanic persons will continue to make up a decreasing share of the labor force, falling from 69.1 percent in 2006 to 64.6 percent in 2016 (Chart 2). However, despite relatively slow growth, white non-Hispanics will remain the overwhelming majority of the labor force. Hispanics are projected be the fastest growing ethnic group, growing by 29.9 percent. By 2016, Hispanics will continue to constitute an increasing proportion of the labor force, growing from 13.7 percent to 16.4 percent. Asians are projected to account for an increasing share of the labor force by 2016, growing from 4.4 to 5.3 percent. Blacks will also increase their share of the labor force, growing from 11.4 percent to 12.3 percent.  The numbers of men and women in the labor force will grow, but the number of women will grow at a slightly faster rate than the number of men. The male labor force is projected to grow by 8.0 percent from 2006 to 2016, compared with 8.9 percent for women, down from 12.7 and 13.4 percent, respectively, from 1996 to 2006. As a result, men’s share of the labor force is expected to decrease from 53.7 to 53.4 percent, while women’s share is expected to increase from 46.3 to 46.6 percent. The youth labor force, aged 16 to 24, is expected to decrease its share of the labor force to 12.7 percent by 2016. The primary working age group, between 25 and 54 years old, is projected to decline from 68.4 percent of the labor force in 2006 to 64.6 percent by 2016. Workers 55 and older, on the other hand, are projected to leap from 16.8 percent to 22.7 percent of the labor force between 2006 and 2016 (Chart 3). The aging of the baby boom generation will cause not only an increase in the percentage of workers in the oldest age category, but a decrease in the percentage of younger workers. 
Total employment is expected to increase from 150.6 million in 2006 to 166.2 million in 2016, or by 10 percent. The 15.6 million jobs that will be added by 2016 will not be evenly distributed across major industrial and occupational groups. Changes in consumer demand, technology, and many other factors will contribute to the continually changing employment structure in the U.S. economy. The following two sections examine projected employment change from industrial and occupational perspectives. The industrial profile is discussed in terms of primary wage and salary employment. Primary employment excludes secondary jobs for those who hold multiple jobs. The exception is employment in agriculture, which includes self-employed and unpaid family workers in addition to wage and salary workers. The occupational profile is viewed in terms of total employment—including primary and secondary jobs for wage and salary, self-employed, and unpaid family workers. Of the roughly 150 million jobs in the U.S. economy in 2006, wage and salary workers accounted for 138.3 million, self-employed workers accounted for 12.2 million, and unpaid family workers accounted for about 130,000. Secondary employment accounted for 1.8 million jobs. Self-employed workers held nearly 9 out of 10 secondary jobs and wage and salary workers held most of the remainder.
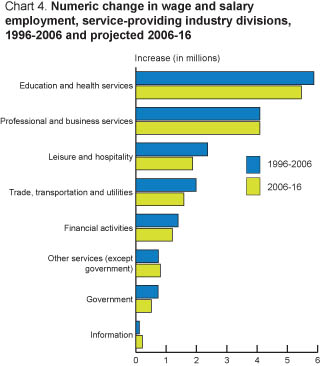
Service-providing industries. The long-term shift from goods-producing to service-providing employment is expected to continue. Service-providing industries are expected to account for approximately 15.7 million new wage and salary jobs generated over the 2006-2016 period (Chart 4), while goods-producing industries will see overall job loss.  Education and health services. This industry supersector is projected to grow by 18.8 percent, and add more jobs, nearly 5.5 million, than any other industry supersector. More than 3 out of every 10 new jobs created in the U.S. economy will be in either the healthcare and social assistance or public and private educational services sectors. Healthcare and social assistance—including public and private hospitals, nursing and residential care facilities, and individual and family services—will grow by 25.4 percent and add 4 million new jobs. Employment growth will be driven by increasing demand for healthcare and social assistance because of an aging population and longer life expectancies. Also, as more women enter the labor force, demand for childcare services is expected to grow. Public and private educational services will grow by 10.7 percent and add 1.4 million new jobs through 2016. Rising student enrollments at all levels of education will create demand for educational services. Professional and business services. This industry supersector, which includes some of the fastest growing industries in the U.S. economy, will grow by 23.3 percent and add 4.1 million new jobs. Employment in administrative and support and waste management and remediation services will grow by 20.3 percent and add 1.7 million new jobs to the economy by 2016. The largest industry growth in this sector will be enjoyed by employment services, which will be responsible for 692,000 new jobs, or over 40 percent of all new jobs in administrative and support and waste management and remediation services. Employment services ranks second among industries with the most new employment opportunities in the Nation and is expected to have a growth rate that is faster than the average for all industries. This will be due to the need for seasonal and temporary workers and for highly specialized human resources services. Employment in professional, scientific, and technical services will grow by 28.8 percent and add 2.1 million new jobs by 2016. Employment in computer systems design and related services will grow by 38.3 percent and add nearly one-fourth of all new jobs in professional, scientific, and technical services. Employment growth will be driven by the increasing reliance of businesses on information technology and the continuing importance of maintaining system and network security. Management, scientific, and technical consulting services also will grow at a staggering 78 percent and account for another third of growth in this supersector. Demand for these services will be spurred by the increased use of new technology and computer software and the growing complexity of business. Management of companies and enterprises will grow by 14.9 percent and add 270,000 new jobs. Information. Employment in the information supersector is expected to increase by 6.9 percent, adding 212,000 jobs by 2016. Information contains some of the fast-growing computer-related industries such as software publishing, Internet publishing and broadcasting, and wireless telecommunication carriers. Employment in these industries is expected to grow by 32 percent, 44.1 percent, and 40.9 percent, respectively. The information supersector also includes motion picture production; broadcasting; and newspaper, periodical, book, and directory publishing. Increased demand for telecommunications services, cable service, high-speed Internet connections, and software will fuel job growth among these industries. Leisure and hospitality. Overall employment will grow by 14.3 percent. Arts, entertainment, and recreation will grow by 30.9 percent and add 595,000 new jobs by 2016. Most of these new job openings, 79 percent, will be in the amusement, gambling, and recreation sector. Job growth will stem from public participation in arts, entertainment, and recreation activities—reflecting increasing incomes, leisure time, and awareness of the health benefits of physical fitness. Accommodation and food services is expected to grow by 11.4 percent and add 1.3 million new jobs through 2016. Job growth will be concentrated in food services and drinking places, reflecting increases in population, dual-income families, and the convenience of many new food establishments. Trade, transportation, and utilities. Overall employment in this industry supersector will grow by 6 percent between 2006 and 2016. Transportation and warehousing is expected to increase by 496,000 jobs, or by 11.1 percent through 2016. Truck transportation will grow by 11 percent, adding 158,000 new jobs, while rail transportation is projected to decline. The warehousing and storage sector is projected to grow rapidly at 23.5 percent, adding 150,000 jobs. Demand for truck transportation and warehousing services will expand as many manufacturers concentrate on their core competencies and contract out their product transportation and storage functions. Employment in retail trade is expected to increase by 4.5 percent. Despite slower than average growth, this industry will add almost 700,000 new jobs over the 2006-2016 period, growing from 15.3 million employees to 16 million. While consumers will continue to demand more goods, consolidation among grocery stores and department stores will temper growth. Wholesale trade is expected to increase by 7.3 percent, growing from 5.9 million to 6.3 million jobs. Employment in utilities is projected to decrease by 5.7 percent through 2016. Despite increased output, employment in electric power generation, transmission, and distribution and natural gas distribution is expected to decline through 2016 due to improved technology that increases worker productivity. However, employment in water, sewage, and other systems is expected to increase 18.7 percent by 2016. Jobs are not easily eliminated by technological gains in this industry because water treatment and waste disposal are very labor-intensive activities. Financial activities. Employment is projected to grow 14.4 percent over the 2006-2016 period. Real estate and rental and leasing is expected to grow by 18 percent and add 392,000 jobs by 2016. Growth will be due, in part, to increased demand for housing as the population grows. The fastest growing industry in the real estate and rental and leasing services sector will be activities related to real estate, such as property management and real estate appraisal, which will grow by 29 percent—remnants of the housing boom that pervaded much of the first half of the decade. Finance and insurance are expected to add 815,000 jobs, an increase of 13.2 percent, by 2016. Employment in securities, commodity contracts, and other financial investments and related activities is expected to grow 46 percent by 2016, reflecting the increased number of baby boomers in their peak savings years, the growth of tax-favorable retirement plans, and the globalization of the securities markets. Employment in credit intermediation and related services, including banks, will grow by 8.2 percent and add almost one-third of all new jobs within finance and insurance. Insurance carriers and related activities are expected to grow by 7.4 percent and add 172,000 new jobs by 2016. The number of jobs within agencies, brokerages, and other insurance related activities is expected to grow about 15.4 percent. Growth will stem from the needs of an increasing population and new insurance products on the market. Government. Between 2006 and 2016, government employment, not including employment in public education and hospitals, is expected to increase by 4.8 percent, from 10.8 million to 11.3 million jobs. Growth in government employment will be fueled by an increased demand for pubic safety, but dampened by budgetary constraints and outsourcing of government jobs to the private sector. State and local governments, excluding education and hospitals, are expected to grow by 7.7 percent as a result of the continued shift of responsibilities from the Federal Government to State and local governments. Federal Government employment, including the Postal Service, is expected to decrease by 3.8 percent. Other services (except government and private households). Employment will grow by 14.9 percent. About 2 out of every 5 new jobs in this supersector will be in religious organizations, which are expected to grow by 18.9 percent. Other automotive repair and maintenance will be the fastest growing industry at 40.7 percent, reflecting demand for quick maintenance services for the increasing number of automobiles on the Nation’s roads. Also included among other services are business, professional, labor, political, and similar organizations, which are expected to increase by 13.6 percent and add 68,000 new jobs. This industry includes homeowner, tenant, and property owner associations. Goods-producing industries. Employment in the goods-producing industries has been relatively stagnant since the early 1980s. Overall, this sector is expected to decline 3.3 percent over the 2006-2016 period. Although employment is expected to decline overall, projected growth among goods-producing industries varies considerably (Chart 5). 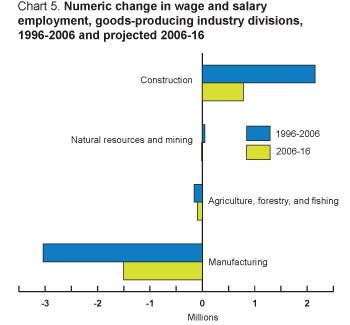 Construction. Employment in construction is expected to increase by 10.2 percent, from 7.7 million to 8.5 million. Demand for commercial construction and an increase in road, bridge, and tunnel construction will account for the bulk of job growth in this supersector. Manufacturing. While overall employment in this supersector will decline by 10.6 percent or 1.5 million jobs, employment in a few detailed manufacturing industries will increase. For example, employment in pharmaceutical and medicine manufacturing is expected to grow by 23.8 percent and add 69,000 new jobs by 2016. However, productivity gains, job automation, and international competition will adversely affect employment in most manufacturing industries. Employment in household appliance manufacturing is expected to decline by 25.8 percent and lose 21,000 jobs over the decade. Similarly, employment in machinery manufacturing, apparel manufacturing, and computer and electronic product manufacturing will decline by 146,000, 129,000, and 157,000 jobs, respectively. Agriculture, forestry, fishing, and hunting. Overall employment in agriculture, forestry, fishing, and hunting is expected to decrease by 2.8 percent. Employment is expected to continue to decline due to rising costs of production, increasing consolidation, and more imports of food and lumber. The only industry within this supersector expected to grow is support activities for agriculture and forestry, which includes farm labor contractors and farm management services. This industry is expected to grow by 10.5 percent and add 12,000 new jobs. Crop production will see the largest job loss, with 98,000 fewer jobs in 2016 than in 2006. Mining. Employment in mining is expected to decrease 1.6 percent, or by some 10,000 jobs, by 2016. Employment in support activities for mining will be responsible for most of the employment decline in this industry, seeing a loss of 17,000 jobs. Other mining industries, such as coal mining and metal ore mining, are expected to see little or no change or a small increase in employment. Employment stagnation in these industries is attributable mainly to technology gains that boost worker productivity and strict environmental regulations.
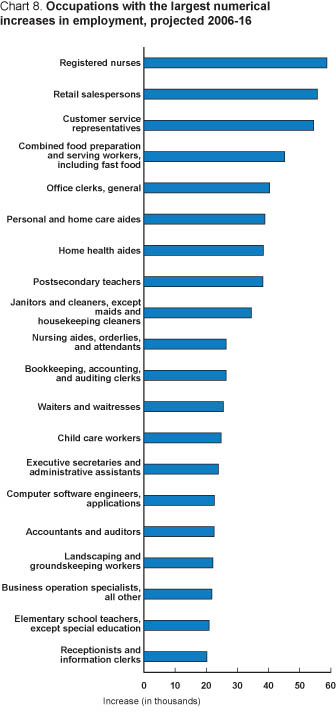
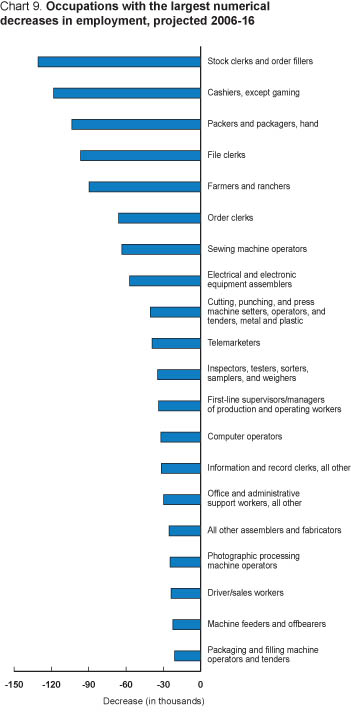
Expansion of service-providing industries is expected to continue, creating demand for many occupations. However, projected job growth varies among major occupational groups (Chart 6). 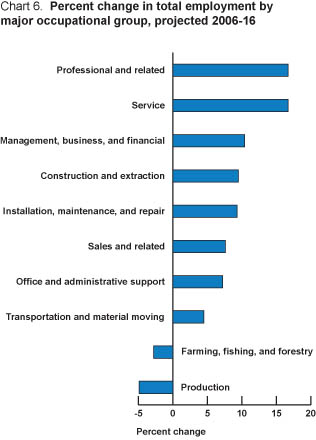 Professional and related occupations. These occupations include a wide variety of skilled professions. Professional and related occupations will be one of the two fastest growing major occupational groups, and will add the most new jobs. Over the 2006-2016 period, a 16.7-percent increase in the number of professional and related jobs is projected, which translates into nearly 5 million new jobs. Professional and related workers perform a wide variety of duties, and are employed throughout private industry and government. Almost three-quarters of the job growth will come from three groups of professional occupations—computer and mathematical occupations, healthcare practitioners and technical occupations, and education, training, and library occupations—which together will add 3.5 million jobs. Service occupations. Duties of service workers range from fighting fires to cooking meals. Employment in service occupations is projected to increase by 4.8 million, or 16.7 percent, the second largest numerical gain and tied with professional and related occupations for the fastest rate of growth among the major occupational groups. Food preparation and serving related occupations are expected to add the most jobs among the service occupations, 1.4 million, by 2016. However, healthcare support occupations and personal care and service occupations are expected to grow the fastest, at 26.8 percent and 22 percent, respectively. Combined, these two occupational groups will account for 2.1 million new jobs. Management, business, and financial occupations. Workers in management, business, and financial occupations plan and direct the activities of business, government, and other organizations. Their employment is expected to increase by 1.6 million, or 10.4 percent, by 2016. Among management occupations, the numbers of social and community service mangers and gaming managers will grow the fastest, by 24.7 percent and 24.4 percent, respectively. Construction managers will add the most new jobs—77,000—by 2016. Farmers and ranchers are the only workers whose numbers are expected to see a large decline, losing 90,000 jobs. Among business and financial occupations, accountants and auditors and all other business operation specialists will add the most jobs, 444,000 combined. Financial analysts and personal financial advisors will be the fastest growing occupations in this group, with growth rates of 33.8 percent and 41 percent, respectively. Construction and extraction occupations. Construction and extraction workers build new residential and commercial buildings, and also work in mines, quarries, and oil and gas fields. Employment of these workers is expected to grow 9.5 percent, adding 785,000 new jobs. Construction trades and related workers will account for nearly 4 out of 5 of these new jobs, or 622,000, by 2016. Minor declines in extraction occupations will reflect overall employment stagnation in the mining and oil and gas extraction industries. Installation, maintenance, and repair occupations. Workers in installation, maintenance, and repair occupations install new equipment and maintain and repair older equipment. These occupations will add 550,000 jobs by 2016, growing by 9.3 percent. Automotive service technicians and mechanics and general maintenance and repair workers will account for close to half of all new installation, maintenance, and repair jobs. The fastest growth rate will be among locksmiths and safe repairers, an occupation that is expected to grow 22.1 percent over the 2006-2016 period. Transportation and material moving occupations. Transportation and material moving workers transport people and materials by land, sea, or air. Employment of these workers should increase by 4.5 percent, accounting for 462,000 new jobs by 2016. Among transportation occupations, motor vehicle operators will add the most jobs, 368,000. Material moving occupations will decline slightly, 0.5 percent, losing 25,000 jobs. Sales and related occupations. Sales and related workers solicit goods and services to businesses and consumers. Sales and related occupations are expected to add 1.2 million new jobs by 2016, growing by 7.6 percent. Retail salespersons will contribute the most to this grow by adding 557,000 new jobs. Office and administrative support occupations. Office and administrative support workers perform the day-to-day activities of the office, such as preparing and filing documents, dealing with the public, and distributing information. Employment in these occupations is expected to grow by 7.2 percent, adding 1.7 million new jobs by 2016. Customer service representatives will add the most new jobs, 545,000, while stock clerks and order fillers is expected to see the largest employment decline among all occupations, losing 131,000 jobs. Farming, fishing, and forestry occupations. Farming, fishing, and forestry workers cultivate plants, breed and raise livestock, and catch animals. These occupations will decline 2.8 percent and lose 29,000 jobs by 2016. Agricultural workers, including farmworkers and laborers, will account for nearly 3 out of 4 lost jobs in this group. The number of fishing and hunting workers is expected to decline by 16.2 percent, while the number of forest, conservation, and logging workers is expected to decline by 1.4 percent. Production occupations. Production workers are employed mainly in manufacturing, where they assemble goods and operate plants. Production occupations are expected to decline by 4.9 percent, losing 528,000 jobs by 2016. Some jobs will be created in production occupations, mostly in food processing and woodworking. Metal workers and plastic workers; assemblers and fabricators; textile, apparel, and furnishings occupations; and other production workers will account for most of the job loss among production occupations. Among all occupations in the economy, healthcare occupations are expected to make up 7 of the 20 fastest growing occupations, the largest proportion of any occupational group (Chart 7). These 7 healthcare occupations, in addition to exhibiting high growth rates, will add nearly 750,000 new jobs between 2006 and 2016. Other occupational groups that have more than one occupation in the 20 fastest growing occupations are computer occupations, personal care and service occupations, community and social services occupations, and business and financial operations occupations. High growth rates among occupations in the top 20 fastest growing occupations reflect projected rapid growth in the health care and social assistance industries and the professional, scientific, and technical services industries. 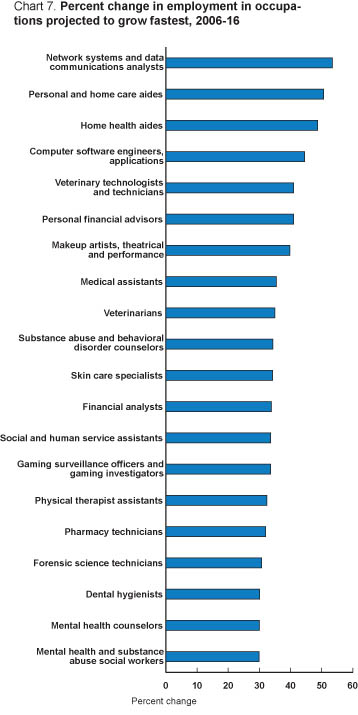 The 20 occupations listed in Chart 8 will account for more than one-third of all new jobs, 6.6 million combined, over the 2006-2016 period. The occupations with the largest numerical increases cover a wider range of occupational categories than do those occupations with the fastest growth rates. Health occupations will account for some of these increases in employment, as will occupations in education, sales, and food service. Occupations in office and administrative services will grow by 1.7 million jobs, one-fourth of the job growth among the 20 occupations with the largest job growth. Many of the occupations listed below are very large, and will create more new jobs than will those with high growth rates. Only 3 out of the 20 fastest growing occupations—home health aides, personal and home care aides, and computer software application engineers—also are projected to be among the 20 occupations with the largest numerical increases in employment.  Declining occupational employment stems from declining industry employment, technological advances, changes in business practices, and other factors. For example, installation of self-checkouts and other forms of automation will increase productivity and are expected to contribute to a decline of 118,000 cashiers over the 2006-2016 period (Chart 9). Fourteen of the 20 occupations with the largest numerical decreases are either production occupations or office and administrative support occupations, which are affected by increasing plant and factory automation and the implementation of office technology that reduces the need for these workers. The difference between the office and administrative occupations that are expected to experience the largest declines and those that are expected to see the largest increases is the extent to which job functions can be easily automated or performed by other workers. For instance, the duties of executive secretaries and administrative assistants involve a great deal of personal interaction that cannot be automated, while the duties of file clerks—adding, locating, and removing business records—can be automated or performed by other workers. 
For 12 of the 20 fastest growing occupations, an associate degree or higher is the most significant level of postsecondary education or training. On-the-job training is the most significant level of postsecondary education or training for another 6 of the 20 fastest growing occupations. In contrast, on-the-job training is the most significant level of postsecondary education or training for 12 of the 20 occupations with the largest numerical increases, while 6 of these 20 occupations have an associate degree or higher as the most significant level of postsecondary education or training. On-the-job training is the most significant level of postsecondary education or training for 19 of the 20 occupations with the largest numerical decreases. Table 1 lists the fastest growing occupations and occupations projected to have the largest numerical increases in employment between 2006 and 2016, by level of postsecondary education or training.
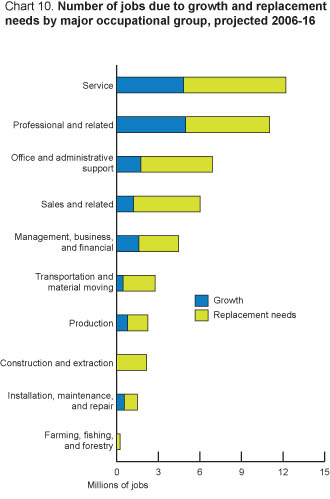
Job openings stem from both employment growth and replacement needs (Chart 10). Replacement needs arise as workers leave occupations. Some transfer to other occupations while others retire, return to school, or quit to assume household responsibilities. Replacement needs are projected to account for 68 percent of the approximately 50 million job openings between 2006 and 2016. Thus, even occupations projected to experience slower than average growth or to decline in employment still may offer many job openings.  Service occupations are projected to have the largest number of total job openings, 12.2 million, and 60 percent of those will be due to replacement needs. A large number of replacements will be necessary as young workers leave food preparation and service occupations. Replacement needs generally are greatest in the largest occupations and in those with relatively low pay or limited training requirements. Professional and related occupations are projected to be one of the two fastest growing major occupational groups, and are expected to add more jobs than any other major occupational group, about 5 million, by 2016. However, the majority of job openings are expected to come from more than 6 million replacements. Office automation will significantly affect many individual office and administrative support occupations. While these occupations are projected to grow about as fast as average, some are projected to decline rapidly. Office and administrative support occupations are projected to create 6.9 million total job openings over the 2006-2016 period, ranking third behind service occupations and professional and related occupations. Farming, fishing, and forestry occupations and production occupations should offer job opportunities despite overall declines in employment. These occupations will lose 29,000 and 528,000 jobs, respectively, but are expected to provide more than 2.4 million total job openings. Job openings among these groups will be solely due to the replacement needs of a workforce that is exhibiting high levels of retirement and job turnover.
Last Modified Date: December 18, 2007 |
Tools |
Calculators |
Help |
Info |