 |
 |

|
Print  Download Reader
|
|
|
Print Download Reader
|
Program Performance by HHS Strategic GoalIntroductionThe Department of Health and Human Services (HHS) is one of the largest federal agencies, the Nation's largest health insurer, and the largest grant-making agency in the federal government. The Department protects and promotes the health and well-being of all Americans and provides world leadership in biomedical and public health sciences. Eight strategic goals guide HHS in accomplishing its mission of protecting and improving the health and well-being of the American public. These goals provide a focus for HHS investments and serve as a framework for the measures that track our performance. Sound information is essential to HHS's mission of enhancing the health and well-being of Americans. For every HHS performance measure, whether providing for effective health and human services or fostering sustained advances in the sciences or public health, reliable and readily available information is necessary for planning, decision making, and measuring results. The Department plays an essential role in producing data for decision-making for health and human services programs, both as a direct producer and as a partner in data collection with the states, grantees, and other governmental agencies. HHS's programs and its agencies rely upon data for program management, policy decision-making, and intervention development. The Government Performance and Results Act of 1993 (GPRA) emphasizes the importance of data for decision making and creates an incentive for staff throughout HHS to accurately reflect and refine our data systems. As a result, our programs work extensively with partners (state, local and tribal governments, grantees, and Medicare contractors) in program implementation and data collection. To do this, we continuously identify enhancements to our systems that improve the timeliness, completeness, and accuracy of data and enable us to move to more sophisticated performance measures. We face several challenges in this area:
Throughout HHS, we are making data available to our program offices and partners for planning, decision-making, and measuring results. These efforts include developing new data collection systems, enhancing current data collection systems, eliminating systems that are no longer relevant, combining reporting where possible, and building capacity to collect data at the state and local levels. The Department manages over 300 programs, and the ones included in this report highlight the many ways that HHS is leading Americans to better health, safety, and well-being. To accomplish that, we selected programs that represent each of our eight strategic goals, and also represent the agencies that make up the Department. For more detailed information, see the Department's Annual Performance Report located at www.hhs.gov/budget/docgpra.htm. NOTE: The data in this report reflects information as of June 30, 2003. In some cases more recent information may be available in agency documents that were updated following that compilation. Strategic Goal 1:
|
||||||||||||||||||||||||||||||||||||||||||||||||||||||||||||||||||||||||||||||||||||||||||||||||||||||||||||||||||||||||||||||||||||||||||||||||||||||||||||||||||||||||||||||||||||||||||||||||||||||||||||||||||||||||||||||||||||||||||||||||||||||||||||||||||||||||||||||||||||||||||||||||||||||||||||||||||||||||||||||||||||||||||||||||||||||||
Performance Measure: Achieve or sustain immunization coverage of at least 90% in children 19- to 35-months of age for 3 doses Diphtheria Tetanus Acellular Pertussis (DtaP) vaccine, 3 doses Hib vaccine, 1 dose Measles, Mumps, and Rubella (MMR)vaccine*, 3 doses hepatitis B vaccine, 3 doses polio vaccine, 1 dose varicella vaccine, and 4 doses pneumococcal conjugate vaccine**. |
||
|
Target |
Actual |
|---|---|---|
FY 2003 |
90% coverage |
Available 08/2004 |
FY 2002 |
90% coverage |
-DTaP 95% |
FY 2001 |
90% coverage |
-DTaP 94% |
FY 2000 |
90% coverage |
-DTaP 94% |
Source: National Immunization Survey (NIS)
*Includes any measles-containing vaccine.
**As this is a newly recommended vaccine, accountability for performance targets will begin in 2006.
CDC has modified this measure from four doses of Diphtheria-Tetanus-acellular Pertussis (DTaP) vaccine to three because vaccine shortages have limited the availability of the fourth dose to children. ACIP recommends that if the vaccine is in short supply, or not available, the fourth dose of DTaP may be dropped. The first three doses are considered the most critical to prevent disease. Data for CY 2003 will be available in August 2004. In 2002, OMB selected the 317 Immunization Grant Program to complete the FY 2004 Program Assessment Rating Tool (PART) process. The 317 Grant Program assists state and local health departments in reducing vaccine-preventable diseases by increasing immunization rates among children.
Domestic HIV/AIDS Prevention Program
Centers for Disease Control and Prevention (CDC)
The Program
During the early 1990s, before perinatal (mother-to-child) preventive treatments were available, an estimated 1,000 to 2,000 infants were born with HIV infection each year in the U.S. Today, a dramatic reduction in perinatal HIV transmission cases has been noted in the U.S., a result of the widespread implementation of Public Health Service (PHS) recommendations made in 1994 and 1995 that included routinely counseling and voluntarily testing pregnant women for HIV, and offering zidovudine (AZT) to infected women during pregnancy and delivery, and to their infants post-partum.
CDC monitors perinatal AIDS cases in the U.S., develops recommendations for perinatal prevention, and also supports perinatal HIV prevention programs with state and local health departments, which also address perinatal prevention, in 16 jurisdictions.
Further decreasing perinatal HIV transmission is one of four strategies included in CDC's New Initiative, "Advancing HIV Prevention: New Strategies for a Changing Epidemic," announced in April 2003. To support this key strategy, CDC issued recommendations that clinicians routinely screen all pregnant women for HIV infection, using an "opt-out" approach, and that jurisdictions with statutory barriers to such routine prenatal screening consider revising them. CDC is working with partners to:
Results and Explanation of Performance:
Performance Measure: Decrease the number of perinatally transmitted AIDS cases from the 1998 baseline of 235 cases. |
||
|
Target |
Actual |
|---|---|---|
FY 2003 |
<139 cases |
Available 08/2004 |
FY 2002 |
141 cases |
Available 12/2003 |
FY 2001 |
151 cases |
101 cases |
FY 2000 |
203 cases |
120 cases |
Source: CDC HIV/AIDS Case Surveillance
CDC has consistently exceeded its target for this measure since 1999. Surveillance data reported through June 2001 show sharply declining trends in perinatal AIDS cases. This decline was strongly associated with widespread zidovudine use in pregnant women who were aware of their HIV status. Recently, improved treatment has also likely delayed the onset of AIDS for HIV-infected children. With efforts to maximally reduce perinatal HIV transmission and increase treatment for those infected, declines are likely to continue. Treatment failures and missed opportunities to prevent transmission, however, may slow these declines.
Perinatal AIDS data are derived from CDC's HIV/AIDS Case Surveillance. AIDS case data are available from all states and territories using uniform name-based collection methods (no names or personal identifiers are sent to CDC; these are maintained only at the local level). Although completeness of reporting of diagnosed AIDS cases varies by area and patient population, studies indicate that reporting in most areas is more than 85 percent complete. In order to provide the best estimates of trends in incidence, HIV and AIDS surveillance data are analyzed by the date of diagnosis and are mathematically adjusted in more recent periods to adjust for reporting delays (the period of time between a diagnosis of AIDS and the arrival of a case report at CDC) and incomplete information on some cases. CDC requires a minimum of 18 months after the end of a calendar year to provide accurate estimates of trends up through that year.
In 2002, the domestic HIV/AIDS program, including perinatal HIV/AIDS prevention activities, was PARTassessed by OMB. OMB recommends improvements in the areas of performance measurement and management and oversight of grantees. In response to these recommendations, the CDC has revised prevention goals, added new annual performance measures, and strengthened oversight procedures and reporting. In 2003, during the second annual PART review, OMB has acknowledged program progress for these areas.
Substance Abuse Prevention and Treatment Block Grant Program
Substance Abuse and Mental Health Services Administration (SAMHSA)
The Program
SAMHSA's Substance Abuse Prevention and Treatment Block Grant, the cornerstone of the states'
substance abuse programs, is an integral part of the President's Drug Treatment Initiative. The block grant's goal is to improve the health of the Nation by bringing effective alcohol and drug treatment and prevention services to every community through a block grant to the states.
Results and Explanation of Performance
Performance Measure: Number of substance abuse prevention and treatment clients served. |
||
|
Target |
Actual |
|---|---|---|
FY 2003 |
1,884,654 |
Available 09/2005 |
FY 2002 |
1,751,537 |
Available 09/2004 |
FY 2001 |
1,635,422 |
Available 09/2003 |
FY 2000 |
1,525,688 |
1,599,703 |
Source: Drug and Alcohol Services Information System (DASIS) � Treatment Episode
Data Set (TEDS) is used as a proxy for this measure
The FY 2000 target for increasing the number of clients served was met. Data collected by the Treatment Episode Data Set (TEDS) information system indicated that SAMHSA served almost five percent more clients than expected during FY 2000. SAMHSA is currently assessing performance for FY 2001 and plans to increase the number of clients served by over seven percent each year.
The proxy data being reported represents treatment admissions data. Although this data is limited, it represents the best estimate available. The estimated number of clients served shows progress in increasing service delivery in support of the President's Drug Treatment Initiative.
Three major external factors could have a significant impact on performance:
The improvement or deterioration in these external factors would likely impinge on performance results.
HHS has developed a number of initiatives and programs and has devoted numerous resources, including an increase in bioterrorism spending by more than thirteen-fold between FY 2001 and FY 2003, to protect Americans from bioterrorist attacks and other public health care challenges. The events of September 11, 2001, and subsequent anthrax attacks have reinforced HHS's role in protecting Americans from attacks on our food and health by enhancing emergency preparedness.
The following programs illustrate HHS's broad commitment to strengthening the public health infrastructure. CDC has an integral role in strengthening the local public health infrastructure to effectively respond to emergencies. The Health Resources and Services Administration (HRSA) is also enhancing hospital preparedness.
Terrorism Preparedness and Emergency Response Program
Centers for Disease Control and Prevention (CDC)
The Program
Since 1946, CDC has been responding to public health threats and emergencies. In the aftermath of the events of September 11, 2001, we have learned that the U.S. public health system is a critical element in the new war against terrorism. However, preparing the Nation to address the dangers of terrorism is a major challenge to public health and healthcare systems. CDC is leading national efforts to rapidly improve the capacity of public health to prepare for and respond to acts of terrorism, including chemical, biological, radiological, nuclear (CBRN) and mass trauma events.
To minimize illnesses and deaths associated with such an event, CDC works with partners at the federal, state, and local levels to assess our nation's capacity and ensure a timely and sufficient response to terrorist attacks and emergency events. CDC also works with the Office of Domestic Preparedness (ODP) in the Department of Homeland Security (DHS) to assess public health capacity for preparedness and emergency response and to develop, deploy, and coordinate these efforts. Within the Department, CDC collaborates with HRSA to ensure integration with the Hospital Preparedness Program and with NIH on the development of countermeasures. Health departments are now defining their roles to respond effectively to an intentional release of a terrorist agent into an unsuspecting population.
The threat of a terrorist attack demands utilization of CDC's tools and expertise: surveillance; epidemiology; laboratory capacity; and coordinated control measures. CDC has demonstrated this capability during the past year in responding to the outbreaks of West Nile virus and Severe Acute Respiratory Syndrome (SARS). The tools and expertise CDC applies to aid public health in the investigation and control of infectious disease outbreaks will also be most valuable in the event of a CBRN attack or mass trauma event. This will ensure implementation of the rapid response necessary to minimize the impact of bioterrorism agents, such as smallpox or plague. CDC's expanding role will improve the health and security of our Nation.
Results and Explanation of Performance:
Performance Measure: Enhance preparedness by assuring state, territorial, and local jurisdiction projects have written plans to respond to biological, chemical, radiological, and mass trauma hazards related to terrorism, addressing all seven focus areas of the CDC cooperative agreement. |
||
|
Target |
Actual |
|---|---|---|
FY 2003 |
50% of the 62 state, territorial and local jurisdictions will have written plans |
Available 12/2003 |
FY 2002 |
N/A |
N/A |
FY 2001 |
N/A |
N/A |
FY 2000 |
N/A |
N/A |
Source: Semi-annual progress reports
CDC received emergency supplemental funding in February 2002 to begin the process of improving state and local capacity to respond to CBRN attacks. Intramural and extramural activities to build preparedness and readiness assessment, surveillance and epidemiology capacity, laboratory capacity, communications and information technology, health information dissemination, and education and training are in place. These activities will focus on three priorities:
In FY 2004, CDC will establish a system to track progress against newly established outcome goals.
National Bioterrorism Hospital Preparedness Program
Health Resources and Services Administration (HRSA)
The Program
The purpose of the National Bioterrorism Hospital Preparedness Program is to prepare hospitals and supporting health care systems to deliver coordinated and effective care to victims of terrorism and other public health emergencies. This is one part of the larger HHS program for state and local terrorism preparedness, working in concert with CDC's Public Health Preparedness and Response for Bioterrorism Program.
As of September 11, 2001, the U.S. healthcare system lacked sufficiently adequate plans and infrastructure to respond to challenges that terrorist acts and other mass casualties may pose. A GAO (Report 03-373) investigation found widespread deficiencies in capacity, communication, and coordination elements essential to preparedness and response.
The National Bioterrorism Hospital Preparedness Program begins to address this problem by providing funding to states and other entities to upgrade the capacity of hospitals, outpatient facilities, emergency medical services systems, and poison control centers to respond to terrorist and other public health emergencies on a regional basis. This new program received initial funding in FY 2002.
Results and Explanation of Performance
Performance Measure: Increase the percent of awardees that have developed plans to address surge capacity. |
||
|
Target |
Actual |
|---|---|---|
FY 2003 |
N/A |
59% (baseline estimate) |
Source: 2005 GPRA Plan, from states' progress reports
Surge capacity is the ability to accommodate a large and rapid increase in the number of persons requiring services. It includes addressing issues of hospital bed capacity, isolation capacity, health care personnel, pharmaceutical caches, personal protection and decontamination, mental health capacity, trauma and burn care capacity, and communications and information technology. Based on awardees' progress reports, HRSA estimates that a baseline of 59 percent of awardees (states, territories, and municipalities) have developed plans to address regional surge capacity. The goal is for at least 90 percent of the Nation's hospital regions to have developed plans for responding to a surge capacity of 500 patients per million people by FY 2004. Starting in FY 2004, HRSA will be tracking progress against newly established outcome goals.
Bioterrorism is not the only threat facing our Nation. Disparities in health care within the U.S. population are of great concern to HHS. Working to expand health care to all, HHS has sought to create new, affordable health insurance options and expand the health care safety net.
We also aimed to strengthen and improve Medicare as well as increase the number of children enrolled in regular Medicaid or State Children's Health Insurance Program (SCHIP). In addition, the Health Centers Program in HRSA expanded access to preventive and primary care for racial/ethnic minority individuals.
Medicare Program
Centers for Medicare & Medicaid Services (CMS)
The Program
CMS administers Medicare, the Nation's largest health insurance program, which covers approximately 41 million Americans. Medicare provides health insurance to people age 65 and over, those who have permanent kidney failure, and certain people with disabilities. For nearly four decades, this program has helped pay medical bills for millions of Americans, providing them with reliable, comprehensive health benefits.
CMS's primary mission is to assure health care security for its beneficiaries. CMS also strives to encourage choice in the Medicare beneficiary community for medical coverage while maintaining high quality care.
Results and Explanation of Performance
Performance Measure: Improve satisfaction of Medicare beneficiaries with the health care they receive (Managed Care). |
||
|
Target |
Actual |
|---|---|---|
FY 2003 |
Collect and share data toward CY 2004 targets of 93% for access to care and 86% for access to specialist |
Data continues to be collected and disseminated |
FY 2002 |
Collect and share data toward CY 2004 targets of 93% for access to care and 86% for access to specialist |
Data collected |
FY 2001 |
Develop new baselines/targets to include disenrollee data |
Baselines and targets developed: |
FY 2000 |
Collect and share data to achieve 79% of plans for access to care and 75% of plans for access to specialist by CY 2003 |
Data collected; Goal met |
FY 1999 |
Develop target |
Target developed |
Source: Medicare Consumer Assessment Health Plans Surveys (CAHPS)
Performance Measure: Improve satisfaction of Medicare beneficiaries with the health care they receive (Fee-for-Service). |
||
|
Target |
Actual |
|---|---|---|
FY 2003 |
Collect and share data |
Data continues to be collected and disseminated |
FY 2002 |
Collect and share data toward CY 2004 targets of 95% for access to care and 85% for access to specialist |
Data collected; Goal met |
FY 2001 |
Develop baselines |
Baselines developed: |
FY 2000 |
Same as FY 1999 |
Survey fielded in FY 2001 w/baseline data available in Fall 2001 |
FY 1999 |
Develop measurement and reporting methodology |
Development continuing with survey to be fielded in FY 2001 |
Source: Medicare CAHPS
Beneficiaries are Medicare's primary customers. One of CMS's primary goals is to assure satisfaction in the experiences beneficiaries have in accessing care, including the care of specialists. To measure and monitor beneficiaries' experiences and satisfaction with the care they receive through Medicare, CMS developed a series of data collection activities using the Consumer Assessment Health Plans Surveys (CAHPS). CMS fields these surveys annually to representative samples of beneficiaries enrolled in each Medicare managed care plan as well as those enrolled in the original Medicare fee-for-service (FFS) plan, and provides comparable sets of specific performance measures collected in CAHPS to Quality Improvement Organizations (QIOs), health plans, and beneficiaries through various means, including the National Medicare & You Education Program (NMEP).
CMS's multi-year efforts to improve beneficiary satisfaction apply to both managed care and FFS plans. To capture more complete information for the managed care portion, we combine data from a managed care disenrollee survey with survey data from current managed care enrollees. Baselines and targets were recalculated in CY 2000 (FY 2001) to reflect this change. In order for the increase to be statistically significant, these are long-term targets with reports due at the end of the 5-year period.
CMS is meeting our FY 2003 target of improving beneficiary satisfaction by continuing to collect and share CAHPS information from beneficiaries with health plans, QIOs, and beneficiaries.
Medicaid and the State Children's Health Insurance Program (SCHIP)
Centers for Medicare & Medicaid Services (CMS)
The Program
Medicaid, a jointly financed program by the federal and state governments, is a means-tested health care program for low-income Americans, which CMS administers in partnership with the states. Over the years, Congress has incrementally expanded Medicaid well beyond the traditional population of the low-income children, families, elderly, and the blind. Today, Medicaid is the primary source of health care for a much larger population of medically vulnerable Americans, including poor families, the disabled, and persons with developmental disabilities requiring long-term care. In coordination with the Medicaid Program, the State Children's Health Insurance Program (SCHIP) has also stimulated enormous change in the availability of health care coverage for children.
SCHIP was created through the Balanced Budget Act of 1997 (BBA) to address the fact that nearly 11 million American children (one in seven) were uninsured and therefore at increased risk for preventable health problems. Many of these children were in working families that earned too little to afford private insurance on their own, but too much to be eligible for Medicaid. BBA provided funds cover the cost of insurance, reasonable costs for administration, and outreach services to get children enrolled. To make sure that funds are used to cover as many children as possible, funds must be used to cover previously uninsured children, and not to replace existing public or private coverage.
Results and Explanation of Performance
Performance Measure: Increase the number of children enrolled in regular Medicaid or SCHIP. |
||
|
Target |
Actual |
|---|---|---|
FY 2003 |
+ 5% over 2002 |
Expected 01/2004 |
FY 2002 |
Additional 1,000,000 over 2001 |
Additional 2,750,000 over 2001 (Goal met) |
FY 2001 |
Additional 1,000,000 over 2000 |
Additional 3,441,000 over 2000 (Goal met) |
FY 2000 |
Additional 1,000,000 over 1999 |
Additional 1,679,000 over 1999 (Goal met) |
FY 1999 |
Develop goal; set baseline and targets |
21,980,000 Baselines (Goal met) |
Source: Statistical Enrollment Data System and HCFA-2082
The SCHIP and Medicaid programs have made unprecedented investments to improve the quality of life for millions of vulnerable, uninsured, and low-income children. Through Title XXI of the Social Security Act, states have the option to expand their Medicaid program, establish a separate child health program, or use a combination of both. CMS's goal is to increase the number of children who are enrolled in regular Medicaid or SCHIP. During FY 2002, approximately 30 million children were enrolled in SCHIP and Medicaid, which is about 2,750,000 over the previous year's level.
In FY 2003, states are continuing to eliminate barriers that may prevent families from enrolling in Medicaid or SCHIP. For example, many states are simplifying application forms and income verification requirements. A number of states have also expanded eligibility to provide coverage to other populations (e.g., parents, families with incomes higher than the federal poverty level, etc.) as a way to increase enrollment in Medicaid and SCHIP. The states submit data through the Statistical Enrollment Data System (SEDS), which CMS personnel review every quarter.
When CMS first implemented this GPRA goal, the objective was to enroll five million children in the program by FY 2005. To meet this number, CMS set as its target an increase of enrollment of one million children over the previous year. Because CMS has exceeded this goal and is now seeing states face fiscal challenges that may affect the program's outreach and enrollment, CMS is unsure about future projections and has decided to set its FY 2003 target to increase enrollment by five percent over the previous year. We expect FY 2003 data in early CY 2004.
Health Centers Program
Health Resources and Services Administration (HRSA)
The Program
The Health Centers Program, a major component of America's health care safety net for the Nation's indigent populations, is leading a Presidential initiative to increase health care access for those Americans who are most in need. Millions of Americans are uninsured and lack access to a regular source of health care. Health Centers, operating at the community level through federal, state, and community partnerships, provide regular access to high quality, family-oriented, and comprehensive primary and preventive health care regardless of patients' ability to pay. Program grants support a variety of community-based public and private nonprofit organizations for the operation of this program. The ultimate goal of the Health Centers Program is to improve the health status of underserved and vulnerable populations and to eliminate health
disparities.
To make sure the Health Centers Program is reaching needy populations, the program targets and tracks service to racial/ethnic minority groups, people of low income, and those who are uninsured.
Results and Explanation of Performance
Performance Measure: Continue to assure access to preventive and primary care for racial/ethnic/minority individuals. |
||
|
Target |
Actual |
|---|---|---|
FY 2003 |
65% - 8.29 million |
Available 08/2004 |
FY 2002 |
65% - 7.64 million |
64% - 7.24 million (est.)1 |
FY 2001 |
65% - 6.83 million |
64% - 6.62 million |
FY 2000 |
65% - 6.24 million |
64% - 6.18 million |
Source: HRSA BPHC Uniform Data System
1Data as of October 2003
The number of racial/ethnic minority individuals served by the Health Centers Program increased from 6.62 million in FY 2001 to an estimated 7.24 million in FY 2002, continuing a steady growth consistent with the overall growth in program clients. The proportion of racial/ethnic minority individuals has remained at 64 percent of total clients, just one percentage point below the target. The Presidential Growth Initiative for the Health Centers Program includes service capacity expansions for existing centers and the development of new service sites. Some of these new sites are or will be in underserved geographic areas (e.g., rural and frontier areas) that do not have large proportions of racial/ethnic minorities. The location of new sites and the overall substantial and rapid increases in total number of clients served impact the program's ability to maintain and increase the proportion of total clients who are minority individuals. Data for this performance measure are from the HRSA Bureau of Primary Health Care (BPHC) Uniform Data System (UDS), which we regularly validate through hundreds of automated edit checks and on-site performance reviews.
OMB conducted a PART review of the Health Centers Program during the FY 2004 budget cycle. The program was rated "Effective," earning a score of 85, one of the highest among all assessed Government programs.
National Diabetes Program and Clinical Services
Indian Health Service (IHS)
The Program
The mission of the IHS Diabetes Program is to develop, document, and sustain a public health effort to prevent and control diabetes in American Indian/Alaska Native (AI/AN) people. The program works with communities to prevent and treat diabetes, and also oversees the Special Program for Diabetes in Indians.
Results and Explanation of Performance
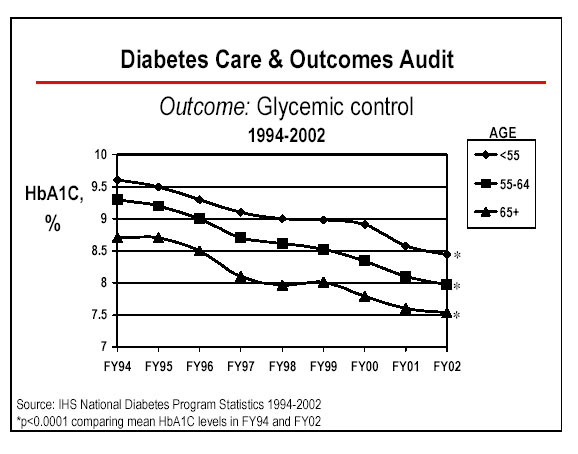
Performance Measure: Increase the proportion of Indian/Tribal/Urban Native American patients with diagnosed diabetes that have demonstrated improved glycemic control (blood sugar levels). |
||
|
Target |
Actual |
|---|---|---|
FY 2003 |
Maintain |
Available 11/2003 |
FY 2002 |
Improve |
30% |
FY 2001 |
Improve |
29%* |
FY 2000 |
Improve |
26% |
FY 1999 |
25% |
24% |
Source: Annual IHS National Diabetes Audit
*Previously reported as 30 percent based on preliminary data
IHS met the FY 2002 performance target by improving the FY 2001 performance level for ideal glycemic control in patients with diagnosed diabetes. FY 2003 data are currently not available; we anticipate data availability in November 2003. The displayed data is based upon our diabetic audit, which is a reliable and consistent data source that has been externally validated through chart reviews.
IHS was able to meet this indicator, despite an increasing number of AI/AN patients with diabetes (up 35% since FY 1994), an increasing number of sites participating in the annual diabetic audit, and stricter guidelines concerning ideal blood sugar control. Glycemic control refers to how well the blood sugars are controlled in a person with diabetes. Diabetic blood sugar control is defined with a blood test called hemoglobin A1C. The IHS Diabetes Care and Outcome Audit process defined ideal blood sugar control as less than 7% on this test for FY 2002 (the previous definition of 'ideal' was 7.5%). Our ability to improve the percentage of patients with ideal glycemic control in FY 2002, in the face of increasing numbers of diabetics and tightening definitions for what constitutes �ideal' control, reflects our multi-factorial approach to glycemic control.
In addition, IHS has demonstrated significant improvements in blood glucose control over time, greater than a one percent drop for each age group, as measured by A1C. Large clinical trials have shown that a one percent drop in A1C in people with diabetes should result in:
The graph on page II.15 illustrates our ongoing ability to improve glycemic control in our populations, as well as improve the percentage of patients in ideal control.
Appropriated diabetes funding enhancements may continue to improve the performance of this indicator through the use of grants and cooperative agreements for special projects aimed at targeted diabetesrelated treatment and prevention areas. Area diabetes consultants encourage lifestyle intervention and appropriate medication use through orientation, training, and monitoring at the local level. Efforts to achieve this measure also include the negotiation of wholesale or �at cost' purchases of newer, more effective (but considerably more expensive) medications for AI/AN diabetic patients. In addition, IHS has developed and deployed a clinical software application that allows sites to track and provide timely feedback on this, and other, diabetic indicators.
HHS is committed to strengthening the Nation's capacity to generate scientific discoveries that lead to improvements in health. NIH, the world's largest and most distinguished health research organization, is dedicated to advancing the understanding of biomedical and behavioral science. Central to that aim is ensuring the supply of well-trained laboratory and clinical investigators, who will generate the discoveries of the future.
Research Training and Career Development Program
National Institutes of Health (NIH)
The Program
To nurture a talent base of well-qualified and diverse investigators, NIH provides pre- and post- doctoral training support through the National Research Service Award (NRSA) and various other mechanisms of support for career development.
Pre-doctoral training. At the pre-doctoral level, students who are beginning graduate training need to learn the conceptual and theoretical aspects of their respective disciplines. NIH provides support through grants to institutions so that they, in turn, can provide broad, multidisciplinary training programs for a critical mass of students. In the first pre-doctoral years, didactic educational experiences for learning the fundamentals are supplemented with laboratory rotations that help students identify the frontiers of modern science and learn research methods. Later, once students select their dissertation projects, they operate primarily as research assistants on their mentors' research grants. Praise for NIH's approach has been extensive, including the widely cited report, Reshaping Graduate Education (National Academy of Sciences, 1995), which recommended that all federal agencies emulate this approach.
Post-doctoral training. At the post-doctoral level, NIH supports an extension and expansion of the apprenticeship approach. For individuals who continue their formal education in the biological or behavioral sciences, NIH offers training grants, fellowships, and research assistantships to fund this period of intense research activity. The primary focus at this level is the acquisition of knowledge and skills necessary to launch an independent research career.
Career development. Whether a trained investigator (post-doctorate) is just commencing an independent research career or is well-established but looking to expand into a new area, Career Development Awards provide them with support for acquiring specialized new skills.
Initiatives to Augment the Supply of Clinical Investigators. The expansion and support of the clinical research workforce is critical to translate basic research into treatments, and to guide and stimulate basic research on key barriers to effective treatment. Prior to the launch of a Clinical Research Initiative in 1999, NIH primarily stimulated the supply of clinical investigators by providing incentives for medical students to gain research skills and earn a combined MD/PhD degree. Then, two prestigious groups, the NIH Director's Panel on Clinical Research and the Institute of Medicine Committee on Addressing Career Paths for Clinical Research, recommended that NIH expand and improve its training activities in patient-oriented research for both entry-level and mid-career clinical investigators. Accordingly, NIH complemented the MD/PhD approach to stimulating the supply of clinical investigators with an approach based on career development. (See the Executive Summary of the Panel's recommendations for more information, www.nih.gov/news/crp/97report/execsum.htm)
In 1999, under the NIH Director's Initiative on Clinical Research, NIH established three new career development mechanisms to encourage careers in patient-oriented research.
NIH initially aimed to award at least 80 new K23's and 80 new K24's per year from FY 1999 through FY 2003 to achieve a steady state of approximately 400 awards of each type and set a target of 20 for curriculum development (K30) awards. We based these targets on experience with previous Career Development Awards, consultation with the community, and estimates of the national needs for health research personnel, as reported in the quadrennial study, conducted by the National Academy of Sciences. We adjusted targets in later years based on experience with the awards.
Results and Explanation of Performance
Performance Measure: Increase the pool of clinician researchers trained to conduct patient-oriented research.1,2 |
||
|
Target |
Actual |
|---|---|---|
FY 2003 |
Issue at least 120 awards in the K23 category. |
02/2004 |
Issue at least 50 awards in the K24 category. |
02/2004 |
|
FY 2002 |
Issue at least 120 awards in the K23 category. |
194 |
Maintain a steady state level of awards in the K24 category. |
48 |
|
FY 2001 |
Issue at least 80 awards in the K23 category. |
185 |
Issue at least 80 awards in the K24 category. |
58 |
|
FY 2000 |
Issue at least 80 awards in the K23 category. |
193 |
Issue at least 80 awards in the K24 category. |
77 |
|
FY 1999 |
Issue at least 20 awards in the K30 category. |
35 |
Issue at least 80 awards in the K23 category. |
85 |
|
Issue at least 80 awards in the K24 category. |
81 |
|
Re-announce the career award components of the Director’s Initiative on Clinical Research |
PA-00-004 & PA-00-005, |
|
Source: IMPAC database
1This is only one of several measures used to gauge the performance of the NIH Research Training and Career Development Program
2Data as of October 2003
After four years of experience with the career development component of the Initiative on Clinical Research, NIH can say that the activities are a qualified success. The primary outcome of these activities will not be evident for several years because, as of FY 2003, the supported career development periods for K23 and K24 awardees are just now concluding, and the grantees have yet to take the steps for which they have been preparing. Thus, NIH can only assess progress toward the goal of increasing the pool of clinician researchers through process and outcome measures (e.g., the number of awards issued). From this perspective, the career award components of the Initiative on Clinical Research have had variable success.
The data used for reporting are complete and reliable. NIH measured performance by the number of annual K23, K24, and K30 awards as documented in reports generated from the Information for Management, Planning, Analysis, and Coordination (IMPAC) database system. IMPAC is a comprehensive database system for NIH's extramural research activities. We regularly verify the validity of IMPAC award data, and reconcile it with the Office of Financial Management's Central Accounting System on a daily basis. We also annually verify data on individuals with internal and external datasets such as the Trainee and Fellow File, the Consolidated Grant Applicant File, and the Doctorate Record File. Finally, NIH has a data quality contract that examines the database for duplicate records and other problems in order to improve the quality of the data.
In an effort to further demonstrate NIH's contribution to the nation's health science research enterprise, the FY 2004 Performance and Accountability Report will highlight progress towards creation of the nextgeneration map of the human genome, the haplotype map. The "HapMap" will be a description of the patterns of human genetic variation and will help researchers learn more about how genes affect health and disease.
This goal aims to improve the quality of health care services by reducing medical errors, improving consumer and patient protection, and accelerating the development and use of electronic health information. The program discussed in this section illustrates HHS's commitment to health care research; upholding health, safety and quality standards in institutions that serve Medicare and Medicaid beneficiaries; and modernizing electronic health information to ensure patient safety and improve health care quality.
Medical Devices and Radiological Health Program
Food and Drug Administration (FDA)
The Program
The FDA Medical Devices and Radiological Health Program is responsible for ensuring the safety and effectiveness of medical devices and eliminating unnecessary human exposure to manmade radiation from medical, occupational, and consumer products. A key element of the program is the post-market reporting system that keeps the FDA informed of serious adverse events. The information collected by the system serves as the basis for corrective actions by the Agency, including warnings to users and product recalls.
The Medical Product Surveillance Network (MedSun) pilot program, launched in 1999 by the Center for Devices and Radiological Health (CDRH), is intended to play an important role in FDA's post-market surveillance efforts. MedSun is FDA's response to the FDAMA provision directing replacement of universal user facility reporting with a user facilities network that constitutes a representative profile of user reports. The goal of the MedSun is to improve the protection of the health and safety of patients, users, and others by reducing the likelihood of the occurrence of medical device related adverse events and, if they do occur, reducing the likelihood that they will be repeated. MedSun is based on the premise that a select group of highly trained reporting facilities can provide high quality, informative reports that are representative of user facility device problems nationwide.
An important by-product of MedSun is the creation of a two-way channel of communication between FDA and the user facility community. This system provides a means for an advanced warning system for gathering or providing fast, effective feedback from and to that community (FDA retains a direct channel of contact to all user-facilities in the U.S. via Public Health Advisories and Safety Alerts). By having a network in place, FDA is using this system to quickly gain input from a representative sample of user facilities (i.e., hospitals, nursing homes, and other healthcare entities), and facilities are using it to seek information from other facilities and/or from FDA.
FDA's MedWatch program estimates that there may be as many as 300,000 injuries and deaths annually associated with device use and misuse. MedSun is designed to significantly reduce this number by identifying, understanding and sharing information about problems with the use of medical devices before serious injuries or deaths occur.
CDRH and its MedSun contractors will coordinate with FDA's Center for Drug Evaluation and Research to implement a drug surveillance network based on the MedSun model that is designed to train hospital personnel to accurately identify and report injuries and deaths associated with medical products. That effort is also described in FDA's Human Drugs Program's performance plan.
Results and Explanation of Performance
Performance Measure: Expand a facility network that constitutes a representative profile of medical device users to collect information that will be used to reduce errors associated with medical devices. |
||
|
Target |
Actual |
|---|---|---|
FY 2003 |
Build a MedSun hospital network of 180 facilities. |
Available 02/2004. |
FY 2002 |
Implement MedSun by recruiting a total of 80 facilities for the network. |
FDA recruited, trained, and had functioning more than 80 facilities for the network. |
FY 2001 |
Recruit a total of 75 hospitals to report adverse medical device events. |
FDA began feasibility testing with more than 25 hospitals and worked on software changes needed for website health data security. |
FY 2000 |
Develop MedSun based on approximately 25 user facilities. |
Developed MedSun Phase II Pilot based on approximately 25 user facilities. |
Source: FY 2004 Congressional Justification (CJ) FDA Performance Plan
In FY 2002, FDA recruited, trained, and had functioning more than 80 facilities for the network, and met its performance measure. In FY 2001, FDA did not meet its performance measure of recruiting 75 hospitals because most of its effort was focused on resolving internal policy issues and addressing information technology security requirements. Specifically, FDA extended software development to accommodate internet-based reporting systems (interactive web-based forms and databases), and took steps to ensure that reporters had internet access to secure servers. Despite not making the goal, FDA still recruited over 25 hospitals.
FDA's plans for FY 2003 focus on building MedSun to a network of 180 facilities, and with increased funding in FY 2004, expanding to 240 facilities. FDA will recruit new facilities to expand to the network capacity and to replace those that choose to leave. FDA plans to use these 240 facilities to pilot:
The Medical Products Surveillance Network is contributing to the Agency's initiative for reducing medical errors and to the overall Departmental initiative to improve the quality of health care services.
HHS continues to support efforts to increase the independence of low-income families, welfare recipients, the disabled, older Americans, Native Americans, and refugees. The HHS programs, detailed below, have annual performance measures that speak to improving the economic and social well-being of individuals, families, and communities.
Temporary Assistance for Needy Families
Administration for Children and Families (ACF)
The Program
ACF's Office of Family Assistance administers the Temporary Assistance for Needy Families (TANF)
program directed at (1) promoting work, responsibility, and self-sufficiency, and (2) improving the economic well-being of individuals and families through state- and tribal- administered programs. TANF's purposes are fourfold:
Results and Explanation of Performance
Performance Measure: All states meet the TANF all-family work participation rate standard. |
||
|
Target |
Actual |
|---|---|---|
FY 2003 |
100% |
Available 09/2004 |
FY 2002 |
100% |
100%1 |
FY 2001 |
100% |
100% |
FY 2000 |
100% |
100% |
FY 1999 |
100% |
100% |
Source: TANF Administrative Data
1Data as of September 2003
Congress established the TANF work participation performance targets for FY 1997 through FY 2002. The minimum state all-family work participation rate standard started at 25 percent in FY 1997 and gradually increased to 50 percent by FY 2002. In recognition of the rigor of the participation rate standards and the potential impact on states of their success in helping families find employment and exit the TANF program (remaining caseload would therefore contain an increasingly larger proportion of families with barriers to employment), Congress adjusted the standards by providing states credit for reduction in their TANF caseloads. The credit also reduces a state's minimum work participation rate requirement.
Beginning in FY 1997, the actual all-family participation rate increased significantly each year until FY 2000, when there was an 11 percent decline in the national average rate. Some of the decline in the all-family participation rate is attributed to the increase in the all-family minimum hours of weekly participation from 25 to 30 hours. From FY 1998 through FY 2002, all 50 states met the all-families target rates (this does not include territories).
In addition to the all-family participation rate, Congress established a rigorous two-parent participation rate of 75 percent in FY 1997. It was raised to 90 percent in FY 1999, and the proportion of states meeting the more rigorous two-parent work participation rate has steadily increased (from 66 percent to 85 percent). A few states continue to have difficulty meeting the two-parent rate. Pending reauthorization legislation would establish a single all-family participation rate starting at 50 percent but it would also require recipients to participate in more hours directly related to work. At least 50 percent of all cases receiving TANF that are headed by adults would be required to participate full-time in a simulated work-week of activities (up to 40 hours per week) and at least 24 of the total hours would have to be in a traditional work activity.
The statute directs the Secretary to collect aggregated data (caseload summaries) and disaggregated data (by individual and family) on the TANF program quarterly. ACF has developed an automated TANF data reporting system to collect this information. This system was established to collect data, including TANF work participation data, under the TANF final rule effective October 1, 1999. The consistency and validity of these state-reported data are assessed through system edits and consistency checks, special data computation runs, and data trend analysis. Within limited resources, ACF assesses the source data for the information supplied by the states.
Community-Based Services Program
Administration on Aging (AoA)
The Program
Title III of the Older Americans Act (OAA) establishes the Community-Based Services Program (CBSP) to make community-based services available to seniors who are at risk of losing their independence. Through the program, states and communities participate actively in (1) funding services and (2) developing the capacity to support the home and community-based service needs of elderly individuals, particularly the poor, the disabled, the frail, minorities, and those living in rural areas where service may be limited. The program provides several services:
Results and Explanation of Performance
Performance Measure: A significant percentage of OAA Title III recipients live in rural areas. |
||
|
Target |
Actual |
|---|---|---|
FY 2003 |
34% |
Available 02/2005 |
FY 2002 |
25% |
Available 02/2004 |
FY 2001 |
25% |
30.4% |
FY 2000 |
N.A |
32.9% |
Source: State Program Report (SPR)
OAA specifically requires the targeting of community-based services to vulnerable populations (i.e., lowincome, low-income minority, rural, disabled, and frail), and AoA tracks targeting performance for all of these groups of people. The representative targeting measure included in this report is for older people living in rural areas.
If AoA is to demonstrate effective targeting for the rural population, then data will show that the percentage of those individuals in rural areas receiving services is higher than the percentage of all elderly persons in rural areas. In fact, 2000 Census data indicate that 23 percent of the elderly population lives in rural areas, while AoA program data for both FY 2000 and FY 2001 show that over 30 percent of AoA services recipients live in rural areas. This demonstrates effective targeting as required by the OAA and in support of Administration initiatives to improve access to services for persons in rural areas. As a commitment to the continuous improvement of program performance, AoA also tracks performance in states performing below the national average targeting index. Six states have improved their performance by at least 10 percent between FY 2000 and FY 2001.
While AoA exceeded its performance target for FY 2001, and presumably for FY 2002, the performance target for FY 2003 is much more aggressive. We are challenging the entire aging network to improve performance as demonstrated by this "stretch" target. Since states report their data after the end of the fiscal year, the FY 2003 data should be available by September 2004. The reliability of the data is substantiated with numerous edit checks, and as the states have become familiar with the State Program Report (SPR), data quality has improved. We are confident that the CBSP will continue to serve older persons in rural areas at a level that exceeds their prevalence in the elderly population. AoA's targeting measures are a significant factor in the agency's priorities for the FY 2005. Although the network effectively targets services to vulnerable individuals, AoA will continue to support efforts to improve integration of home and community-based services to better serve vulnerable populations.
CBSP received a Program Assessment Rating Tool (PART) review during the FY 2004 budget cycle. The PART review determined that CBSP was deficient in long-term goals with aggressive performance targets and efficiency performance measures. CBSP has corrected these deficiencies and the program is currently under reassessment.
HHS is taking significant steps to improve the development and learning readiness of preschool children through the Head Start and Child Care programs. The Child Support Enforcement Program (CSE) is working to increase the financial support provided by non-custodial parents and to encourage their involvement in the lives of their children. Child welfare and youth programs are striving to assure that vulnerable children and youths are living in safe, permanent environments. HHS programs demonstrate, through their aggressive performance goals and annual program performance achievement, the Department's commitment to this strategic goal. Evidence of strong program performance in the examples cited below illustrates improvement in the stability and development of our Nation's children and youth.
Child Support Enforcement Program
Administration for Children and Families (ACF)
The Program
ACF's Office of Child Support Enforcement (OCSE) is responsible for ensuring support for children by locating parents, establishing paternity and support obligations, and enforcing those obligations. The Personal Responsibility and Work Opportunity Reconciliation Act of 1996 (PRWORA) provided ACF with new and effective tools for enforcing child support. ACF implements the child support provisions in PRWORA through a variety of means:
The CSE (Child Support Enforcement) program is federally funded and administered by state and local governments. The federal government pays 66 percent of state administrative costs and 90 percent of paternity laboratory costs. The federal government provides direction, guidance, technical assistance, oversight, and some critical services to states' CSE programs for activities mandated under title IV-D of the Social Security Act.
Results and Explanation of Performance
Performance Measure: Increase the collection rate for current child support. |
||
|
Target |
Actual |
|---|---|---|
FY 2003 |
58% |
Available 09/2004 |
FY 2002 |
55% |
58%1 |
FY 2001 |
54% |
57% |
FY 2000 |
71% |
56% |
FY 1999 |
70% |
53% |
Source: State Automated Systems provide data on OCSE Form 157
1Data as of September 2003
This measure, a proxy for the regular and timely payment of support, compares total dollars collected with total dollars owed to yield a collection rate for current support in IV-D (child support) cases. Comparing the $14.2 billion of current child support distributed in FY 2001 (approximately a ten percent increase from FY 2000) against the $24.7 billion current support due in FY 2001 yields a collection rate for current support of 57 percent. ACF increased the FY 2002 target based on actual performance in FY 2000. PRWORA enhances ACF's efforts by providing states with new hire reporting, uniform procedures for interstate cases, centralized collection and disbursement, and enhanced wage-withholding procedures.
ACF is implementing improved enforcement techniques that emphasize automated mechanisms for enforcement, collections, and payment mechanisms. These improvements include:
Most states use automated systems to maintain these data, while a few maintain the data manually. All states were required to have a comprehensive, statewide, automated CSE system in place by October 1, 1997. Fifty-two states and territories have indicated compliance with the single statewide child support enforcement automation requirements of the Family Support Act of 1988 (FSA). Fifty states and territories are FSA certified, and two states and territories have been reviewed but their certification review report has not been issued. Fifty states indicate compliance with PRWORA. Twenty-one states have been PRWORA certified as of May 6, 2003. Continuing implementation of these systems, in conjunction with cleanup of case data, will improve reporting accuracy and consistency.
ACF conducts data reliability audits annually. Self-evaluation by states and OCSE audits provide an ongoing review of data input validity and improves the automated systems' ability to produce accurate data. However, there is a substantial time lag in data availability. The Audit Division is in the process of completing all FY 2002 data reliability audits and will issue final state reports by September 2003. The reliability standard for FY 2000 actual data was 90 percent, but for FY 2001 ACF increased the standard to 95 percent to obtain greater confidence in the actual performance data.
Child Welfare Programs
Administration for Children and Families (ACF)
The Program
The purpose of ACF's Child Welfare Program is to prevent maltreatment of children in troubled families, protect children from abuse, and find permanent placements for those who cannot safely return to their homes. When a family cannot be reunified, foster care provides a stable environment until the child can be placed permanently with an adoptive family or in a guardianship arrangement.
Results and Explanation of Performance
Performance Measure: Increase the number of adoptions toward achieving the goal of finalizing 327,000 adoptions between FY 2003 � FY 2008. |
||
|
Target |
Actual |
|---|---|---|
FY 2003 |
58,500 |
Available 09/2004 |
FY 2002 |
56,000 |
51,0001 |
FY 2001 |
51,000 |
51,000 |
FY 2000 |
46,000 |
51,000 |
FY 1999 |
41,000 |
47,000 |
Source: Adoption and Foster Care Analysis and Reporting System (AFCARS)
1Data as of September 2003
When reunification with parents or relatives is not possible, the preferred permanency outcome for most children is adoption. The Adoption and Safe Families Act of 1997 (ASFA) and other federal legislation enacted during the last 25 years have promoted the adoption of children from the public child welfare system for whom reunification was not possible. The total annual number of adoptions of children with public child welfare system involvement has increased dramatically since FY 1995 (26,000). Through the revised Adoption Incentive Program, HHS will continue to reward states for increasing their total number of adoptions and will also provide an additional incentive for the adoption of older children, a growing segment of the population of children waiting to be adopted.
States can submit Adoption and Foster Care Analysis and Reporting System (AFCARS) adoption data on finalized adoptions at any time and still meet the requirements of the regulation. Frequently, states do not enter adoption data into their information systems for some time after the adoption because the entry does not occur until the states receive final paperwork from the court. For example, almost 2,400 adoptions finalized in FY 2000 were not reported until the first reporting period in FY 2001 (May 15, 2001). Because the Adoption Incentive Program requires that only adoptions reported by the first reporting period in the following fiscal year can be counted for incentive awards, almost all adoptions are now reported within that timeframe. The numbers reported for the Adoption Incentive Program are incomplete and are continually updated as additional adoptions are reported. After ACF receives the data (in this case by May 15 of the following year), ACF must download the data, convert it to analytical files, and clean it before including it in reporting documents, usually by September of the fiscal year following finalization.
After ACF conducts more than 800 edit-checks on each state's submission to improve AFCARS data quality, it sends the results to the states. ACF funds the National Resource Center for Information Technology in Child Welfare by providing technical assistance to states to improve AFCARS reporting and data utility. Finally, within the past year and half, ACF has implemented the AFCARS project, which includes a detailed review of all aspects of AFCARS by federal staff and participation of the field to identify possible system improvements.
HHS is committed to improving the efficiency and effectiveness of the Department's programs and achieving the goals of the President's Management Agenda by creating an organization that is citizen-centered, market-based, and results-oriented. We have worked to reduce erroneous payments; maintain clean opinions in HHS's audited financial statements; revitalize HHS's human capital management; and improve facilities to provide safe, modern, efficient, and physically secure laboratories and support facilities in the most economical manner possible. For more detailed coverage of the President's Management Agenda, see Section I of this Report.
The following programs have annual performance measures that demonstrate results in achieving excellence in management practices, and they illustrate how HHS has made progress towards this strategic goal.
Medicare Integrity Program
Centers for Medicare & Medicaid Services (CMS)
The Program1
CMS's program integrity efforts ensure the Medicare program pays the right amount to a legitimate provider for covered, reasonable, and necessary services that are provided to an eligible beneficiary. CMS funds its program integrity activities primarily through the Medicare Integrity Program (MIP), established by the Health Insurance Portability and Accountability Act of 1996. The MIP includes medical review and benefit integrity activities, provider education and training, Medicare Secondary Payer, and provider audits. CMS supplements its overall program integrity efforts through CMS's program management account funding and from other funds made available from the Health Care Fraud and Abuse Control Account.
One of CMS's key goals is to pay claims properly the first time. This means paying the right amount to legitimate providers for covered services provided to eligible beneficiaries. Paying claims right the first time saves resources required to recover improper payments and ensures the proper expenditure of valuable Medicare trust fund dollars.
Prior to FY 2003, the OIG estimated the amount of the improper payments for Medicare claims included in the CMS Financial Report. Beginning in FY 2003, this activity was assumed by CMS with the intention of expanding the number of claims sampled in order to obtain more detailed information to better identify and correct payment problems.
The 2003 CMS Financial Report includes estimates from the results of two programs used by CMS: the Comprehensive Error Rate Testing (CERT) program with a sample of 70,567 claims; and the Hospital Payment Monitoring Program (HPMP) with a sample of 57,775 discharges. The CERT program implements a new sampling and review methodology (for non-PPS inpatient hospital claims) that provides estimates of the national error rate with tighter precision. In addition, it employs independent reviewers to make determinations for 70,567 claims providing estimates of error rates by contractor, by service type, and by provider type.
These programs provide CMS with a much more rigorous set of data to manage our contractors, identify and prevent errors, and educate providers who bill our programs. As a result of the 2003 programs, CMS believes that the paid claims error rate remains at about the same rate as last year. The analysis determined an adjusted paid claims error rate of 5.8 percent, or $11.6 billion, compared to an unadjusted 9.8 percent rate ($19.6 billion). The unadjusted rate reflected an unusually high non-response rate because every non-response was treated as an error (54.7% of errors were due to non-responses). CMS believes the high non-response rate was due to the impact of HIPAA privacy rules, record requests made by an unfamiliar entity, and like the OIG in the first year they calculated the error rate, general difficulties in getting providers to follow-up on record requests. CMS adjusted the error rate using a conservative nonresponse estimate based on the OIG's average non-response rate of 12 percent for the past seven years.
For the first time CMS can use the Medicare error rate to show where it is overpaying or underpaying claims, and for what categories of service. Now that CMS has detailed error rates, it can aggressively target its efforts to fix problems they indicate.
CMS has taken a number of steps to minimize the non-response problem in the future. For example, CMS has revised the letters requesting medical records by clarifying the role of the error calculation contractor, explaining that it is not a HIPAA compliance violation to submit records to the error calculation contractor, and allowing providers to fax records. As a result, adjustments for non-response should not be necessary for FY 2004.
CMS is working with the contractors that pay Medicare claims and the QIOs on aggressive efforts to lower the paid claims error rate, including: (1) developing a tool that generates state-specific hospital billing reports to help QIOs analyze administrative claims data, (2) increasing and refining one-on-one educational contacts with providers found to be billing in error, and (3) developing projects with the QIOs addressing state-specific admissions necessity and coding concerns, as well as conducting surveillance and monitoring of inpatient payment error trends by error type.
In addition, CMS has directed the Medicare contractors to develop local efforts to lower the error rate by developing plans that address the cause of the errors, the steps they are taking to fix the problems, and other recommendations that will ultimately lower the error rate. The CERT program is an important new tool in monitoring contractor performance. It will provide CMS with the fundamental structure to hold the fee-for-service contractors accountable for the services they provide as CMS moves to performance-based contracting from simply paying contractors to process Medicare claims.
1Information received November 2003
Office of Inspector General
Office of Inspector General (OIG)
The Program
The primary function of the Office of Inspector General (OIG) is to detect and prevent fraud and abuse and to recommend policies designed to promote economy, efficiency, and effectiveness in the administration of HHS and its programs. It accomplishes its purpose by conducting and supervising audits, inspections, and investigations of HHS programs, and providing guidance to the healthcare industry. Over 80 percent of OIG resources are devoted to the Health Care Fraud and Abuse Control Program (HCFAC), a mandatory program which came into being with the passage of the Health Insurance Portability and Accountability Act of 1996 (HIPAA). It is a joint program of HHS and the Department of Justice (DOJ), and its purpose is to coordinate federal, state, and local law enforcement activities with respect to health care fraud and abuse, including the conducting of investigations, audits, evaluations, and inspections relating to the delivery of and payment for health care in the U.S. According to former Senator William Cohen, chief author and sponsor of the legislation, it "�simply provides adequate resources for prosecutors and investigators, longstrapped by budget cuts and understaffing, to go after serious patterns and cases of abuse." The remaining nearly 20 percent of OIG resources are allocated to audits, investigations, and inspections of HHS programs, including its public health and human services programs, and general departmental oversight.
Return on investment (ROI) has long been the primary measure of the effectiveness and efficiency of the OIG. The ratio is calculated by dividing the documented savings for the fiscal year by the OIG budget for that year. Fiscal year saving is calculated by summing expected recoveries from investigations that are successfully prosecuted by the DOJ, settlements that occur in lieu of criminal prosecution, monetary penalties, audit disallowances, and savings from funds not expended as a result of legislative and administrative actions stimulated by OIG audits and inspection reports.
Results and Explanation of Performance
Performance Measure: Target and actual returns per budget dollar invested in the OIG. |
||
|
Target |
Actual |
|---|---|---|
FY 2003 |
$100 |
Available 01/2004 |
FY 2002 |
$77 |
$121 |
FY 2001 |
$75 |
$110 |
FY 2000 |
$73 |
$104 |
FY 1999 |
$72 |
$99 |
FY 1998 |
N/A |
$99 |
FY 1997 |
N/A |
$71 |
Source: OIG OMB Budget Submission
The OIG has increased its expected recoveries and savings from funds not expended relative to its operating cost each year, except FY 1999, when the previous year's results were equaled. Over the entire FY 1997�2002 period, ROI improved by 70 percent (FY 2003 data to be available in January 2004). The targets set during the first four years of this period were conservative because of the uncertainty of the impact of changes to the Balanced Budget Act of 1997 then being considered by Congress. In each case, the targets were below the most recent actual returns of any year shown on the tables. The method of setting the target ROI was changed in the FY 2004 plan, and for the first time, the target exceeds previous actual results. The higher targets were arrived at by projecting a 10 percent improvement over the average of the most recent three years of actual expected recoveries and audit disallowances, along with adding $1 billion to the known savings from funds not expended as a result of legislative or administrative actions stimulated by OIG reports.
Last revised: January 16, 2004