Skip all navigation and jump to content Jump to site navigation Jump to section navigation.
NASA Logo - Goddard Space Flight Center + Visit NASA.gov
HOME PROJECTS RESOURCES SEARCH MAP

+ Advanced Search
Home
Home
View Most Recently Released Imagery
View Gallery of Imagery: A topical collection of SVS Imagery
Search Imagery by the keywords assigned to it
Search Imagery by the instruments that supplied data for a visualization product
Search Imagery by the series of visualizations that have been produced
Search Imagery by the scientist providing the data used in a visualization product
Search Imagery by the animator that created the product
Search Imagery by the identification number assigned to the visualization product
See other search options
Learn about the SVS Image Server
  + About the Server
  + Animation List
  + How to Use the Server


  + RSS Feeds
blank image
Previous Animation
Next Animation
Aqua Satellite and MODIS Swath

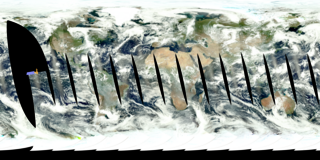
NASA's Aqua satellite was launched on May 4, 2002 with six Earth-observing instruments on board. Aqua circles the Earth every 99 minutes and is in a polar orbit, passing within ten degrees of each pole on every orbit. The orbit is sun-synchronous, meaning that the satellite always passes over a particular part of the Earth at about the same local time each day. Aqua always crosses the equator from south to north at about 1:30 PM local time. One of the instruments on Aqua, MODIS, measures 36 spectral frequencies of light reflected off the Earth in a 2300-kilometer wide swath along this orbit, so that MODIS measures almost the entire surface of the Earth every day. This animation shows the Aqua satellite orbiting for one day, August 27, 2005, showing a set of MODIS measurements taken that day that have been processed to look like a a true-color image of the Earth. Notice that MODIS only takes data during the dayside part of the orbit because it measures reflected light from the Sun, and that there is a bright band of reflected sunlight in the center of swaths over the ocean. Also visible in this animation are Hurricane Katrina, just to the west of Florida in the Gulf of Mexico, and Typhoon Talim, in the westerm Pacific between Japan and New Guinea.

This animation shows the Aqua satellite orbiting the Earth on August 27, 2005 by revealing MODIS true-color imagery for that day.  This animation is on a cartesian map projection, so the satellite will look accurate only when the animation is wrapped on a sphere.    This animation shows the Aqua satellite orbiting the Earth on August 27, 2005 by revealing MODIS true-color imagery for that day. This animation is on a cartesian map projection, so the satellite will look accurate only when the animation is wrapped on a sphere.
Duration: 1.9 minutes
Available formats:
  320x160     PNG           113 KB
  160x80       PNG           31 KB
  80x40         PNG           8 KB
  1024x512 (25 fps) MPEG-4   13 MB
  1024x512 (25 fps) Frames
  4096x2048 Frames (Swath)
  4096x2048 Frames (Satellite)
How to play our movies

This product is available through our Web Map Service.   Click here to learn more.
Animation Number:3348
Animator:Horace Mitchell (SVS) (Lead)
Completed:2006-04-04
Scientists:Norman Kuring (NASA/GSFC)
 Gene Feldman (NASA/GSFC)
Instrument:Aqua/MODIS
Data set:True Color
Data Collected:2005-08-27T00:45 - 2005-08-28T00:45
Series:WMS
Keywords:
GCMD >> EARTH SCIENCE >> Spectral/Engineering >> Platform Characteristics >> Orbital Characteristics
GCMD >> EARTH SCIENCE >> Spectral/Engineering >> Platform Characteristics >> Viewing Geometry
GCMD >> EARTH SCIENCE >> Spectral/Engineering >> Visible Wavelengths >> Visible Imagery
View Animation in Google Earth Google Earth KML file is available here.
DEPC Metadata is available here.
 
 
Please give credit for this item to
NASA/Goddard Space Flight Center Scientific Visualization Studio


Back to Top

USA.gov logo - the U.S. Government's official Web portal. + Privacy Policy and Important Notices
+ Reproduction Guidelines
NASA NASA Official:
SVS Contact:
Curator: