|
This tutorial serves as a basic introduction to viewing
protein structures in Protein
Data Bank (PDB), an international archive of structural data for biological
molecules.
In addition to summary
information for a particular molecular structure, PDB also provides different
viewing options. A structure can be viewed as a still image or as an interactive
file that requires proper browser configuration and the use of additional
software that can be downloaded for free.
Each structure in
PDB has a still image that can be saved or printed. To gain a better understanding
of the still image, it is helpful to explore a structure's features using
one of the interactive display options.
This tutorial will
demonstrate how to view a PDB structure using the interactive Protein
Explorer (PE), an interface designed for visual exploration of three-dimensional
molecular structure. Although it shares a command language and many other
features with its predecessor RasMol, it is easier to use and therefore
more appropriate for occasional or more general users. Protein Explorer
was created by Eric Martz, a professor with the Department of Microbiology
at the University of Massachusetts. For more information about Protein
Explorer, see http://molvis.sdsc.edu/protexpl/frntdoor.htm.
Although this tutorial
will search for and examine the hemochromatosis protein as an example,
the same process can be used to learn about other protein structures of
interest.
Contents of this
tutorial:
Before you begin:
- Download and install
the Chime plug-in (Windows only) from the Chime
web site. Chime is a free program that runs inside your browser
and displays molecular structure in three dimensions. If you have already
installed any earlier versions of Chime, you must uninstall them via
the 'Control Panel > Add/Remove Programs', before installing the
latest version.
- The latest version
of Protein Explorer works in Internet Explorer 6 (Windows only) as well
as Netscape 4.7x (Windows or Macintosh PPC). To download IE 6 go to
the Internet
Explorer Home. To download Netscape 4.7x, go to the Netscape
Archived Products page.
Finding
a Structure Record
1. To begin, access
the PDB home page
http://www.rcsb.org/pdb/.
2. Click on the SearchLite
link in the "Search the Archive" box on the PDB home page.
3. The SearchLite
query interface provides examples of search strings that can be used to
query the PDB database. SearchLite is used to search the text of
PDB files.
To limit the search
to proteins with human source organisms, enter source: human.
Use the protein name and gene symbol in your search string. If you do
not know the official symbol for the gene associated with your protein,
see the OMIM tutorial for a
demonstration on how to obtain this information.
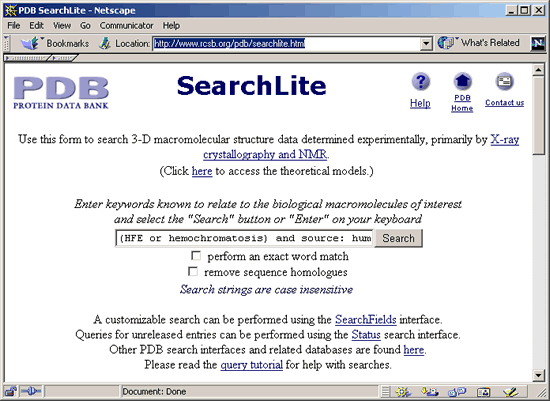
For the hemochromatosis
protein, the search string would be (HFE or hemochromatosis) and
source: human as demonstrated in the screenshot below. Once you
have entered your query, click  or hit Enter on your keyboard. For more help with constructing queries,
see the Tutorial
- Searching the PDB
archive.
4. The search retrieved
6 results. Read the Title field and Molecule subfields under
Compound to determine which structure is the best candidate for
examination. The Compound field is very helpful for figuring out
exactly how many different molecules are included in the structure. Notice
that two molecules (Hemochromatosis Protein and  -2-Microglobulin)
are included in the first structure and three (the previous two plus transferrin
receptor) in the second structure. Also note that different names ("Hfe"
or "Hemochromatosis Protein") can be used to describe the same
hemochromatosis protein molecule. -2-Microglobulin)
are included in the first structure and three (the previous two plus transferrin
receptor) in the second structure. Also note that different names ("Hfe"
or "Hemochromatosis Protein") can be used to describe the same
hemochromatosis protein molecule.
It appears that the
best record is 1A6Z. Click on the EXPLORE
link on the right side of the entry to open this PDB record. The next
section of this tutorial will describe how to examine a 3-D structure
using Protein Explorer.
return
to top
Viewing
a structure in Protein Explorer
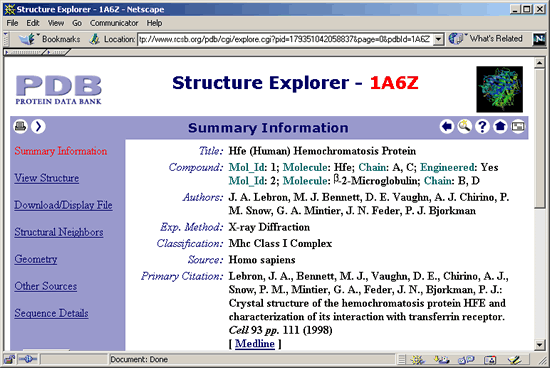
1. The PDB record
for 1A6Z should look like the screenshot below. Once the record is open,
click on View Structure
in the navigation menu on the left. This will open the viewing options
for this structure .
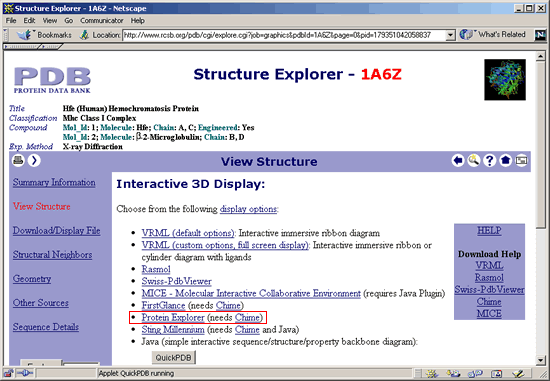
2. At the View
Structure page, click on the Protein Explorer
link (highlighted in screenshot below).
3. If you have downloaded
and installed Chime and are using Netscape 4.7X (Mac or Windows) or Internet
Explorer 6.0, the window below should open. If you have problems with
this step, see PDB's Molecular
Graphics HELP page to access Troubleshooting FAQs.
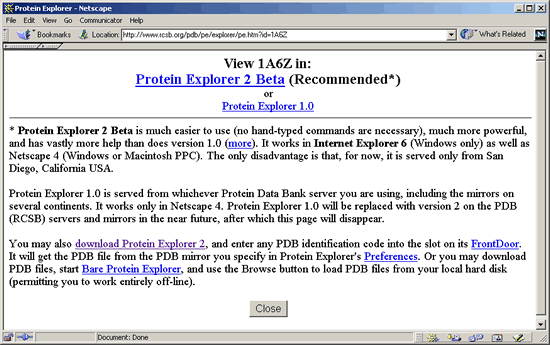
4. Click on Protein
Explorer 2 Beta
to launch Protein Explorer (PE). The PE interface should open with
a three-dimensional representation of the 1A6Z hemochromatosis protein
structure. You may have to wait for a little while as the structure loads.
5. After
clicking OK in the message window that pops up, the PE display should
resemble the screenshot below. Click  to stop the molecule's spinning. Click on this button again to restart
the spinning. To move the molecule while spinning is turned off, simply
click on the structure and drag your mouse to rotate it to a particular
position.
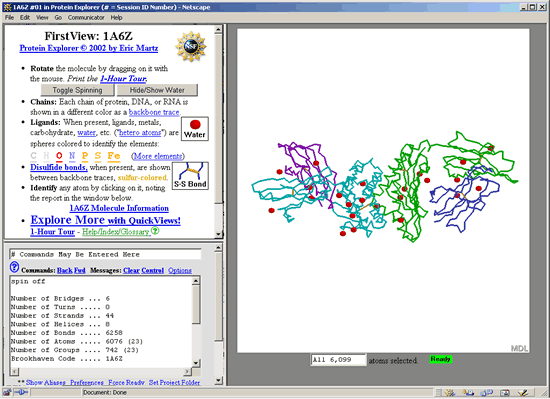
The PE screen consists
of three different frames:
The first frame
(FirstView: 1A6Z) in the upper left corner contains general information
about the structure, display control buttons, and links to help files
and tours.
The second frame
contains a text box for entering commands, and a message box that displays
information about the structure or a particular part of the structure
that has been selected.
The third frame,
containing the actual structure, is the largest. Right clicking on the
structure (Windows users) or clicking and holding the mouse button still
(Mac users) will open a display options menu.
6. The red spheres
around the structure are the oxygen atoms of water molecules. Whenever
you want to identify a part of the structure, click on it with your mouse
and a description will appear in the message box of the second frame.
To remove the spheres click  in the first frame.
7. Protein chains
are represented by different colors. By clicking on each chain and reading
its report in the message box, you will find that the turquoise chain
is chain A; the purple chain is chain B; the green chain is chain C; and
the blue chain is chain D.
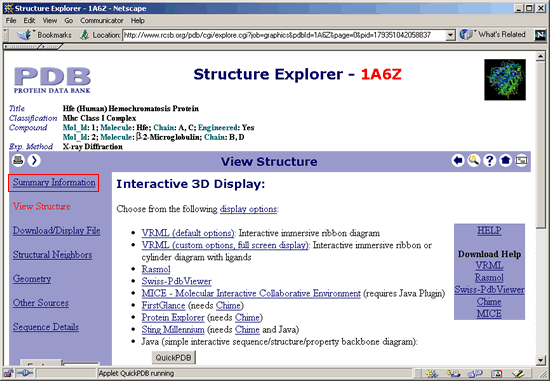
To figure out what
molecules each chain is associated with, minimize the PE window and
restore the Protein Data Bank Structure Explorer window (see screenshot
below). Click Summary Information in the purple column
on the left.
8. The
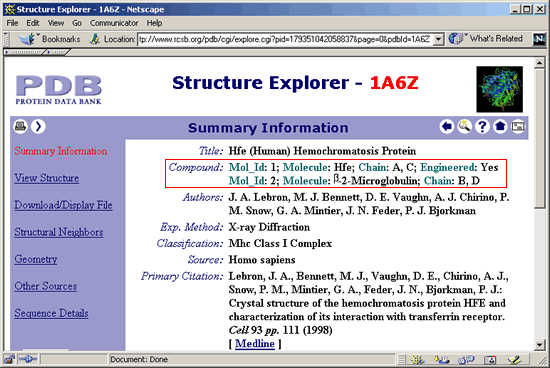
Summary Information for 1A6Z will open again. In the Compound field
under 1AGZ, you will see that chains A and C are Hfe (hemochromatosis
protein) molecules, and chains B and D are  -2-Microglobulin
molecules. -2-Microglobulin
molecules.
9. Click
Sequence Details in the purple column on the left.
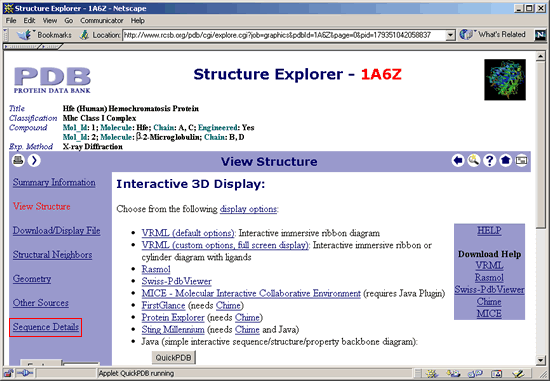
10.
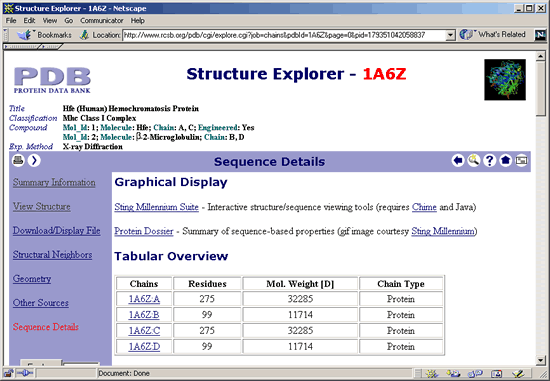
The Sequence Details screen is shown below.
11.
Scroll down the Sequence Details page and click on each chain to view
its sequences. You will find that chains A and C (Hfe) are identical and
chains B and D ( -2-Microglobulin)
are identical. The structure that we have been exploring is really two
molecules of the hemochromatosis protein, where each molecule is associated
with one -2-Microglobulin)
are identical. The structure that we have been exploring is really two
molecules of the hemochromatosis protein, where each molecule is associated
with one  -2-Microglobulin
molecule. -2-Microglobulin
molecule.
If you compare
this structure's Hfe chain sequence (275 amino acids) with its complete
protein sequence (348 amino acids), you will find that the first
22 amino acids and last 51 amino acids of the complete sequence have
been removed.
To understand why
this truncated sequence was used, you will need to read the article
that is listed as the primary citation for this structure (included
in Summary Information of each PDB structure record). This example
underscores the importance of not only viewing a structure but also
accessing other information such as sequence details or cited articles
to understand exactly what the structure represents.
12. Restore the PE
window to continue with the following section of this tutorial where we
will practice modifying display options for a three-dimensional structure.
return
to top
Modifying
display options
This part of the
tutorial will cover altering the display and color of selected portions
of a protein structure.
The default display
setting for each structure is Backbone, and the default color setting
is Chain. The Backbone trace is a line that connects the
alpha carbon positions of each amino acid residue, and does not trace
any actual bonds. The Chain color option gives each chain a particular
color. These settings can be customized.
To customize display
options:
Use the mouse controls
by right clicking (Windows users) or holding down the mouse (Mac users)
on the structure to access the option menu,
or select
the Explore
More with Quick Views link in the FirstView: 1A6Z
frame,
or enter
commands into the text box at the top of the second frame. For descriptions
of the different commands that can be used in Protein Explorer see Select
Commands in Chime and RasMol by Eric Martz.
This tutorial will
briefly demonstrate how to customize a structure display using the mouse
control menu options and the command box.
To alter the color
or display of any portion of the structure, you must first select it.
We want to alter the structure of  -2-microglobulin
chains (chains B and D) so they are more clearly differentiated from
the hemochromatosis protein chains (chains A and C). To do this, access
the options menu using your mouse, and choose Select > Chain >
B. -2-microglobulin
chains (chains B and D) so they are more clearly differentiated from
the hemochromatosis protein chains (chains A and C). To do this, access
the options menu using your mouse, and choose Select > Chain >
B.
Now that Chain
B is selected, alter the display type by accessing the options menu
again and selecting Display > Wireframe. Repeat Step 3 to
select chain D, and change its display to Wireframe as well. The structure
should now resemble the image below.
Experiment
with other display options besides wireframe to see what each option
is like. To return the structure to its default display, select the
Explore
More with Quick Views link in the FirstView: 1A6Z
frame, and select the Reset
View
link. To hide a particular
chain, select it and then choose Select
> Hide > Hide Selected.
Although this protein was named for an associated disorder, the purpose
of this protein is not to cause disease. The function of this protein
is to negatively regulate iron flow into a cell's cytoplasm. Genetic disorders
can arise when this protein is mutated and its structure is altered so
that it cannot carry out its normal biological function. Now let's take
a closer look at the amino acid that is altered in the most common mutation
that causes hemochromatosis.
Unless
otherwise noted, the instructions below involve accessing the options
menu with your mouse by
right clicking (Windows users) or holding down the mouse (Mac users).
1.
Return to
the default display of the structure by selecting the Explore
More with Quick Views link in the FirstView: 1A6Z
frame, and then selecting the Reset
View
link. Once the default display
of the structure has reloaded, stop the spinning and hide the water
molecules (the red balls).
If you run into any problems as you are following these instructions
and feel
like you need to start over, return to this step.
2.
Let's look at just one of the HFE chains, chain A (the turquoise chain).
To do this we must hide the other chains. First, from the options menus,
choose Select > Chain > A. Then to select everything
but chain A, choose Select > Invert Selection.
3.
Can you see some tan or brownish lines within the protein chains? These
lines represent disulfide bonds or disulfide bridges which connect different
parts of protein chains together. We want to hide all of these bridges
in chains B, C, and D. To do this, choose Options > Display
Disulfide Bridges.
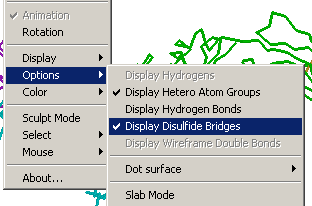 |
A new browser
window will appear. Close this new window, and you should see that
the disulfide bridges in chains B, C, and D have been removed.
4.
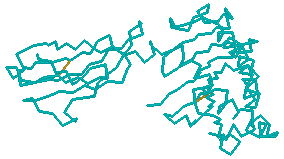
Let's hide everything except chain A. Everything but chain A should
still be selected. From the options menus, choose Select >
Hide > Hide Selected. This should hide chains B, C, and
D, and the structure should look like the image below.
 |
5.
Disulfide bridges are bonds between two cysteine residues (cysteine
is an amino acid) that are required to keep a protein in its proper
structure. Let's take a closer look at the cysteine residues in chain
A. To select only the cysteines in chain A, we will need to type in
a command into the text box in the lower left frame. Type select
cys:a into the text box as shown below, and hit Enter.
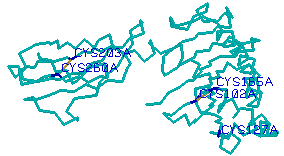
6. Let's change
the color of the cysteines to blue. To do this, from the options menus
choose Select > Change Color To > Blue.
7. Let's also add
labels to these cysteine residues. Choose Options > Labels.
The structure should now look like the image below.
 |
The
most common mutation that causes hemochromatosis is a change of a
single nucleotide in the DNA sequence that substitutes a tyrosine
residue for a cysteine residue at position 282 of the hemochromatosis
protein sequence. For more information about this mutation see the
hemochromatosis gene profile.
Since the first
22 amino acids have been removed from the hemochromatosis protein
sequence for this structure, the cysteine residue associated with
this mutation is cysteine 260 (because 282-22=260).
8. To distinguish
this cysteine residue from the rest of the hemochromatosis protein type
select 260:a into the command box and hit Enter. This selects
amino acid residue 260 of chain A.
9. To change the
color of this residue to red select Select > Change Color To >
Red. You may want to click on the structure and drag your mouse
to move and rotate the structure into another position.
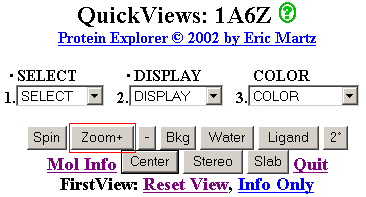
10. To zoom in,
select the Explore More with Quick Views
link in the FirstView: 1A6Z frame (the upper left frame). Click
the Zoom + button (see shot below) a couple of times.
 |
11. To center chain
A in the middle of the viewing frame click the Center button.
When the "Click OK to center one atom by clicking on it..."
window pops up, click OK, and then click on the chain somewhere near
its middle. The structure will center itself around the area that you
clicked.
12. Let's try another
display type. To change the display of chain A from backbone to ribbons,
using the options menus, chose Select > Chain > A
and then choose Display > Ribbons. The structure
should look somewhat like the image below.
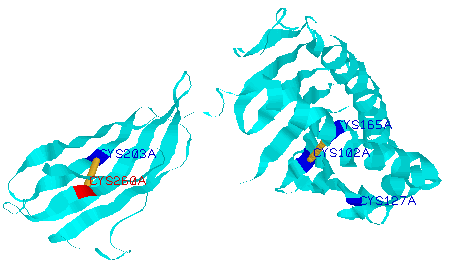 |
As you can see
from this structure, in the mutation that causes hemochromatosis, a
cysteine residue that is involved in a disulfide bridge is mutated.
The disulfide bond holds together two regions of the hemochromatosis
protein.
When the cysteine
residue is replaced by another amino acid, tyrosine, the disulfide bond
is lost, which is detrimental to the protein's structure. As a result,
the protein can no longer perform its normal function regulating iron
uptake, and cells get overloaded with iron. Excess iron leads to organ
damage and other hemochromatosis symptoms and complications.
return
to top
Additional
Protein Explorer resources
This tutorial has
been a very limited introduction to just a few of the many features available
for examining a protein structure with Protein Explorer. To learn about
more options and commands, check out the following tutorials and guides:
1
Hour Tour for Protein Explorer
Frequently
Asked Questions for Protein Explorer
Help,
Index, and Glossary for Protein Explorer
Select
Commands in Chime and RasMol
Tutorial
for Protein Explorer Version 2.0
Acknowledgments
Sources for screenshots:
PDB ID: 1A6Z,
J. A. Lebron, M. J. Bennett, D. E. Vaughn, A. J. Chirino, P. M. Snow,
G. A. Mintier, J. N. Feder, P. J. Bjorkman. "Crystal Structure of the
Hemochromatosis Protein HFE and Characterization of its Interaction
with Transferrin Receptor." [Cell 93, 111 (1998)]. (January 3, 2003).
Eric Martz. "Protein
Explorer Software." <http://proteinexplorer.org>
(January 3, 2003).
Continue
with other tutorials:
Searching
OMIM: Finding information about genes, traits, and disorders
Finding
a gene on a chromosome map
Accessing
records in NCBI's sequence databases
Sequence
similarity searching using NCBI BLAST
|
![]() 2
2
![]() 3
3
![]() 4
4
![]() 5
5
![]() 6
6
![]() 7
7
![]() 8
8
![]() 9
9
![]() 10
10
![]() 11
11
![]() 12
12
![]() 13
13
![]() 14
14
![]() 15
15
![]() 16
16
![]() 17
17
![]() 18
18
![]() 19
19
![]() 20
20
![]() 21
21
![]() 22
22
![]() X
X ![]() Y
Y![]() Site
Index
Site
Index ![]() Chromosome
Viewer
Chromosome
Viewer ![]() Genetic
Disorder Guide
Genetic
Disorder Guide ![]() Gene
and Protein Guide
Gene
and Protein Guide ![]() Bioinformatics
Tutorials
Bioinformatics
Tutorials![]() Bioinformatics
Terms
Bioinformatics
Terms ![]() Sample
Profiles
Sample
Profiles ![]() Evaluating
Medical Information
Evaluating
Medical Information ![]() Links
Links
![]() FAQs
FAQs ![]() Order Poster
Order Poster
