
 |
|
 |

 Injury
ICE Activities
Injury
ICE ActivitiesHow has the International Collaborative Effort (ICE) been a Resource for Problem Response?
Slide 1
How has the ICE been a resource for problem response?
Colin Cryer
Injury Prevention Research Unit
University of Otago
9th World Conference on Injury Prevention and Safety Promotion, March 2008
Slide 2
ICE 2nd Symposium - 1999
Notes: Minimum Data Set for Injury Monitoring – when I attended this meeting my colleagues and I in SE England were grappling with the self-same questions of what data should be collected in injury surveillance systems to inform injury prevention. The work presented was extremely valuable to inform those discussions; discussions that go on around the world. There is of course the WHO surveillance guidelines, that have been published subsequently, of which a number of ICE members were authors, to now help with these discussions.

Slide 3
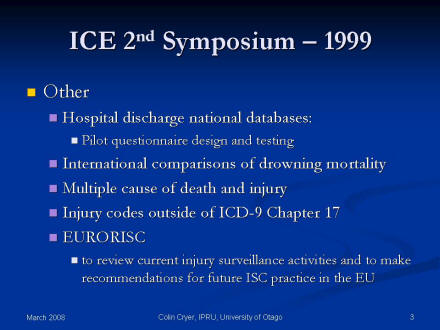
ICE 2nd Symposium - 1999
Notes: The other presentations included those listed here. Let me just single out a couple for comment.
The presentation on “Hospital Discharge National Databases Pilot Questionnaire – Pilot questionnaire design and testing” was less relevant to me then than it is now. I am currently engaged in a project to estimate injury-specific probabilities of admission to hospital across several countries. There are a number of factors that influence the likelihood of admission, and so we need to be aware of those factors as context for our results. The presentation in 1999 describes the development of a questionnaire to gather information on important service utilisation factors that influence whether someone is likely to get admitted to hospital given an injury.
The presentation on “Injury codes outside of ICD-9 Chapter 17” struck a chord with me then, as it does now. Whenever we engage in quantitative injury work, we need to define what we are talking about. Ideally this should include not only a theoretical definition of injury, but also an operational (or case) definition of injury. The case definition is often in terms of the injury chapter in ICD, ie. chapter 17 in ICD-9 and Chapter XIX in ICD-10. As the paper by Langley and Brenner indicate in their 2004 Injury Prevention commentary, there is a potential mismatch between what is in these Injury chapters and the theoretical definition of injury. This works both ways. Some codes within these chapters you might not want to include in your case definition, and some outside of this chapter you might want to include. The paper presented in 1999 deals with the latter issue, and it is as relevant today as it was almost 10 years ago.
So coming back to my first statement – I was blown away by the amount of relevant information that was being presented at this meeting. I decided that I wanted to be part of this international collaborative effort. Fortunately, our work on injury indicators has been of interest and relevance to ICE so I was invited back to the next working meeting, and to subsequent meetings.
For the rest of this presentation, let me focus on our work and the interplay between our work outside of ICE and what we have contributed to ICE and vice versa what ICE has contributed to our work.
Slide 4
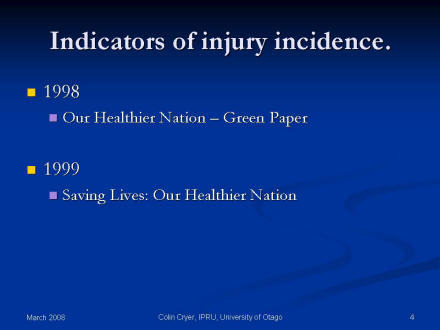
Indicators of injury incidence.
Notes: To illustrate how ICE has been a resource for problem response, in the remainder of this presentation I will describe work we have been doing in order to develop indicators of injury incidence, and the part that ICE has played in this.
I got back into working on indicators in the late 1990s when I was working in a public health departement of a medical shool in England. In 1998, the newly elected Labour Government put out a discussion document (a Green paper) describing the proposed givernment’s response to the public health problems in England. They idnetified 4 priority areas, one of which was accidental injury. Associated with each prioity area was a headline indicator to be used to monitor progress in reaching the propsed target. The proposed target in this Green paper was to reduce reduce injury that results in medical attention by 20% by the target date.
Our concern about this was that this would ficus attention on minor injury, since the majority of injuries that are seen by medical staff are relatively minor in nature – and reducing minor injury may not affect what we are really interested in, which is to reduce serious injury.
As a result of this and other submissions at the time, a new trget and indicator was proposed which was to reduce injury admitted to hospital for over 3 days by 20% the target year. We were please that they had changed their target and indicator, but this introduced a new concern – illustrated by the following two slides.
I would like to say, at this point, that much of the work this early work was done in collaboration with Professor Steve Jarvis at the University of Newcastle, England - so I would like to acknowledge him and his group.
Slide 5
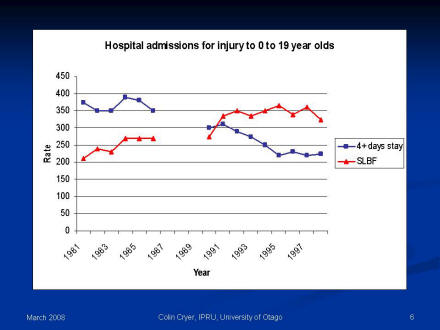
Notes: What this graph shows is a reduction in the rates of childhood injury resulting 4 or more days stay in hospital over the period 1981 to 1998. This is the indicator that is the basis of our governments injury reduction target. If this pattern is continued, the government might think that they have done well and met the injury their target of reducing serious injury.

Slide 6
Notes: However, If we contrast this trend with that for an anatomically based definition of injury, namely serious long bone fracture, we see an upward trend.
If these data are examined further we find that:
- serious long bone fracture form the majority of serious injury amongst this age group in this region of England
- average lengths of stay for serious long bone fractures, as well as for most other injuries have been reducing over this period.
So, from these data, it is likely that the rate of serious injury amongst children over this period has been increasing , rather than decreasing, as would be suggested by the government’s indicator. What has been decreasing is the length of stay of people who are injured.
The message is, therefore, that service utilization-based indicators can be very misleading.
As a result of this work, we started to think about what criteria we would like an valid indicator of injury incidence to satisfy – by valid we mean simply an indicator that is not misleading.
Slide 7
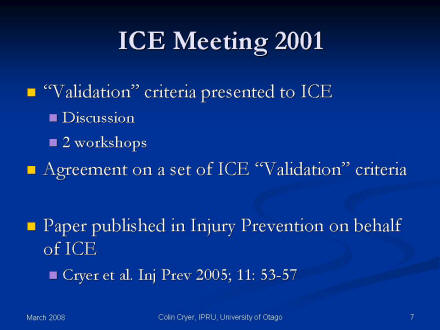
ICE Meeting 2001
Slide 8
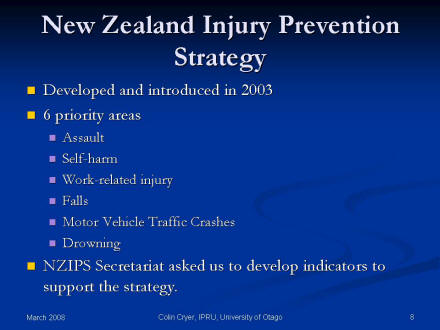
New Zealand Injury Prevention Strategy
Slide 9
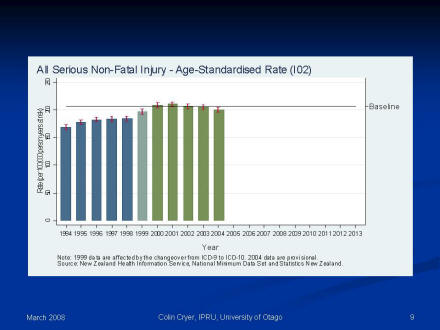
This slide shows the trend in serious non-fatal all injury rates in New Zealand, suggesting that prior to 1999 the rates were increasing year to year, but from 2000 onwards there is a suggestion that they have been decreasing.
Notes: This we did for the 6 priority groups and for all injury.
We developed fatal and serious non-fatal injury indicators. We used the ICE criteria to guide the development of those indicators.
Finding fatal injury indicators that satisfy the ICE criteria was relatively easy. These were based on the national Mortality Collection, which in turn is based on data collected from death registrations and coroner’s reports. Although it was easy, fatal injury indicators based on these data are not without their problems. I will save that discussion for another day.
It was much more difficult finding / developing serious non-fatal injury indicators that satisfy our validity criteria. This we did, however, by defining serious in terms of a threat to life severity threshold, based on ICISS, the ICD-based Injury Severity Score. ICISS is empirically derived from ICD diagnosis based survival rate estimates. Again I will save the detail for another time.
The trend in serious non-fatal all injury is shown in this figure. It suggests that prior to 1999 the rates were increasing year on year, but from 2000 onwards they appear to be decreasing.
Slide 10
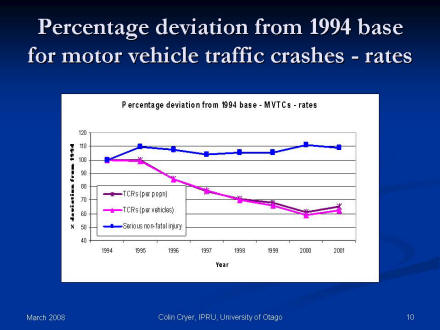
Percentage deviation from 1994 base for motor vehicle traffic crashes - rates
This slide shows the trends in the percentage deviation from 1994 base for motor vehicle traffic crash rates in New Zealand. Two of the three trend lines are the official Department of Transport indicators showing declining rates both per population and per vehicle. The third trend line is the rate based on the motor vehicle traffic crash serious injury indicator and that rate shows very little change.
Notes: Taking account of the limitations of available data in New Zealand, and also the scientific basis of severity measurement, we think that these indicators are the best that could have been done. They give a different picture of what is happening in New Zealand compared with the official Department of Transport indicators.
If we contrast the trends in the official national indicators of road safety performance for the 10 years before the introduction of the NZIPS, with one of the serious non-fatal MVTC indicators that have been adopted by NZIPS. These demonstrate that totally different conclusions would be reached regarding the effects of road safety initiatives in New Zealand over the last 10 years. From the official indicators, the conclusion would be that things are on track – ie. that they are improving. Looking at the NZIPS indicator, you would conclude that we have not been making the improvements in road safety as had been thought. Other priority areas demonstrate similar concerns.
At this point, I would also like to acknowledge my collaborators on this work and other indicator related work at the Injury Prevention Research Unit, University of Otago – particularly Professor John Langley.
Slide 11
ICE Meeting

Slide 12
How has ICE been a resource for problem response?
Slide 13
Schematic answer.
Outside of ICE
- Develop thinking
- Research
- Development
ICE
- Gain information
- Gain ideas
- Critical comment on work
- Collaboration

Slide 14
Post-script

Injury
ICE Activities |
Initiatives
and Other Activities Home | NCHS
Home |
This page last reviewed
May 23, 2008
|
