
 |
|
 |

 Injury
ICE Activities
Injury
ICE ActivitiesInternational Collaborative Effort (ICE) on Injury Statistics and its Success in Problem Identification & Description
How has the ICE on Injury Statistics been successful for problem identification and description?
Slide 1
ICE on Injury Statistics and its Success in Problem Identification & Description
9th World Conference on Injury Prevention & Safety Promotion
Merida, 15-18 March, 2008
Yvette Holder, MPH
International Biostatistics & Information Services
Slide 2
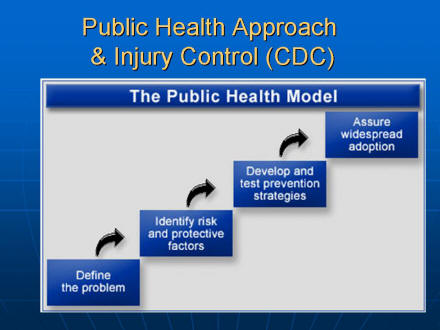
Public Health Approach & Injury Control (CDC)
This figure shows the steps of the public health approach to injury control starting with defining the problem, followed by identifying risk and protective factors, followed by developing and testing prevention strategies, and finally, assuming widespread adoption of effective strategies.
Slide 3
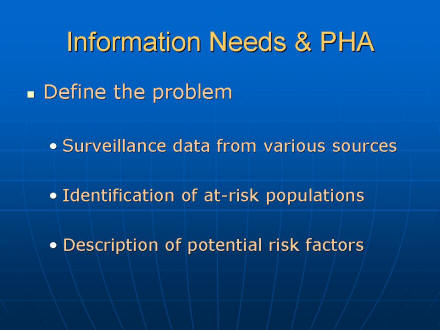
Information Needs & PHA
Slide 4
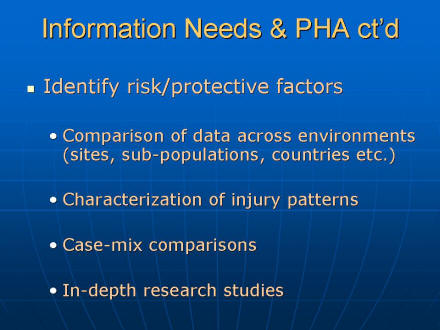
Information Needs & PHA ct'd
Slide 5
Information Needs & PHA ct'd
Slide 6
Information Needs & PHA

Slide 7
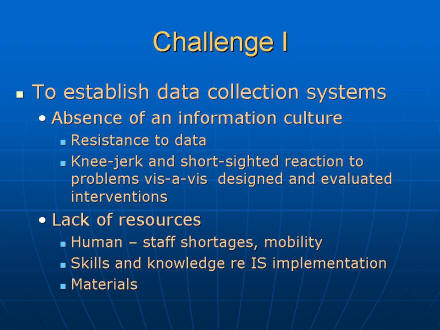
Challenge I
Slide 8
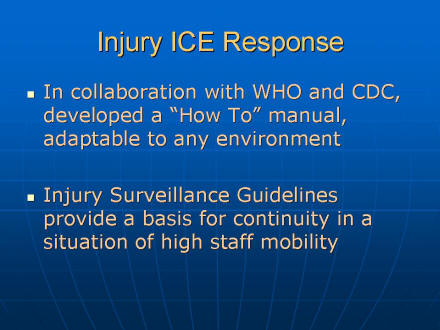
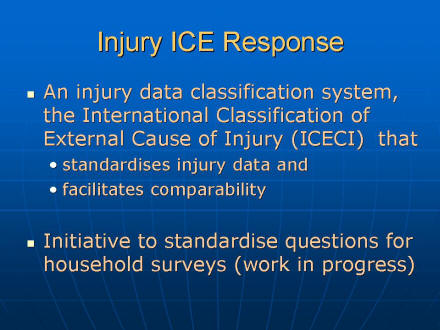
Injury ICE Response
Slide 9
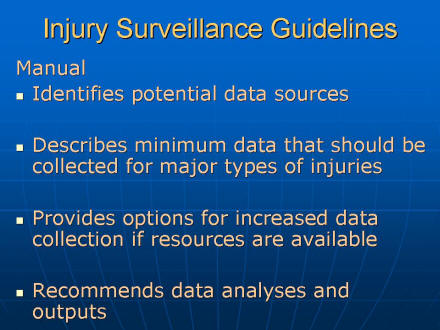
Injury Surveillance Guidelines
Manual
- Identifies potential data sources
- Describes minimum data that should be collected for major types of injuries
- Provides options for increased data collection if resources are available
- Recommends data analyses and outputs
Slide 10
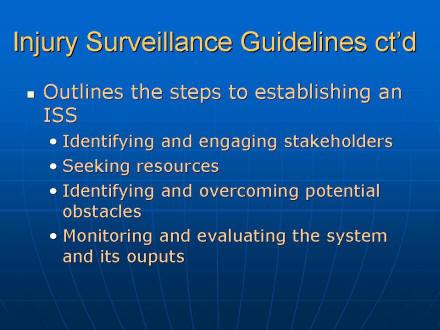
Injury Surveillance Guidelines ct'd
Slide 11
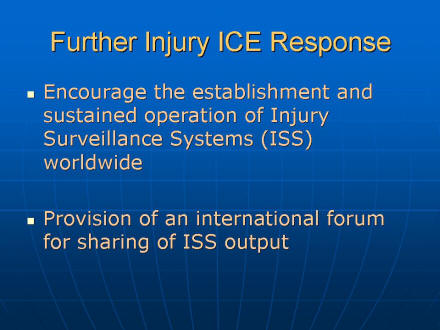
Further Injury ICE Response
Slide 12
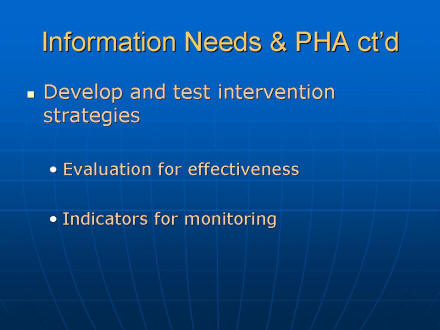
Information Needs & PHA ct'd

Slide 13
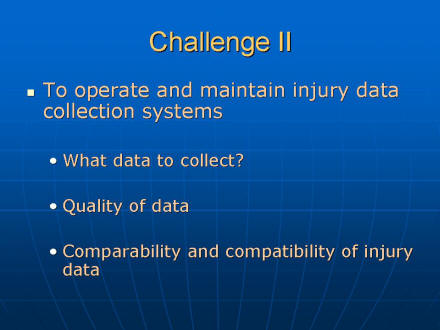
Challenge II
Slide 14
Injury ICE Response
Slide 15
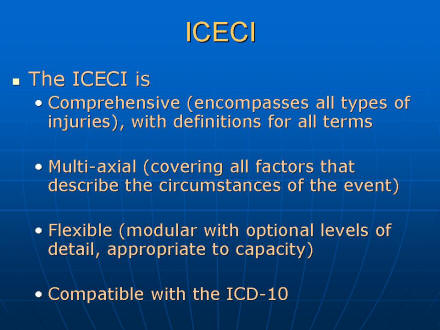
ICECI
Slide 16
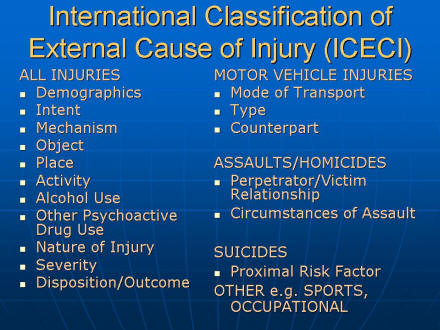
International Classification of External Cause of Injury (ICECI)
ALL INJURIES
MOTOR VEHICLE INJURIES
ASSAULTS/HOMICIDES
SUICIDES
OTHER e.g. SPORTS, OCCUPATIONAL
Slide 17
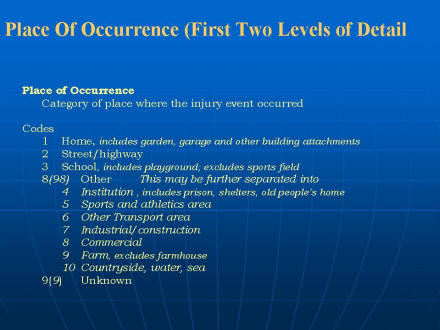
Place Of Occurrence (First Two Levels of Detail
Place of Occurrence - Category of place where the injury event occurred
Codes
1 Home, includes garden, garage and other building attachments
2 Street/highway
3 School, includes playground; excludes sports field
8(98) Other This may be further separated into
4 Institution , includes prison, shelters, old people's home9(9) Unknown
5 Sports and athletics area
6 Other Transport area
7 Industrial/construction
8 Commercial
9 Farm, excludes farmhouse
10 Countryside, water, sea
Slide 18
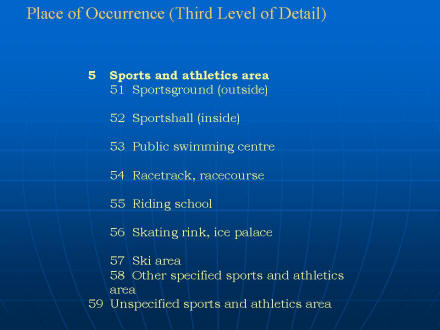
Place of Occurrence (Third Level of Detail)
5 Sports and athletics area
51 Sportsground (outside)
52 Sportshall (inside)
53 Public swimming centre
54 Racetrack, racecourse
55 Riding school
56 Skating rink, ice palace
57 Ski area
58 Other specified sports and athletics area
59 Unspecified sports and athletics area
Slide 19
Information Needs & PHA ct'd

Slide 20
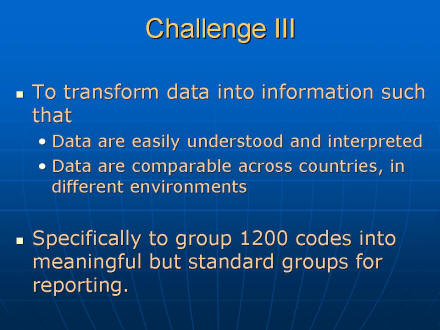
Challenge III
Slide 21
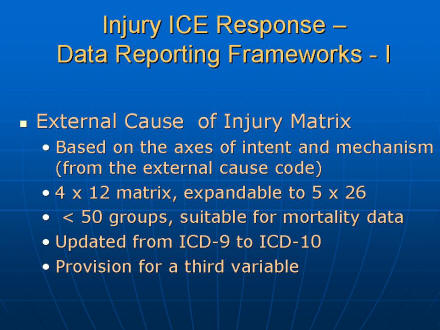
Injury ICE Response -
Data Reporting Frameworks - I
Slide 22
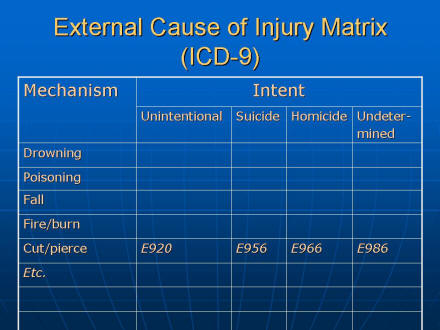
External Cause of Injury Matrix
(ICD-9)
This figure shows the outline of the external cause of injury matrix with rows being the mechanisms of injury (examples include drowning, poisoning, fall, fire or burn, cut or pierce) and the columns the intent (unintentional, suicide, homicide and undetermined). The cells of the matrix contain the ICD-9 codes (in this case) that identify the mechanism and intent. The example given is for cut or pierce, coded as E920 for unintentional, E956 for suicide, E966 for homicide and E986 for undetermined.
Slide 23
Injury Ice Response -
Data Reporting Frameworks II
Slide 24
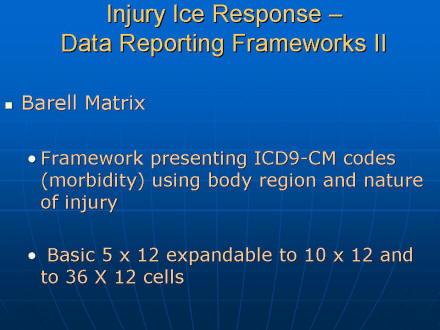
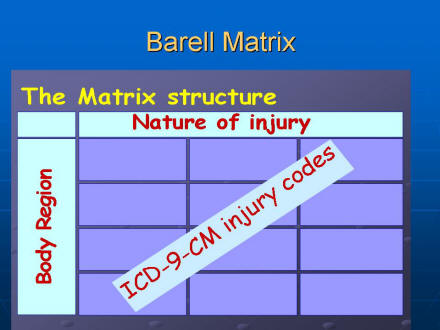
Barell Matrix
This figure shows the outline of the Barell matrix that was described in Slide 23. The rows of the matrix are body regions of injury and the columns are for the nature of the injury. Cells are filled with ICD-9-CM injury codes.
Slide 25
Injury ICE Response -
Data Reporting Frameworks - III
Slide 26
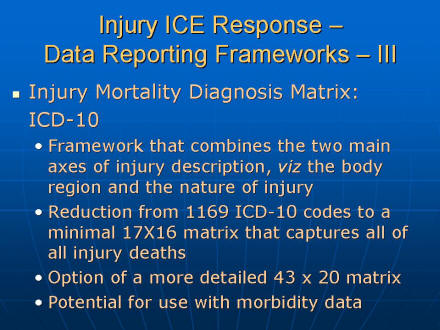
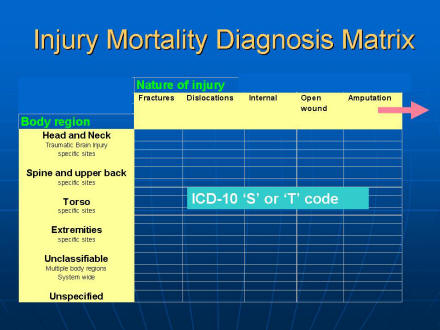
Injury Mortality Diagnosis Matrix
This figure shows the outline of the Injury Mortality Diagnosis Matrix that was described in slide 25. The rows of the matrix are body regions of injury and the columns are for the nature of the injury. Cells are filled with ICD-10 S or T injury diagnosis codes.
Slide 27
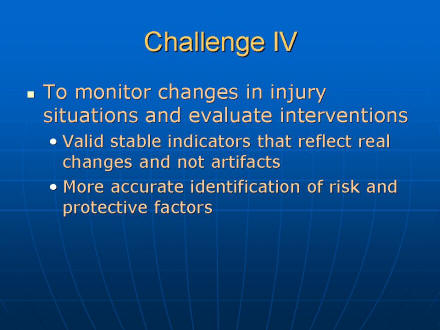
Challenge IV
Slide 28
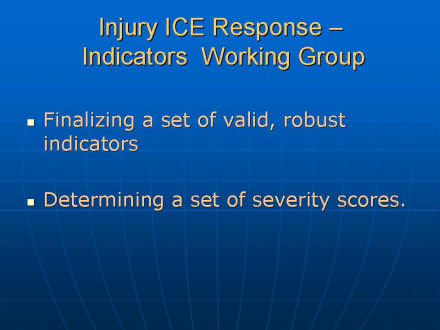
Injury ICE Response -
Indicators Working Group
Slide 29
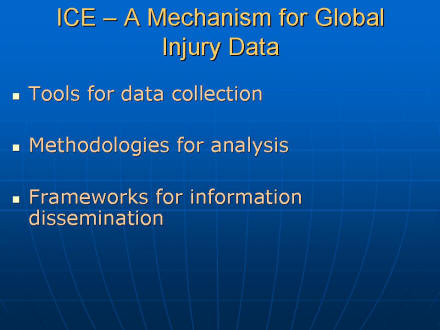
ICE - A Mechanism for Global Injury Data
Slide 30
Conclusion
All ICE efforts serve multiple objectives toward the goal of information for global injury prevention - truly a mechanism of globalization for injury prevention and control
Injury
ICE Activities |
Initiatives
and Other Activities Home | NCHS
Home |
This page last reviewed
May 23, 2008
|
