

 Climate Monitoring / Climate of 2007 / East Pacific Hurricanes / Help Climate Monitoring / Climate of 2007 / East Pacific Hurricanes / Help
Use these links to access detailed analyses of Global and U.S. data 
MAY | JUNE | JULY | AUGUST | SEPTEMBER | OCTOBER | NOVEMBER | SEASONAL SUMMARY | Links Alvin (5/26-31) | Barbara (5/29-6/2) | Three-E (6/11-13) | Cosme (7/14-7/23) | Dalila (7/22-7/27) Erick (7/31-8/2) | Flossie (8/8-8/16) | Gil (8/29-9/2) | Henriette (8/30-9/6) | Ivo (9/18-9/23) Juliette (9/29-10/1) | Kiko (10/15-10/23)
|
|||||||||||||||||||||||||||||||||||||||||||||||||||||||||||||||||
|
Averages: Click here for information on the 2006 eastern North Pacific Hurricane season. |
 Click for larger image |
|
2007 Season Summary: Eleven named storms formed in the East Pacific Hurricane Basin during 2007, which is below the recent ten-year average. Four of these storms were classified as hurricanes and one of these was a major hurricane (Category 3-5 on the Saffir-Simpson Scale). The most notable hurricane of the season was Flossie, which became a Category 4 hurricane on August 11, threatening the Hawaiian Islands. The storm weakened slightly and passed south of the Big Island of the Hawaii on the 13th of August. For more information on Flossie, see the August summary below. Two tropical storms made landfall in Mexico/Guatemala during the 2007 season. Tropical Storm Barbara came ashore near the border of Mexico and Guatemala on June 2nd. Hurricane Henriette was the only East Pacific Hurricane to make landfall this year, but it made landfall twice: once over the tip of the Baja California peninsula of Mexico on September 4th, and once again the next day near Guaymas, Sonora, Mexico. For additional information on these and all of the 2007 season storms, please see the summaries below. More statistical information may be found on NCDC's 2007 Northeast Pacific Tropical Cyclone statistics page. |
|
|
Please note that convention reports tropical storm winds in knots (kt) and pressures in millibars (mb). |
 November
No tropical activity reported in the Eastern Pacific basin in November.
October
 Tropical Storm Kiko Satellite Image |
 Tropical Storm Kiko Track Map  Saffir-Simpson Scale Color Legend |
| On October 15, Tropical Depression Fifteen-E formed about 400 miles southwest of Manzanillo, Mexico. It remained relatively stationary and strengthened briefly into Tropical Storm Kiko on the 16th before it weakened from wind shear and was downgraded to a depression. On October 17, the storm intensified back into a tropical storm and began to move east-northeast toward Mexico, then turned northwest on the 19th and moved parallel to the Mexican coast. Kiko continued to strengthen until the 21st, then began to weaken and move westward until it dissipated on October 23. The maximum sustained winds of Tropical Storm Kiko were 110 km/hr (60 knots or 69 mph), and the minimum pressure was 991 mb. More information may be found on NCDC's 2007 Northeast Pacific Tropical Cyclone statistics page, at the NOAA National Hurricane Center. | |
September
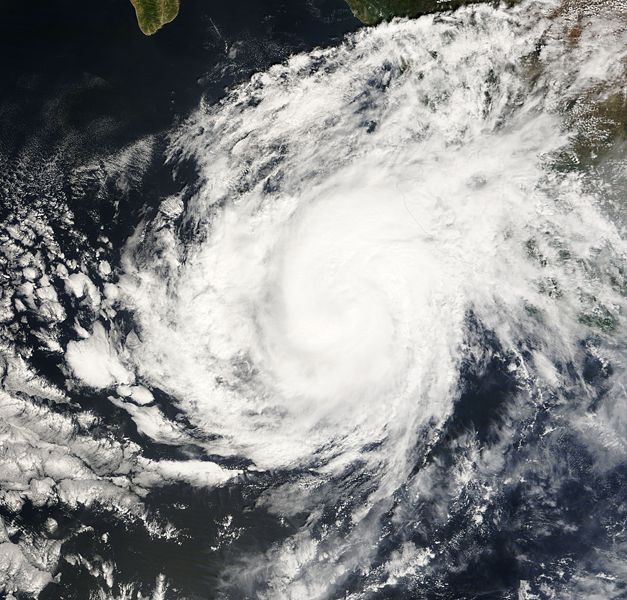
 Hurricane Henriette Satellite Image |
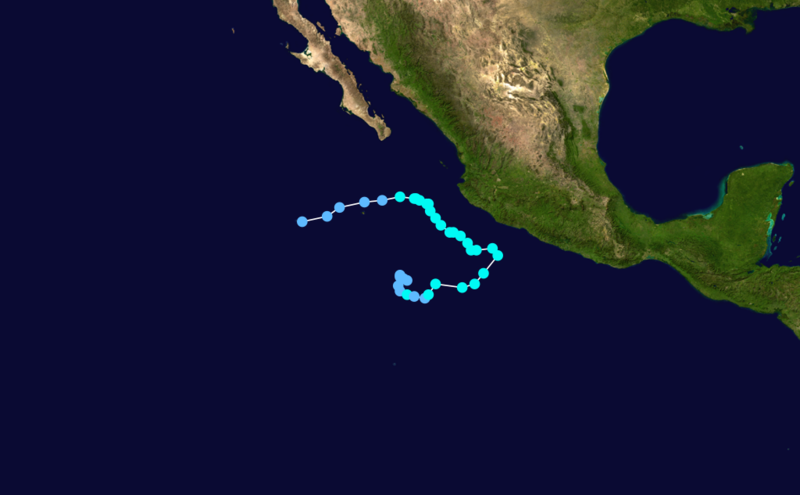
 Hurricane Henriette Track Map Saffir-Simpson Scale Color Legend |
| Hurricane Henriette began as a tropical depression about 400 km (250 miles) southeast of Acapulco, Mexico on August 30, and it strengthened into a tropical storm by September 1. Henriette brought heavy rain to the Mexican coast as it traveled northwest, and strengthened to hurricane classification on September 4. Hurricane Henriette first made landfall on the tip of the Baja California peninsula near San José del Cabo on September 4, and quickly passed into the Sea of Cortez. Henriette made landfall for the second time on September 5 near Guaymas, Sonora, Mexico, and was declassified as a tropical depression on September 6. The maximum sustained winds of Hurricane Henriette were 140 km/hr (76 knots or 87 mph), and the minimum pressure was 972 mb. More information may be found on NCDC's 2007 Northeast Pacific Tropical Cyclone statistics page, at the NOAA National Hurricane Center. | |
 Hurricane Ivo Satellite Image |
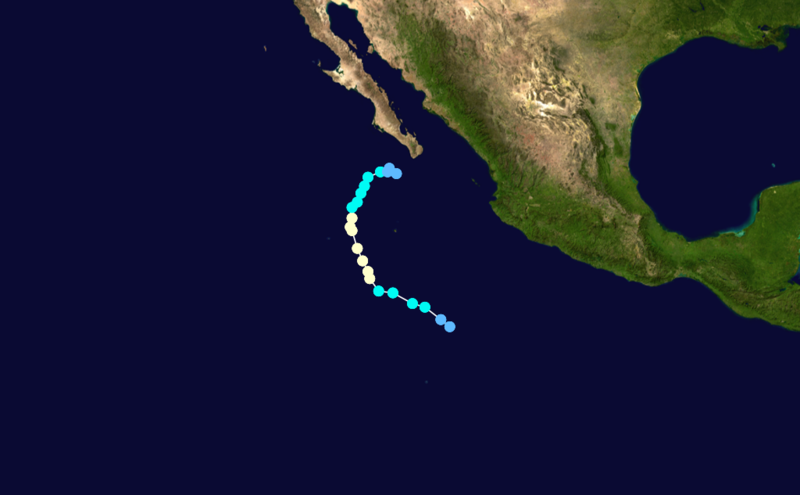 Hurricane Ivo Track Map Saffir-Simpson Scale Color Legend |
| Hurricane Ivo formed on September 18 as a tropical depression about 1080 km (670 miles) south-southeast of the southern tip of Baja California. The system was upgraded to a tropical storm later that day and strengthened to a hurricane on September 19. Although Ivo spent its first few days in the open ocean, it moved close enough to land on September 22 for the National Hurricane Center to issue a tropical storm watch for the extreme southern coast of the Baja California Peninsula. Ivo weakened as it curved northeast and then eastward toward the peninsula and the Mexican Government discontinued the tropical storm watch on early in the morning of September 23. The maximum sustained winds of Hurricane Ivo were 130 km/hr (70 knots or 80 mph), and the minimum pressure was 980 mb. More information may be found on NCDC's 2007 Northeast Pacific Tropical Cyclone statistics page, at the NOAA National Hurricane Center. | |
 Tropical Storm Juliette Satellite Image |
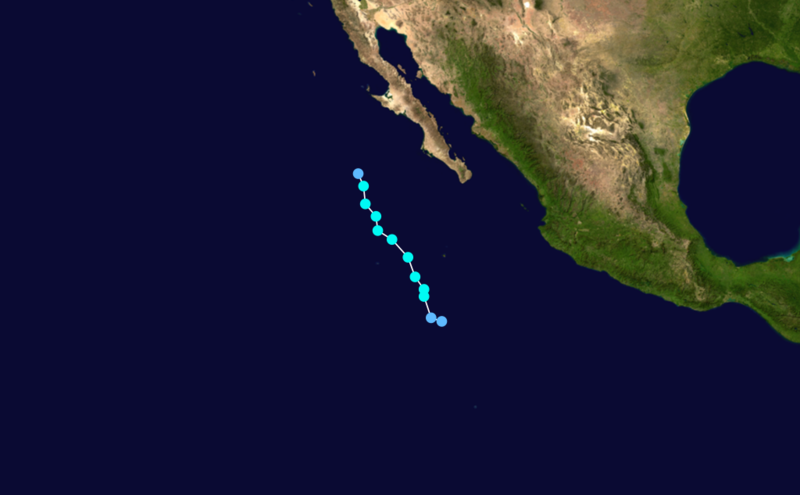 Tropical Storm Juliette Track Map Saffir-Simpson Scale Color Legend |
| Tropical Storm Juliette beggan as a low-pressure system west-southwest of Manzanillo, Mexico and strengthened into a tropical storm, then a hurricane, on September 29. Juliette reached its peak the next day and was weakened by increasing levels of shear until it dissipated late on October 1. The maximum sustained winds of Tropical Storm Juliette were 85 km/hr (46 knots or 50 mph), and the minimum pressure was 1000 mb. More information may be found on NCDC's 2007 Northeast Pacific Tropical Cyclone statistics page, at the NOAA National Hurricane Center. | |
August
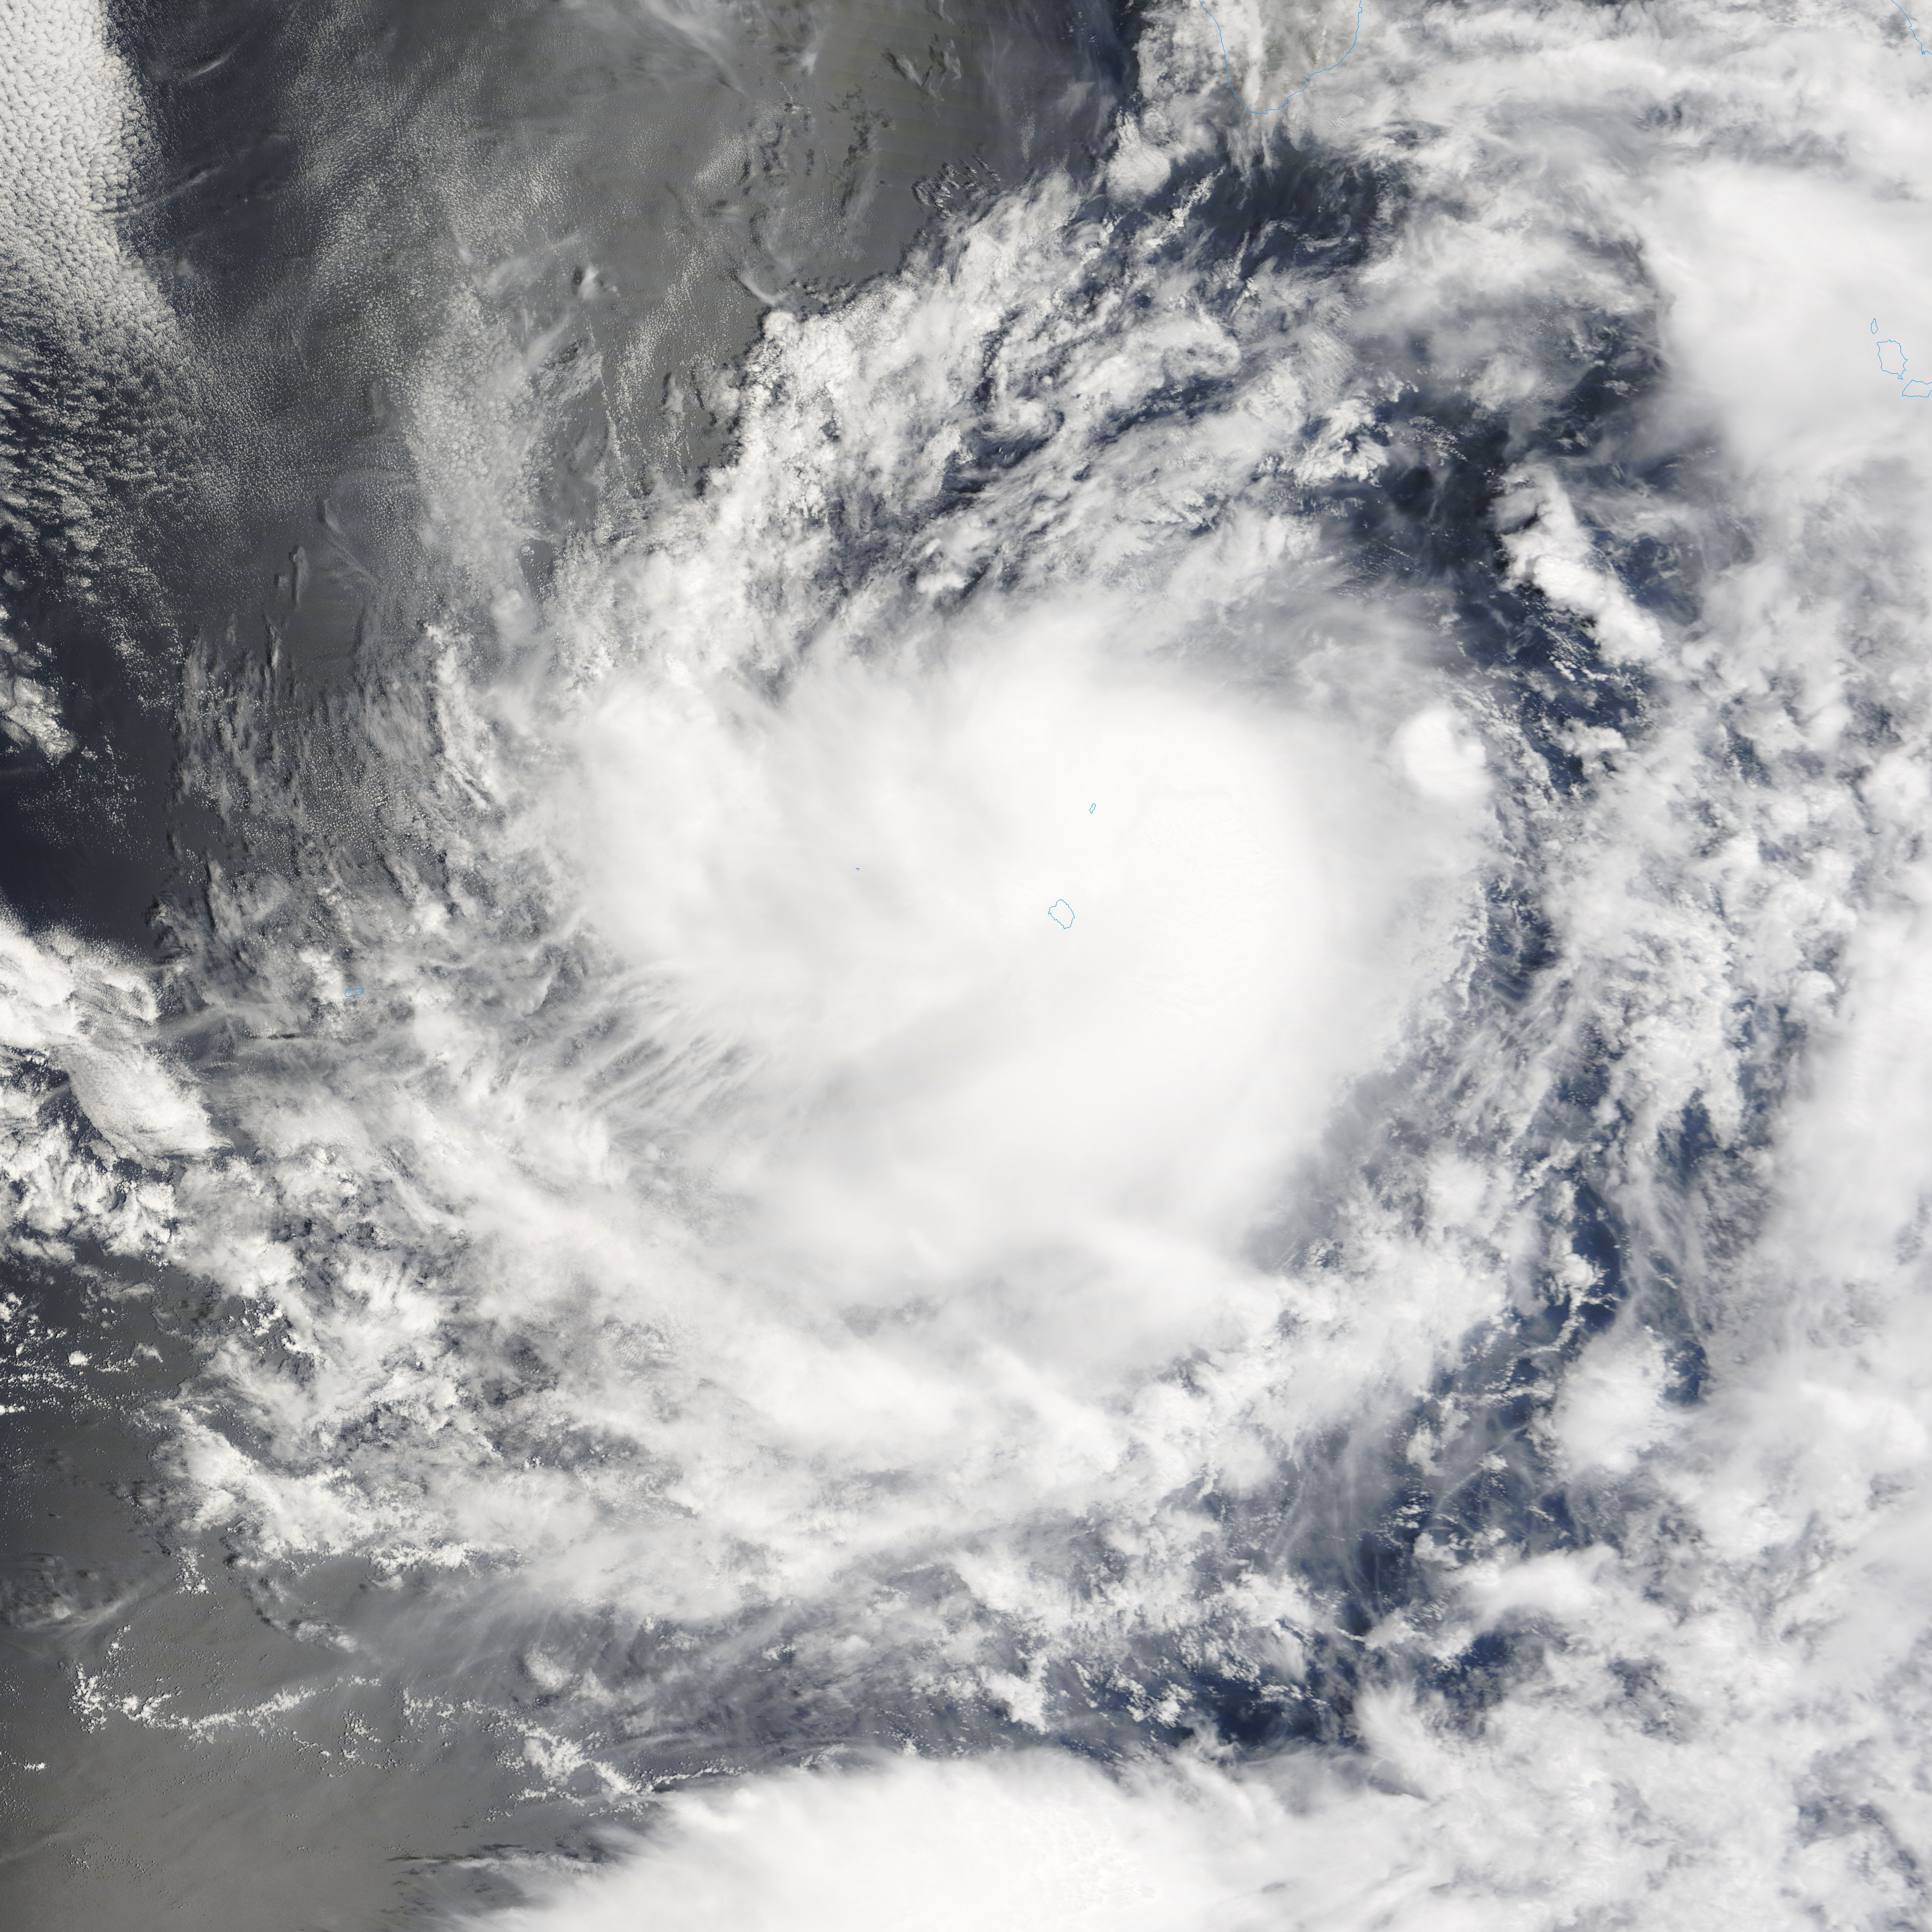
 Hurricane Flossie Satellite Image |
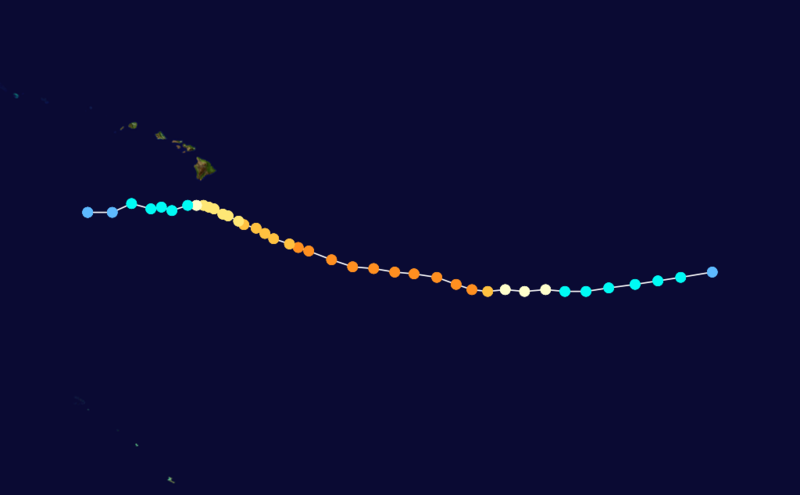 Hurricane Flossie Track Map Saffir-Simpson Scale Color Legend |
| Flossie developed as a tropical disturbance about 600 miles (970 km) south-southeast of Acapulco on August 2. It was classified as tropical depression on the afternoon of the 8th and intensified enough to be upgraded to Tropical Storm Flossie later that day. As Flossie tracked steadily westward, it developed an eye on August 9 and was upgraded to a hurricane on the tenth. Under favorable conditions, Flossie rapidly intensified overnight and was classified as a major hurricane in the wee hours of August 11. It continued its west-northwestward track into the Central Pacific, approaching the Hawaiian Islands, and its winds reached speeds of up to 140 mph (220 km/h). It weakened slightly on the 12th and 13th due to increased vertical shear, and passed south of the Big Island of Hawaii. Flossie continued to weaken and was downgraded to a tropical depression on August 16. The minimum central pressure of Flossie was 946 mb, and the maximum sustained winds were 220 km/hr (119 knots or 137 mph). More information may be found on NCDC's 2007 Northeast Pacific Tropical Cyclone statistics page, at the NOAA National Hurricane Center, or at the NOAA Central Pacific Hurricane Center. | |
 Tropical Storm Gil Satellite Image |
 Tropical Storm Gil Track Map Saffir-Simpson Scale Color Legend |
| An area of disturbed weather west of Manzanillo, Colima, Mexico, was classified as a tropical depression early on August 29, and was upgraded to Tropical Storm Gil later that afternoon. Gil was short-lived due to the unfavorable wind shear and stable environment it encountered. Tropical Storm Gil dissipated on September 2. The maximum sustained winds of Gil were 75 km/hr (40 knots or 47 mph), and the minimum pressure was 994 mb. More information may be found on NCDC's 2007 Northeast Pacific Tropical Cyclone statistics page, at the NOAA National Hurricane Center. | |
July
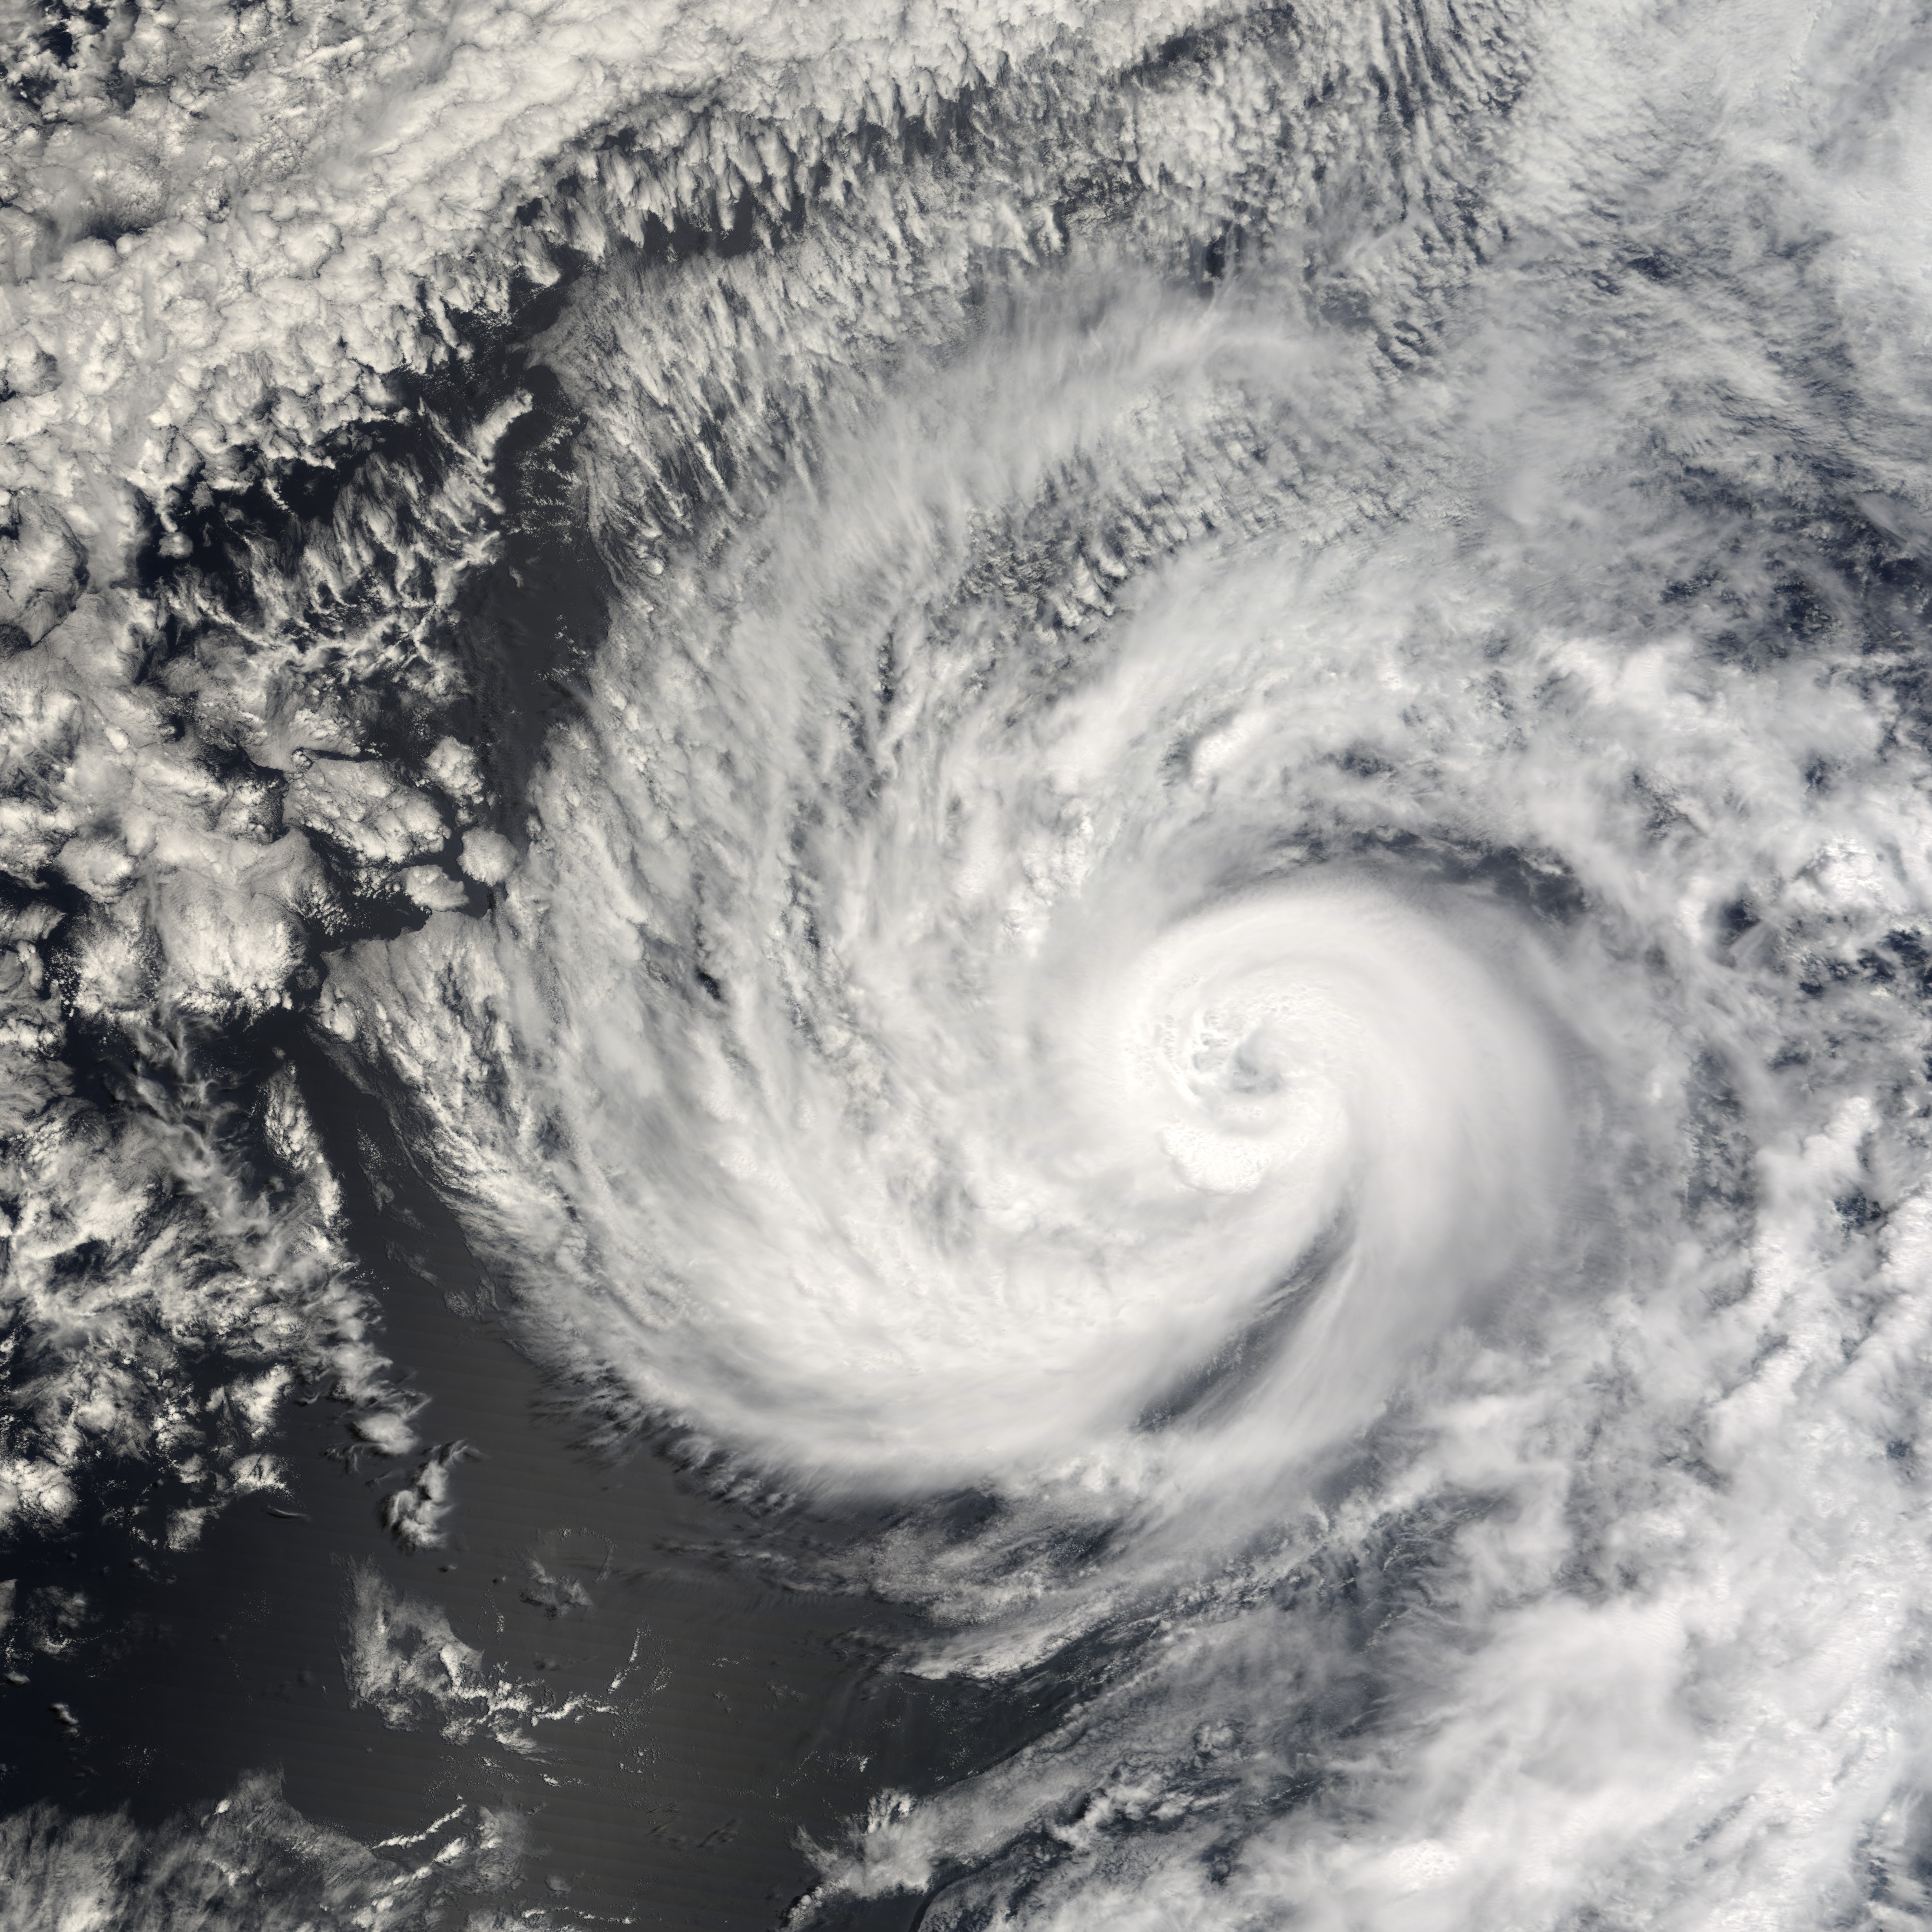 Hurricane Cosme Satellite Image |
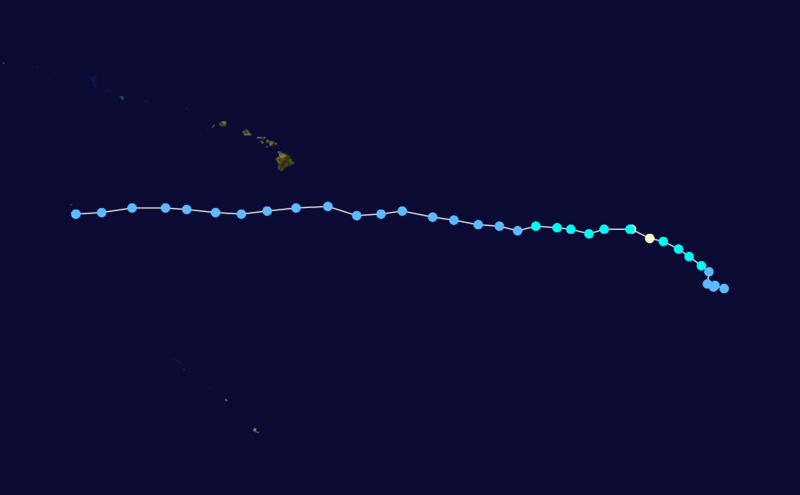 Hurricane Cosme Track Map Saffir-Simpson Scale Color Legend |
| Cosme was first identified as an area of disturbed weather about halfway between Mexico and Hawaii in mid July. On the 15th, the storm was classified as a tropical storm with deep convection and an intensifying surface circulation. Under favorable conditions, Cosme became the first hurricane of the East Pacific season on the 16th. Soon after reaching hurricane strength, Cosme entered an environment of cooler waters and wind shear, which began to weaken the storm. On the 21st, Cosme passed approximately 185 miles (295 km) south of the Big Island of Hawaii bringing tropical storm gusts and heavy rain to parts of the island. While a hurricane, Cosme reported peak winds of 120 km/hr (65 knots or 75 mph) and a minimum central presure of 987 mb. More information may be found on NCDC's 2007 Northeast Pacific Tropical Cyclone statistics page or at the NOAA National Hurricane Center. | |
 Tropical Storm Dalila Satellite Image |
 Tropical Storm Dalila Track Map |
| On the morning of July 20th, a disturbance formed a few hundred miles south-southwest of the Gulf of Tehuantepec. By the 21st, this disturbance had developed into a depression. Despite moderate wind shear on the 23rd, convection began to deepen and the storm was upgraded to a tropical storm. Dalila remained a weak tropical storm and reached peak strength the afternoon of the 24th. Over the next several days, Dalila moved over cooler waters, which weakened the system. At peak intensity, Dalila had winds of 95 km/hr (52 knots or 60 mph) with a minimum central presure of 997 mb. More information may be found on NCDC's 2007 Northeast Pacific Tropical Cyclone statistics page or at the NOAA National Hurricane Center. | |
 Tropical Storm Erick Satellite Image |
 Tropical Storm Erick Track Map Saffir-Simpson Scale Color Legend |
| In late July, an area of unsettled weather developed south of the tip of Baja California. As it moved westward, it developed an area of low pressure and some weak convection and was classified as a depression late on the 31st. This storm was upgraded to Tropical Storm Erick on August 1st, although strong wind shear prevented the storm from intensifying further and it dissipated on the next day. Erick reported peak winds of 65 km/hr (35 knots or 40 mph) and a minimum central presure of 1005 mb. More information may be found on NCDC's 2007 Northeast Pacific Tropical Cyclone statistics page or at the NOAA National Hurricane Center. | |
June
| Tropical depression Three-E formed 465 miles south-southwest of Manzanillo, Mexico on June 11. Unfavorable conditions for development led to the weakening of the depression over the next several days and the last advisory from the National Hurricane Center was issued on June 13. More information may be found at the NOAA National Hurricane Center. |
May
The eastern North Pacific hurricane season officially begins on May 15th, generally peaks in late August/early September and concludes around the end of November. Tropical cyclone activity during May was above average with two named storms, Alvin and Barbara. Since official records began in 1949, two tropical storms have developed in May in 1984 and 1956. The long-term mean indicates that a named storm typically forms about every other May. However, this is the 8th consecutive May that a tropical cyclone has developed in the East Pacific Basin.
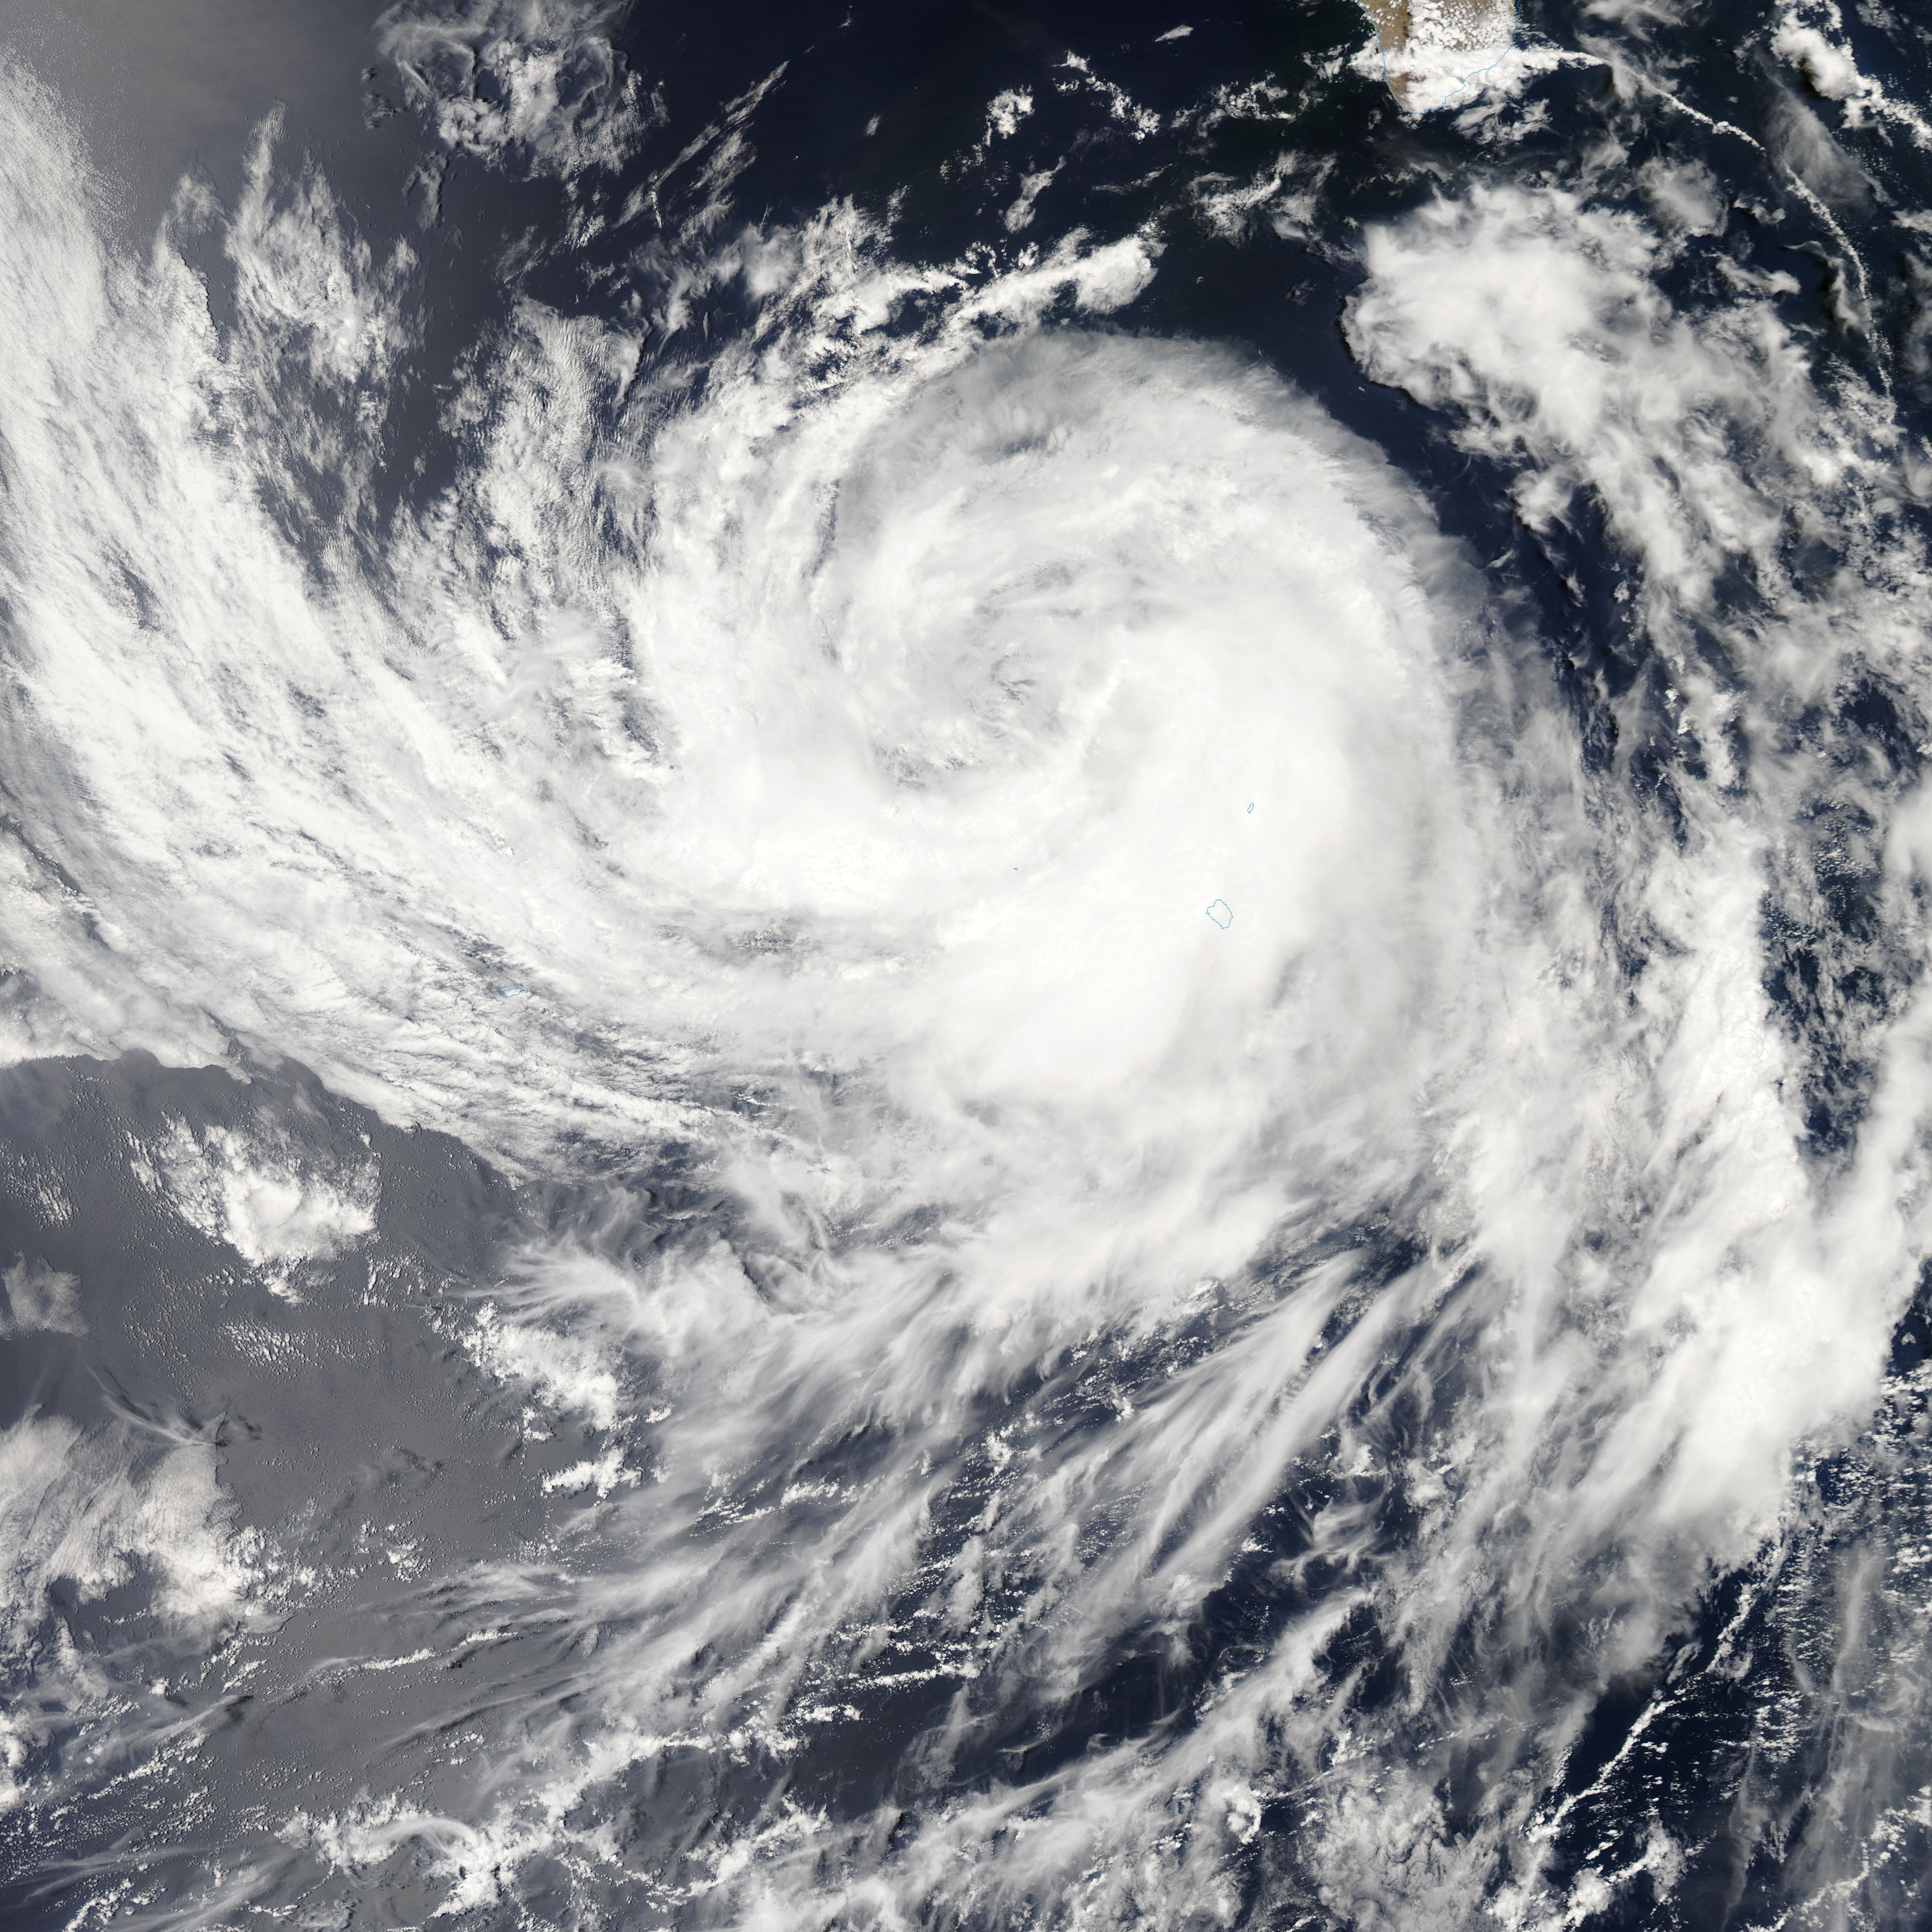
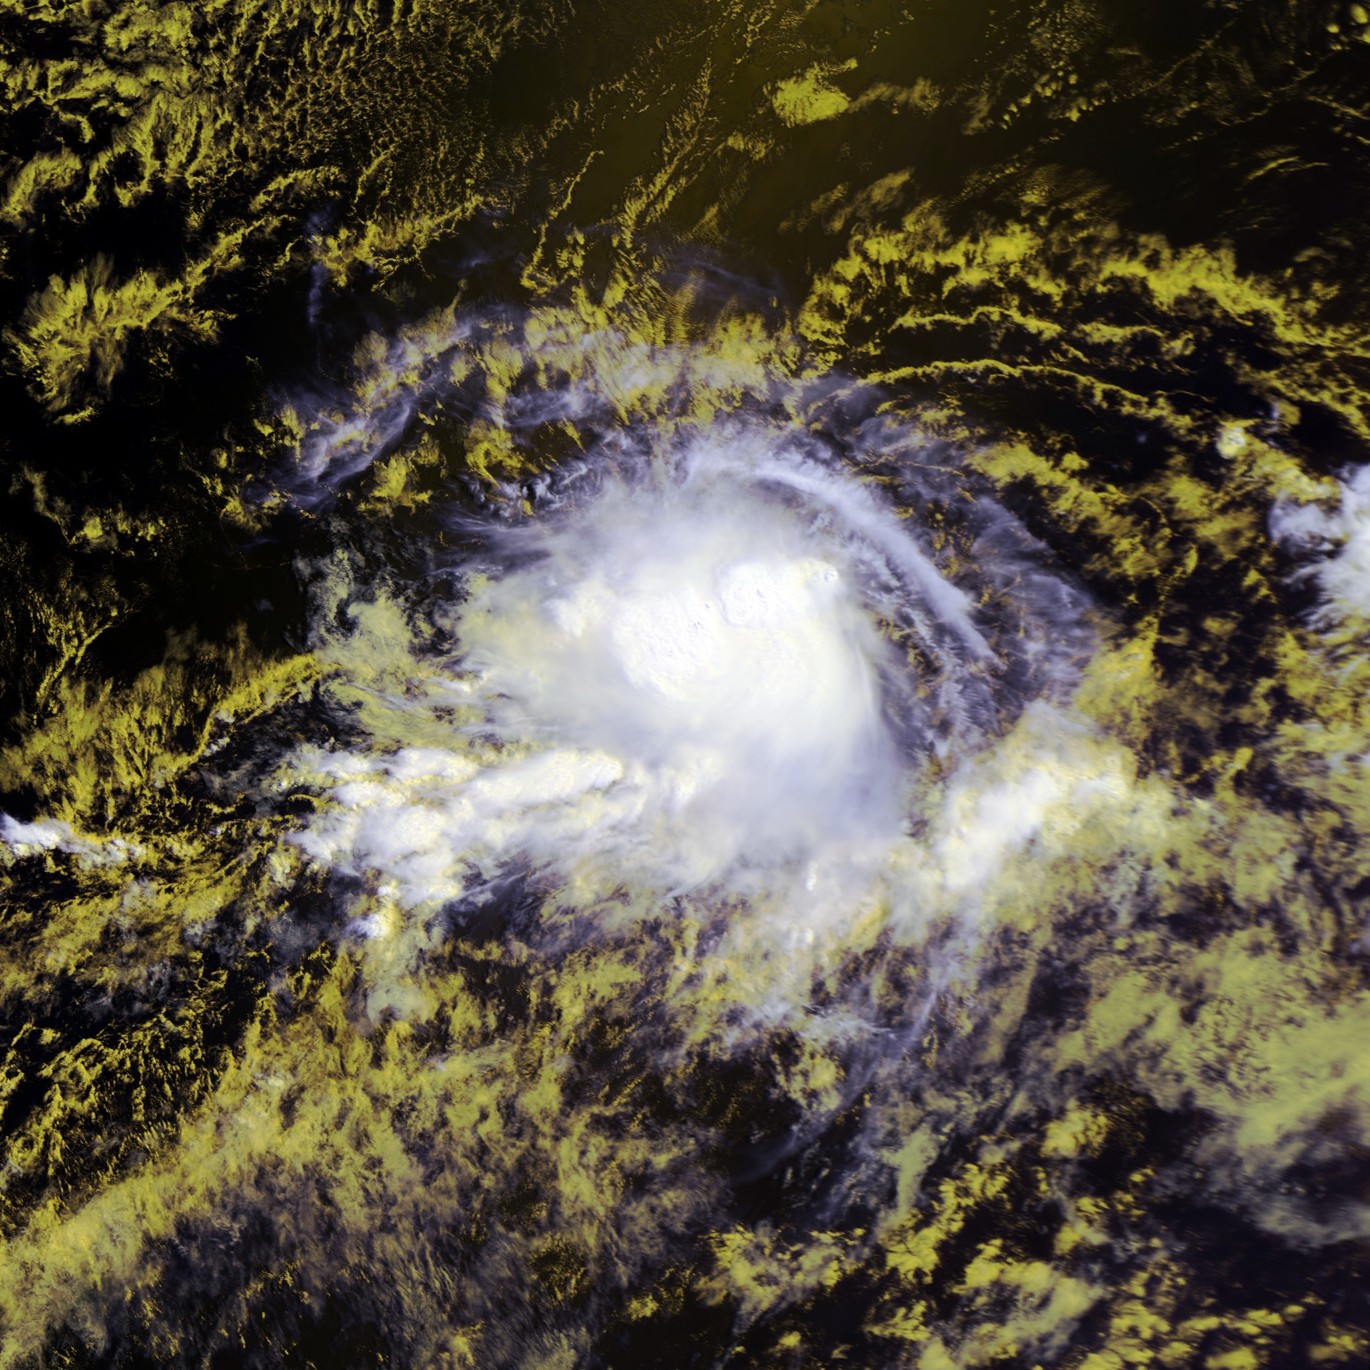
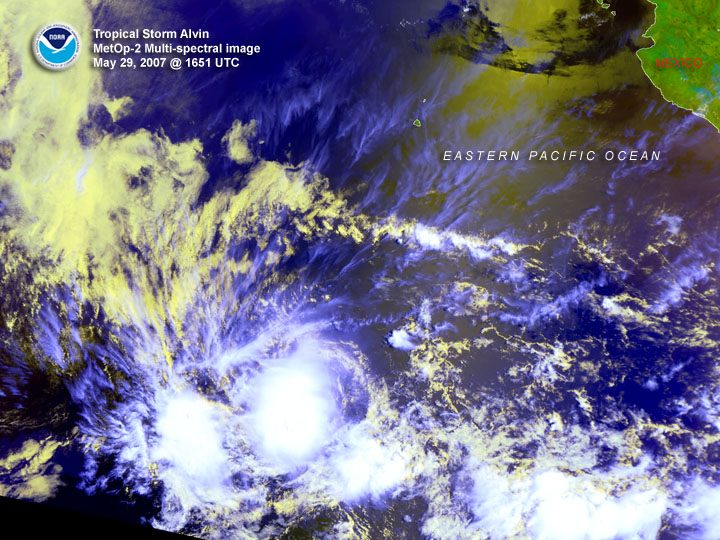 Tropical Storm Alvin Satellite Image |
 Tropical Storm Alvin Track Map |
| Alvin generated from a tropical wave that entered the East Pacific Basin on 18 May. The wave moved westward during the next several days without much development. On 24 May, a broad area of low pressure developed along the wave about 550 miles south-southwest of Manzanillo, Mexico. The system acquired enough organization to be classified as a tropical depression on 27 May, while centered about 625 miles southwest of Manzanillo. The depression became a minimal tropical storm on 29 May and moved slowly westward during its entire existence. Alvin did not intensify further and weakened to a tropical depression on 30 May. It degenerated into a remnant low on 31 May about 800 miles south-southwest of the southern tip of the Baja Peninsula. More information may be found on NCDC's 2007 Northeast Pacific Tropical Cyclone statistics page or at the NOAA National Hurricane Center. | |
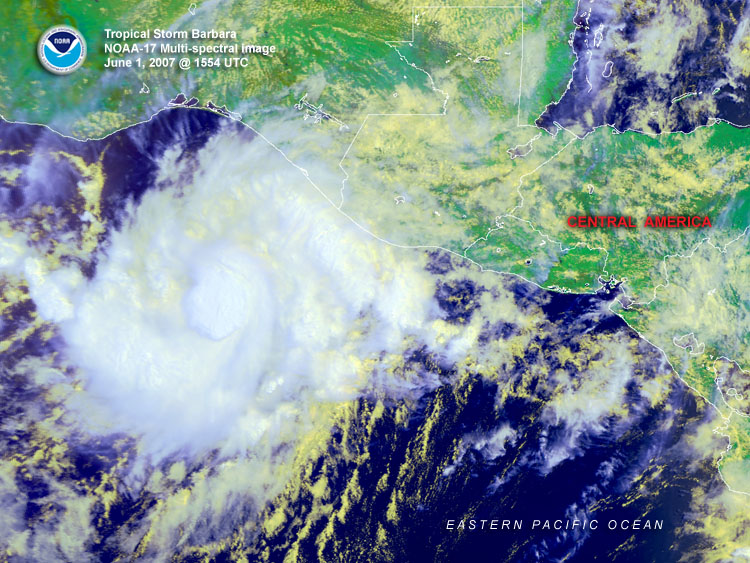 Tropical Storm Barbara Satellite Image |
 Tropical Storm Barbara Track Map |
| Barbara originated from a slow-moving tropical wave that moved off the coast of Central America on 24 May. The wave produced disorganized showers and thunderstorms during the next couple of days. On 28 May, a small area of low pressure formed a couple hundred miles southwest of the Gulf of Tehuantepec as the wave interacted with the ITCZ. Thunderstorm activity became better organized near the low and a tropical depression developed on 29 May about 125 miles southwest of Puerto Angel, Mexico. The depression moved slowly southeastward and became a tropical storm the next day. At the end of the month, Barbara was located about 200 miles south-southeast of Puerto Angel, Mexico. More information may be found on NCDC's 2007 Northeast Pacific Tropical Cyclone statistics page or at the NOAA National Hurricane Center. | |
Useful Links
|
Questions?
|
For all climate questions other than questions concerning this report, please contact the National Climatic Data Center's Climate Services Division: Climate Services Division NOAA/National Climatic Data Center 151 Patton Avenue Asheville, NC 28801-5001 fax: 828-271-4876 phone: 828-271-4800 email: questions@ncdc.noaa.gov For further information on the historical climate perspective presented in this report, contact: David Levinson NOAA/National Climatic Data Center 151 Patton Avenue Asheville, NC 28801-5001 fax: 828-271-4328 email: David.Levinson@noaa.gov |
NCDC / Climate Monitoring / Climate of 2007 / hurricanes / Help