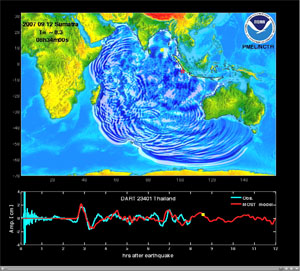
Research animations of the September 12, 2007 Indonesia tsunami propagation created with experimental runs of the MOST tsunami forecast model. DART® buoy data versus model data are shown in the lower panel of the propagation animation. The animation was created with a Mw=8.3, 300 Km x 50 Km source inverted from DART® data. Yellow squares indicate DART® buoy locations.Click the image to animate (left) or enlarge (right).
Propagation in the Indian Ocean(40.5 MB animation).
Click to animate.
Maximum wave amplitude distribution (image).
Click to see larger image.
The animation and graphic display qualitative and quantitative information about the tsunami propagation including tsunami wave interaction with ocean floor bathymetric features, and neighboring coastlines. The tsunami radiation pattern is indicated with color coded information about the maximum wave amplitude at different locations throughout the Indian Ocean.
The timer and moving yellow squares indicate time elapsed since time of the earthquake, providing an estimate of tsunami arrival time at different locations (left).