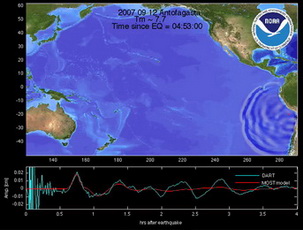
Research animations of the November 14, 2007 Chilean tsunami propagation created with experimental runs of the MOST tsunami forecast model. The animation was created with a Mw=7.5, 100 Km x 50 Km source inverted from DART® data. Triangles indicate DART® buoy locations.Click the image to animate (left) or enlarge (right).
Propagation in the Pacific Ocean(5.0 MB animation).
Click to animate.
Maximum wave amplitude distribution (image).
Click to see larger image.
The animation and graphic display qualitative and quantitative information about the tsunami propagation including tsunami wave interaction with ocean floor bathymetric features, and neighboring coastlines. The tsunami radiation pattern is indicated with color coded information about the maximum wave amplitude at different locations throughout the Pacific Ocean.


