Energy vs Data Pixel Resolution plot of all SkyView Surveys
(Click for larger image)
The table includes:
Radio surveys
GTEE 0035 MHz Radio survey
Bonn 1420 MHz Survey
HI All-Sky Continuum Survey
4850 MHz Survey/GB6
CO Galactic Plane Survey
FIRST
Dickey and Lockman HI map
NVSS
Sydney University Molonglo Sky Survey
VLA Low-frequency Sky Survey
Westerbork Northern Sky Survey
Infrared surveys
Two Micron All Sky Survey (H-Band)
Two Micron All Sky Survey (J-Band)
Two Micron All Sky Survey (K-Band)
Cosmic Background Explorer DIRBE
Cosmic Background Explorer DIRBE Annual Average Map
Cosmic Background Explorer DIRBE Zodi-Subtracted Mission Average
IRAS Sky Survey Atlas: 100 micron
IRAS Sky Survey Atlas: 12 micron
IRAS Sky Survey Atlas: 25 micron
IRAS Sky Survey Atlas: 60 micron
Improved Reprocessing of the IRAS Survey: 100
Improved Reprocessing of the IRAS Survey: 12
Improved Reprocessing of the IRAS Survey: 25
Improved Reprocessing of the IRAS Survey: 60
Schlegel, Finkbeiner and Davis 100 micron survey
Schlegel, Finkbeiner and Davis Dust Survey
Optical surveys
Original Digitized Sky Survey
First Digitized Sky Survey: Blue Plates
First Digitized Sky Survey: Red Plates
2nd Digitized Sky Survey (Blue)
2nd Digitized Sky Survey (Infrared)
2nd Digitized Sky Survey (Red)
H-alpha Full Sky Map
Near-Earth Asteriod Tracking System Archive
Sloan Digitized Sky Survey G-band
Sloan Digitzed Sky Survey I-band
Sloan Digitzed Sky Survey R-band
Sloan Digitzed Sky Survey U-band
Sloan Digitzed Sky Survey Z-band
The Southern H-Alpha Sky Survey Atlas: Continuum
The Southern H-Alpha Sky Survey Atlas: Continuum-Corrected
The Southern H-Alpha Sky Survey Atlas: H-alpha
The Southern H-Alpha Sky Survey Atlas: Smoothed
Ultraviolet surveys
Extreme Ultraviolet Explorer: 83 A
Extreme Ultraviolet Explorer: 171 A
Extreme Ultraviolet Explorer: 405 A
Extreme Ultraviolet Explorer: 555 A
ROSAT Wide Field Camera: F1
ROSAT Wide Field Camera: F2
X-ray surveys
Swift BAT All-Sky Survey: Flux and Significance
GRANAT/SIGMA Flux
GRANAT/SIGMA
HEAO 1A
ROSAT High Resolution Image Pointed Observations Mosaic: Intensity
INTEGRAL/Spectral Imager Galactic Center Survey
PSPC summed pointed observations, 1 degree cutoff, intensity
PSPC summed pointed observations, 2 degree cutoff, counts
PSPC summed pointed observations, 2 degree cutoff, exposure
PSPC summed pointed observations, 2 degree cutoff, intensity
ROSAT All-Sky X-ray Survey Broad Band
ROSAT All-Sky X-ray Survey Hard Band
ROSAT All-Sky X-ray Survey Soft Band
ROSAT All-Sky X-ray Background Survey: Bands 1
ROSAT All-Sky X-ray Background Survey: Bands 2
ROSAT All-Sky X-ray Background Survey: Bands 3
ROSAT All-Sky X-ray Background Survey: Bands 4
ROSAT All-Sky X-ray Background Survey: Bands 5
ROSAT All-Sky X-ray Background Survey: Bands 6
ROSAT All-Sky X-ray Background Survey: Bands 7
ROSAT All-Sky Broad Band Intensity
ROSAT All-Sky Hard Band Intensity
ROSAT All-Sky Broad Band Intensity
RXTE Allsky 3-20keV Significance
RXTE Allsky 3-8keV Significance
RXTE Allsky 8-20keV Significance
Gamma ray surveys
CGRO Compton Telescope: 3 channel data
Energetic Gamma-Ray Event Telescope: 10 channel data
Energetic Gamma-Ray Event Telescope: Hard
Energetic Gamma-Ray Event Telescope: Soft
| Provenance | Max Planck Institute for Radio Astronomy, generated by P. Reich and W. Reich |
|---|---|
| Copyright | Max-Planck-Institut fur Radioastronomie (permission for educational and private non-commercial use granted without further request) |
| Regime | Radio |
| NSurvey | 1 |
| Frequency | 1420 MHz Continuum |
| Coverage | Complete above 16 degrees south Equatorial latitude |
| PixelScale | 0.25 deg/pixel |
| PixelUnits | millikelvins |
| Resolution | 34' |
| CoordinateSystem | Equatorial |
| Equinox | 1950 |
| Projection | Rectangular (CAR) |
| Epoch | ca. 1980 |
| Reference | Reich, 1982, A&AS48, 219. Reich and Reich, 1986, A&AS63, 205. |
| Provenance | Max Planck Institute for Radio Astronomy, generated by Glyn Haslam |
|---|---|
| Copyright | Max-Planck-Institut fur Radioastronomie (permission for educational and private non-commercial use granted without further request) |
| Regime | Radio |
| NSurvey | 1 |
| Frequency | 408 MHz |
| Coverage | All-sky |
| PixelScale | 0.3515 degrees/pixel |
| PixelUnits | Kelvins |
| Resolution | 0.85 degrees |
| CoordinateSystem | Galactic |
| Projection | Rectangular (CAR) |
| Reference | Haslam et al., 1982,A&AS47, 1. |
| Provenance | NRAO, generated by J.J. Condon, J.J. Broderick and G.A. Seielstad, Douglas, K., and Gregory, P.C. |
|---|---|
| Copyright | Used by permission of J.J. Condon |
| Regime | Radio |
| NSurvey | 2 |
| Frequency | 4850 MHz continuum |
| Coverage | RA: 0d - 360d, DEC: -88d to +75d |
| PixelScale | 0.0167deg/pixel (PMN), and 0.0111 deg/pixel ((86+87) GB) |
| PixelUnits | janskies/beam (ca. 200,000 beams/steradian) |
| Resolution | 7' FWHM |
| CoordinateSystem | Equatorial |
| Equinox | 1950 |
| Epoch | ca. 1990 |
| Projection | Orthographic (SIN) |
| Reference | Condon, et al., 1991, AJ 102, 2041; 1993, AJ 106, 1095; 1994, AJ 107, 1829 |
Users should be aware that both the angular resolution and the sensitivity varies from region to region in the velocity-integrated map. The component surveys were integrated individually using clipping or moment masking in order to display nearly all statistically significant emission but little noise above a level of ~1.5 K km/s. See the reference below and the Millimeter-Wave Group site for more details
| Provenance | Data taken by two nearly-identical 1.2 m telescopes in Cambridge, MA and on Cerro Tololo, Chile combined into a complete survey of the Milky Way with CO integrated over all velocities. |
|---|---|
| Copyright | Permission is granted for publication and reproduction of this material for research or educational purposes so long as the reference (see below) is included. |
| Regime | Radio |
| NSurvey | 1 |
| Frequency | 115 GHz |
| Coverage | All galactic longitudes, irregular bands between -35 and +35 latitudes |
| PixelScale | 0.125d/pixel |
| PixelUnits | intensities are velocity-integrated main beam brightness temperature, in units of K km/s |
| CoordinateSystem | Galactic |
| Projection | Rectangular |
| Epoch | 2001 |
| Reference | Dame, T. M., Hartmann, Dap, Thaddeus, P., ApJ, 2001 |
These FIRST data have been retrieved from the FIRST FTP archive at the Space Telescope Science Institute.
The FIRST survey is included on the SkyView High Resolution Radio Coverage map. This map shows coverage on an Aitoff projection of the sky in equatorial coordinates.
| Provenance | The FIRST project team: R.J. Becker, D.H. Helfand, R.L. White M.D. Gregg. S.A. Laurent-Muehleisen. |
|---|---|
| Copyright |
1994, University of California.
Permission is granted for publication and reproduction of this
material for scholarly, educational, and private non-commercial
use. Inquiries for potential commercial uses should be
addressed to:
              Robert Becker,
              Physics Dept,
              University of California,
              Davis, CA  95616
|
| Regime | Radio |
| NSurvey | 1 |
| Frequency | 1.4 GHz Continuum |
| Coverage | Eventually will cover entire North Galactic Polar region (about 10,000 square degrees). See Status of FIRST Survey Observations |
| PixelScale | 1.8"/pixel |
| PixelUnits | Janskies/beam |
| Resolution | 5" |
| Coordinates | Equatorial |
| Equinox | 2000 |
| Projection | Orthographic |
| Epoch | 1994 - 1996 |
| Reference | FIRST home page |
The original 287x101 tiles had only 1 pixel overlap. To allow higher order resampling, the data were retiled into two hemisphere files of 1726x600 pixels with an overlap of 10 pixels.
The southernmost tiles were only 287x100 pixels. We assumed that bottom row of these tiles (as compared with the others) was truncated.
| Copyright | Public domain |
|---|---|
| Regime | Radio |
| Frequency | 34.5 MHz |
| Coverage | Complete between -50 and +70 degrees |
| PixelScale | 0.105 x 0.20 degrees |
| PixelUnits | Kelvins |
| Resolution | 26' x 42'/cos(dec-14) |
| Coordinates | Equatorial |
| Equinox | 1950 |
| Projection | Rectangular |
| Epoch | 1990 |
| Reference | K.S. Dwarakanath and N. Udaya Shankar 1990, J. Astrophys. Astr., 11 323. |
| Provenance | provided by S. Snowden from data by Dickey and Lockman |
|---|---|
| Regime | Radio |
| Copyright | Public domain |
| Frequency | 1420 MHz line survey |
| PixelScale | 40' |
| PixelUnit | atoms/cm^2 |
| Resolution | 1 degree |
| Coordinates | Galactic |
| Projection | Aitoff |
| Epoch | ca. 1980 |
| Reference | Dickey and Lockman, ARAA 28, 1990, p215. |
Observations for the 1.4 GHz NRAO VLA Sky Survey (NVSS) began in 1993 September and should cover the sky north of -40 deg declination (82% of the celestial sphere) before the end of 1996. The principal data products will be:
The NVSS survey is included on the SkyView High Resolution Radio Coverage map. This map shows coverage on an Aitoff projection of the sky in equatorial coordinates.
| Provenance | National Radio Astronomy Observatory. The NVSS project includes J. J. Condon, W. D. Cotton, E. W. Greisen, Q. F. Yin, R. A. Perley (NRAO), and J. J. Broderick (VPI). |
|---|---|
| Copyright |
Copyright 1994,
Associated Universities, Inc.,
National Radio Astronomy Observatory
Permission is granted for publication and reproduction of this material for scholarly, educational, and private non-commerical use. 1994 Associated Universities, Inc. Inquiries for potential commercial uses should be addressed to: NRAO 520 Edgemont Road Charlottesville, VA 22903-2475 |
| Regime | Radio |
| NSurvey | 1 |
| Frequency | 1.4 GHz Continuum |
| Coverage | Declinations above -40 degrees |
| PixelScale | 15"/pixel |
| PixelUnits | Janskies/beam |
| Resolution | 45" |
| Coordinates | Equatorial |
| Equinox | 2000 |
| Projection | Orthographic |
| Epoch | ca. 1994-1996 |
| Reference | NVSS home page or the NVSS preprint |
The survey was completed in 2007. Please note that the images still contain some telescope artifacts. Images can also be obtained from the SUMSS Postage Stamp Server.
The SUMSS is intended to complement the NRAO-VLA Sky Survey (NVSS) which covered the sky between +90 and -40 deg declination, at a frequency of 1400MHz.
| Provenance | The SUMSS project team, University of Sydney |
|---|---|
| Copyright |
1997-2000 School of Physics, The University of Sydney. Permission is granted for publication and reproduction of this material for scholarly, educational, and private non-commerical use. Inquiries for potential commercial uses should be addressed to: Dr. R.W. Hunstead or Dr. E.M. Sadler Astrophysics Department, A29 University of Sydney Sydney, NSW 2006 Australia email: sumss@physics.usyd.edu.au |
| Regime | Radio |
| NSurvey | 1 |
| Frequency | 843 MHz |
| Coverage | Covers mostly the entire sky south of declination -30°. See the coverage map for current status. |
| PixelScale | 11" x 11" cosec (|Dec|). Default scale for retrieval is 11" x 11" |
| PixelUnits | Janskys/beam |
| Resolution | 45" (RA) x 45" cosec (|Dec|) |
| Coordinates | Equatorial |
| Equinox | 2000 |
| Projection | Orthographic (SIN) representation of the NCP projection plane |
| Epoch | ca. 1997 - present |
| Reference | SUMSS home page |
| Provenance | VLSS Team: R.A. Perley, J.J. Condon, W.D. Cotton (NRAO); A.S. Cohen, W.M. Lane (NRC/NRL), N.E. Kassim, T.J.W. Lazio (NRL), W.C. Erickson (UMd) |
|---|---|
| Copyright | |
| Regime | Radio |
| NSurvey | 1 |
| Frequency | 74 MHz |
| Coverage | Declinations above -30 degrees |
| PixelScale | 25"/pixel |
| PixelUnits | Janskies/beam |
| Resolution | 80" |
| Coordinates | Equatorial |
| Equinox | 2000 |
| Projection | Orthographic (Sin) |
| Epoch | ca. 2006 |
| Reference | VLSS home page or the VLSS proposal |
Further information on the survey including links to catalogs derived from the survey is available at the WENSS web site.
The WENSS survey is included on the SkyView High Resolution Radio Coverage map. This map shows coverage on an Aitoff projection of the sky in equatorial coordinates.
| Provenance | WENSS Team. Data downloaded from WENSS FTP site 1999-03-18. The WENSS project is a collaboration between the Netherlands Foundation for Research in Astronomy (NFRA/ASTRON) and the Leiden Observatory. |
|---|---|
| Copyright | WENSS team. Anyone using data from the WENSS database in publications is asked to acknowledge this. |
| Regime | Radio |
| NSurvey | 1 |
| Frequency | 325 MHz Continuum |
| Coverage | North of declination +30. |
| PixelScale | 21"/pixel |
| PixelUnits | Janskies/beam |
| Resolution | 54" cosec(declination) |
| Coordinates | Equatorial |
| Equinox | 1950 |
| Projection | Orthographic |
| Epoch | ca. 1991-1996 |
| Reference | Rengelink et al., 1997, A&A Supp. 124, p 259. |
2MASS images and other data products can be obtained at the NASA/IPAC Infrared Science Archive
| Provenance | The Two Micron All Sky Survey is a joint project of the University of Massachusetts and the Infrared Processing and Analysis Center, funded by the National Aeronautics and Space Administration and the National Science Foundation. |
|---|---|
| Copyright |
Researchers are asked to include the following
acknowledgment in any published material that
makes use of data products from the
Two Micron All Sky Survey (2MASS):
"This publication makes use of data products from the Two Micron All Sky Survey, which is a joint project of the University of Massachusetts and the Infrared Processing and Analysis Center, funded by the National Aeronautics and Space Administration and the National Science Foundation." |
| Regime | Infrared |
| NSurvey | 3 |
| Frequency | K=138 THz (2.17 microns), H=180 THz (1.65 microns), J=240 THz (1.25 microns) |
| Coverage | Allsky |
| PixelScale | 1"/pixel |
| PixelUnits | |
| Resolution | 1" |
| Coordinates | Equatorial |
| Equinox | 2000 |
| Projection | Orthographic (SIN) |
| Epoch | 1997 - 2002 |
| Reference | 2MASS web site |
2MASS images and other data products can be obtained at the NASA/IPAC Infrared Science Archive
| Provenance | The Two Micron All Sky Survey is a joint project of the University of Massachusetts and the Infrared Processing and Analysis Center, funded by the National Aeronautics and Space Administration and the National Science Foundation. |
|---|---|
| Copyright |
Researchers are asked to include the following acknowledgment in any published material that makes use of data products from the
Two Micron All Sky Survey (2MASS):
"This publication makes use of data products from the Two Micron All Sky Survey, which is a joint project of the University of Massachusetts and the Infrared Processing and Analysis Center, funded by the National Aeronautics and Space Administration and the National Science Foundation." |
| Regime | Infrared |
| NSurvey | 3 |
| Frequency | K=138 THz (2.17 microns), H=180 THz (1.65 microns), J=240 THz (1.25 microns) |
| Coverage | Allsky |
| PixelScale | 1"/pixel |
| PixelUnits | |
| Resolution | 1" |
| CoordinateSystem | Equatorial |
| Equinox | 2000 |
| Projection | Orthographic (SIN) |
| Epoch | 1997 - 2002 |
| Reference | 2MASS web site |
Detailed descriptions of the DIRBE, the data processing, and the data products are given in an Explanatory Supplement. A Small Source Spectral Energy Distribution Browser can be used to assess the visibility of an unresolved or small extended source in the DIRBE data and see its spectral energy distribution. As noted in section 5.6.6 of the Explanatory Supplement, the DIRBE Time-ordered Data are required to derive definitive point source fluxes.
These maps provide an estimate of the infrared intensity at each pixel and wavelength band based on an interpolation of the observations made at various times at solar elongations close to 90°.
These COBE DIRBE maps are a combination original ten band passes with the following wavelengths:
The default two dimensional array uses Band 8 (100 µm).
The COBE DIRBE/Annual Average Maps (AAM) is the cumulative weighted average of the photometry. This average is calculated using the weighted number of observations from each Weekly Averaged Map ( WtNumObs from the Weekly Averaged Map) as the weight, such that annual_average =sum( weekly_average * weekly_weight )/ sum( weekly_weight )
COBE DIRBE/Zodi-Subtracted Mission Average (ZSMA) Skymap represents the extra-Solar system sky brightness. It is the average residual map that results after the modelled interplanetary dust (IPD) signal is subtracted from each of the DIRBE Weekly Skymaps from the cryogenic mission. Individual weekly residual maps can be reconstructed from the data supplied in the DIRBE Sky and Zodi Atlas (DSZA).
| Provenance | COBE Team |
|---|---|
| Copyright | Public Domain |
| Regime | Infrared |
| NSurvey | 1 (10 bands) |
| Frequency | 1.25-240 THz |
| Coverage | All-sky |
| Scale | 0.32 deg/pix |
| Units | MJy/sr |
| Resolution | ca. .75 deg |
| Coordinates | Ecliptic |
| Projection | CobeCube (CSC) |
| Equinox | 2000 |
| Epoch | 1989-1990 |
| Reference | COBE Diffuse Infrared Background Experiment (DIRBE) Explanatory Supplement ed. M.G. Hauser, T. Kelsall, D. Leisawitz, and J. Weiland COBE Ref. Pub. No. 97-A (Greenbelt, MD: NASA/GSFC) available in electronic form (in a slightly more up-to-date version) from the COBE Web page. |
The data are distributed in sets of 430 maps. Each map covers approximately 12.5x12.5 degrees, and the map centers are offset by 5 degrees so that there is a 2.5 degree overlap. IPAC has processed to a uniform standard so that excellent mosaics of the maps can be made. Users should be cautious of data in saturated regions. Known problems in the analysis mean that data values are unlikely to be correct. Note that IPAC has optimized the processing of these data for features of 5' or more although the resolution of the data is closer to the 1.5' pixel size.
There are occasional pixels in the IRAS maps which are given as NULL values. Unless these are explicitly trapped by user software, these data will appear as large negative values. SkyView ignores these pixels when determining the color scale to display an image.
Essentially the entire sky is covered by the survey. However there are a few regions not surveyed and the data values in these regions are suspect. These are given to users as delivered from IPAC.
| Provenance | NASA IPAC/Jet Propulsion Laboratory |
|---|---|
| Copyright | Public Domain |
| Regime | Infrared |
| NSurvey | 4 |
| Frequency | 3-30 THz |
| Coverage | All-sky |
| Scale | 0.025 deg/pix |
| Units | MJy/sr |
| Resolution | 2' |
| Coordinates | Equatorial |
| Projection | Gnomonic(TAN) |
| Equinox | 1950 |
| Epoch | 1983 |
| Reference | Wheelock, et al., 1991, IRAS Sky Survey Atlas Explanatory Supplement.. |
More information about the IRIS dataset is available at the IRIS Web site whence most of the preceding description came.
| Provenance |
Original IRAS data: NASA/JPL IPAC, IRIS Reprocessing: Canadian Institute for Theoretical Astrophysics/Institut d'Astrophysique Spatiale See the IRIS Web site. |
|---|---|
| Copyright | Public |
| Regime | Infrared |
| NSurvey | 4 |
| Frequency | 3-30 THz |
| Coverage | All-sky |
| Scale | 0.025 deg/pix |
| Units | MJy/sr |
| Resolution | 2' |
| Coordinates | Equatorial |
| Projection | Gnomonic(TAN) |
| Equinox | 1950 |
| Epoch | 1983 |
| Reference |
2005ApJS..157..302M M. Miville-Deschenes and G. Lagache, IRIS: A New Generation of IRAS Maps, Ap.J.Supplement 157, 302, 2005. |
| Provenance | David J. Schlegel, Douglas P. Finkbeiner and Marc Davis, Princeton University and University of California, Berkeley |
|---|---|
| Copyright | Public domain |
| Regime | Infrared |
| Frequency | 100 ?m |
| Coverage | All-sky |
| PixelScale | 2.4'/pixel |
| PixelUnits | MegaJanskies per steradian (100 micron map) and E(B-V) reddening (Dust map) |
| Resolution | 6' full-width half-maximum |
| Coordinates | Galactic |
| Projection | Zenith Equal Area |
| Equinox | 2000 |
| Epoch | 1983 |
| Reference | David J. Schlegel, Douglas P. Finkbeiner, & Marc Davis , 1998, Maps of Dust Infrared Emission for Use in Estimation of Reddening and Cosmic Microwave Background Radiation Foregrounds . See also Dirbe/IRAS Dust Maps |
The following data are included:
| Provenance | Data taken by ROE and AAO, CalTech, Compression and distribution by Space Telescope Science Institute. |
|---|---|
| Copyright |
STScI, ROE, AAO, UK-PPARC, CalTech, National Geographic Society.
Full copyright notice |
| Regime | Optical |
| NSurvey | 1 |
| Frequency | 600 THz (J or E band images with a few exceptions) |
| Coverage | All-sky |
| Scale | 1.7" |
| Units | Scaled densities |
| Resolution | Depends on plate. Typically 2" |
| Coordinates | Equatorial |
| Projection | Schmidt (distorted Tangent plane projection) |
| Equinox | 2000 |
| Epoch | 1945-1955 north, 1980-1990 south |
| Reference | Lasker, et al., 1990, A.J. 99 |
| Provenance | Data taken by CalTech, Compression and distribution by Space Telescope Science Institute. |
|---|---|
| Copyright |
STScI, CalTech, National Geographic Society.
Full copyright notice |
| Regime | Optical |
| NSurvey | 1 |
| Frequency | 600 THz |
| Coverage | North of -30 degrees declination |
| Scale | 1.7" |
| Units | Scaled densities |
| Resolution | Depends on plate. Typically 2" |
| Coordinates | Equatorial |
| Projection | Schmidt (distorted Tangent plane projection) |
| Equinox | 2000 |
| Epoch | 1950-1955 |
| Reference | Lasker, et al., 1990, A.J. 99 |
| Provenance | Data taken by CalTech Compression and distribution by Space Telescope Science Institute. |
|---|---|
| Copyright |
CalTech, National Geographic Society.
Full copyright notice |
| Regime | Optical |
| NSurvey | 1 |
| Frequency | 600 THz |
| Coverage | North of -30 degrees declination |
| Scale | 1.7" |
| Units | Scaled densities |
| Resolution | Depends on plate. Typically 2" |
| Coordinates | Equatorial |
| Projection | Schmidt (distorted Tangent plane projection) |
| Equinox | 2000 |
| Epoch | 1945-1955 |
| Reference | Lasker, et al., 1990, A.J. 99 |
The native projection of these data is described as a high-order polynomial distortion of a gnomonic projection using the same terms as the DSS.
| Provenance | Data taken by ROE, AAO, and CalTech, Compression and distribution by Space Telescope Science Institute. |
|---|---|
| Copyright | There are multiple copyright holders depending upon the source plate or plates. See full copyright notices The coverage link below describes the coverage for each element of the surveys when the original plate used is not included in the SkyView files. |
| Regime | Optical |
| NSurvey | 2 |
| Frequency | 450-600 THz |
| Coverage | All-sky, but some data not yet be processed. |
| PixelScale | 1" in the north 1.7" in the south |
| PixelUnits | Pixel values are given as scaled densities |
| Resolution | Depends on plate. Typically better than 2". |
| Coordinates | Equatorial |
| Projection | Schmidt |
| Equinox | 2000 |
| Epoch | 1984-1999 |
| Reference | Some information on the DSS2 is given in McLean, 2000, The Second Generation Guide Star Catalog. |
The native projection of these data is described as a high-order polynomial distortion of a gnomonic projection using the same terms as the DSS.
SkyView has a copy of the compressed images which cover the entire sky. In previous versions of SkyView (prior to July 2007), this survey was served as a remote survey and data was retrieved in tiles from the ST ScI web site. Image generation using the local copy should be much faster at the SkyView web site. However data from this survey is not currently cached when it is used in the SkyView-in-a-Jar application so that data will be downloaded from the SkyView web site whenever an image is requested. Future updates to SkyView-in-a-Jar should address this caching issue.
| Provenance | Data taken by ROE, AAO, and CalTech, Compression and distribution by Space Telescope Science Institute. |
|---|---|
| Copyright | There are multiple copyright holders depending upon the source plate or plates. See full copyright notices The coverage link below describes the coverage for each element of the surveys when the original plate used is not included in the SkyView files. |
| Regime | Optical |
| NSurvey | 2 |
| Frequency | 450-600 THz |
| Coverage | All-sky, but some data not yet be processed. |
| PixelScale | 1" |
| PixelUnits | Pixel values are given as scaled densities |
| Resolution | Depends on plate. Typically better than 2". |
| Coordinates | Equatorial |
| Projection | Schmidt |
| Equinox | 2000 |
| Epoch | 1984-1999 |
| Reference | Some information on the DSS2 is given in McLean, 2000, The Second Generation Guide Star Catalog. |
The native projection of these data is described as a high-order polynomial distortion of a gnomonic projection using the same terms as the DSS.
| Provenance | Data taken by ROE, AAO, and CalTech, Compression and distribution by Space Telescope Science Institute. |
|---|---|
| Copyright | There are multiple copyright holders depending upon the source plate or plates. See full copyright notices The coverage link below describes the coverage for each element of the surveys when the original plate used is not included in the SkyView files. |
| Regime | Optical |
| NSurvey | 2 |
| Frequency | 450-600 THz |
| Coverage | All-sky, but some data not yet be processed. |
| PixelScale | 1" |
| PixelUnits | Pixel values are given as scaled densities |
| Resolution | Depends on plate. Typically better than 2". |
| Coordinates | Equatorial |
| Projection | Schmidt |
| Equinox | 2000 |
| Epoch | 1984-1999 |
| Reference | Some information on the DSS2 is given in McLean, 2000, The Second Generation Guide Star Catalog. |
| Copyright | Public domain |
|---|---|
| Regime | Optical |
| Frequency | 6563 ? |
| Coverage | All-sky |
| PixelScale | 2.5' |
| PixelUnits | Rayleighs (R) |
| Resolution | 6' FWHM |
| Coordinates | Galactic |
| Equinox | 2000 |
| Projection | Rectangular |
| Epoch | 1997-2000 |
| Reference | "A Full-Sky H-alpha Template for Microwave Foreground Prediction" Douglas P. Finkbeiner 2003. This paper may be downloaded from astro-ph. |
Unlike most SkyView surveys, the NEAT data are extremely irregular in their spatial distribution. SkyView's algorithms for mosaicking images together to form large images are not adequate for the NEAT data, so mosaicking is surpressed. Only data within a single NEAT image will be displayed. The system attempts to find the most recent image within which has a offset in both RA and Dec of less than 0.8 degrees. If no such image is found, then an image with the minimum offset is returned, or the search may fail altogether if there are no nearby plates. The NEAT telescope uses an array of 4 CCDs. The backgrounds of the CCDs may differ significantly.
The NEAT survey covers approximately 30% of the sky. Extreme southern and low-Galactic latitude regions are unsurveyed. Coverage is otherwise particularly dense in the ecliptic plane.
NEAT data consists primarily of groups of three images taken with separations of 20 minutes and almost identical positions. SkyView will normally return the last of a 'triplet'. The SkyMorph site can be used to display an overlay of triplets to look for targets which moved during the interval between images.
A catalog of objects detected in the NEAT/SkyMorph pages is accessible through the SkyMorph pages. 'Light-curves' from all images during which an object was in the NEAT field of view can also be generated.
The NEAT data values are in arbitrary density units. To enhance the display data are transformed such that all pixels below the median values are scaled linearly to values 0-20, while all pixels above the median are shifted (but not scaled) to values greater than 20.
| Provenance | NEAT project |
|---|---|
| Copyright | See the JPL Image Use Policy |
| Regime | Optical |
| NSurvey | 1 |
| Frequency | 600 THz |
| Coverage | Patches of the sky, approximately 30% coverage |
| PixelScale | 1.42" |
| PixelUnits | |
| Resolution | Depends on image. Typically 1.5" |
| Coordinates | Equatorial |
| Equinox | 2000 |
| Projection | Radially distorted gnomonic |
| Epoch | 1997-1999 |
| Reference | href=http://www.sdss.org> SDSS Web site |
| Provenance | Sloan Digital Sky Survey Team |
|---|---|
| Copyright | See Sloan usage document for distribution rights and acknowledgements. |
| Regime | Optical |
| NSurvey | 5 |
| Frequency | 300-750 THz |
| Coverage | 9,583 square degrees. The SDDS site provides coverage maps |
| PixelScale | 0.4" |
| PixelUnits | ADUs |
| Resolution | 1" |
| Coordinates | Equatorial |
| Projection | Tangent |
| Epoch | ca. 2000 |
| Reference | Sloan Digital Sky Survey web site |
| Provenance | John E. Gaustad (Swarthmore College), Peter R. McCullough (University of Illinois), Wayne Rosing (Las Cumbres Observatory), and Dave Van Buren (Extrasolar Research Corporation) |
|---|---|
| Copyright | Las Cumbres Observatory, Inc. See the Acknowledgement/Guidelines for Use of Images |
| Regime | Optical |
| Frequency | 6563 ? |
| Coverage | All-sky south of 15 |
| PixelScale | 0.79'/pixel |
| PixelUnits | decirayleighs (dR) or 105/4pi photons/cm2/s/sr |
| CoordinateSystem | Equatorial |
| Projection | Gnomonic |
| Equinox | 2000 |
| Epoch | 1997-2000 |
| Reference | "A Robotic Wide-Angle H-alpha Survey of the Southern Sky" by J.E. Gaustad, P.R. McCullough, W. Rosing, and D. Van Buren 2001, PASP, 113, 1326. This paper may be downloaded in PDF (2.5 Mb) or Postscript (12.7 Mb) format. |
The data currently in SkyView is direct from the Center for EUVE.
| Provenance | Center for Extreme UV Astronomy, UCB |
|---|---|
| Regime | Ultraviolet |
| Copyright | Public domain |
| Frequency | 5 to 50 PHz (83, 171, 405, 555 Angstroms) |
| PixelScale | 0.025 degrees/pixel |
| PixelUnits | counts |
| Resolution | ca. 2' |
| CoordinateSystem | Equatorial |
| Projection | Gnomonic/Tan |
| Equinox | 2000 |
| Epoch | 1991-1993 |
| Reference | Welsh et al, 1990, Opt.Eng. 29, 752. Bowyer and Malina, 1991, in Extreme Ultraviolet Astronomy, 397. |
| Provenance | University of Leicester |
|---|---|
| Copyright | University of Leicester used by permission (no restrictions on not for profit use) |
| Regime | Ultraviolet |
| NSurvey | 2 |
| Frequency | 20 and 30 PHz (100 and 130 Angstroms) |
| Coverage | all-sky |
| PixelScale | 1 arcminute/pixel |
| PixelUnit | Counts |
| Resolution | 30 arcminutes |
| Coordinates | Ecliptic |
| Projection | Gnomonic |
| Reference |
| Provenance | University of Leicester |
|---|---|
| Copyright | University of Leicester used by permission (no restrictions on not for profit use) |
| Regime | Ultraviolet |
| NSurvey | 2 |
| Frequency | 20 and 30 PHz (100 and 130 Angstroms) |
| Coverage | all-sky |
| PixelScale | 1 arcminute/pixel |
| PixelUnit | Counts |
| Resolution | 30 arcminutes |
| Coordinates | Ecliptic |
| Projection | Gnomonic (Tan) |
| Reference |
BAT is sensitive in the energy range 14-195 keV. The data from the first 9 months of the survey is divided into 4 energy channels: 14-24, 24-50, 50-100, and 100-195 keV. Each of these is represented as separate survey, and an averaged survey over all bands is also given.
The all sky maps are presented in two forms, the significance maps and the flux maps. The significance maps are the count rate divided by the noise (sigma RMS) in a region of the map around the position. The noise is variable across the sky due to variable exposure and systematic noise. The noise is Gaussian and and the significances can be interpreted with the usual Gaussian probabilities. A threshold of 4.8 sigma for the blind detection of sources in the BAT survey corresponds to about 1 false detection on the whole sky.
The BAT flux map is scaled from the Crab rate in the survey and normalized to an assumed Crab spectrum of 10.4 E-2.15 photons.cm2/sec/keV. Due to the large number of randomly distributed gamma-ray burst pointings that contribute to any point in the image, this is an accurate characterization for the whole sky. The 4.8 sigma threshold in the 9-month survey covers 80% of the sky at flux threshold of 3.5x10⁻¹¹ ergs/cm2/s in the 14-195 keV band and covers 1/3 of the sky near the ecliptic poles at 2.5x10⁻¹¹ ergs/cm2/s.
| Provenance | NASA BAT Team |
|---|---|
| Copyright | Public domain |
| Regime | X-ray |
| NSurvey | 10 |
| Frequency | 14-24, 24-50, 50-100m 100-195 keV |
| Coverage | All-sky |
| PixelScale | 5' |
| PixelUnits | Statistical significance or Flux |
| Resolution | 10' |
| Coordinates | Galactic |
| Equinox | |
| Projection | Zenital Equal Area |
| Epoch | 2007 |
| Reference | Tueller et al, 2008 |
SIGMA discovered numerious interesting hard X-ray sources including GRS 1758-258, which is located only 40' from bright soft X-ray source GX 5-1. It detected hard X-ray flux from X-ray burster A1742-294, which is very near to bright black hole binary 1E1740.7-2942. SIGMA set an upper limit on the hard X-ray flux of from the central supermassive black hole in our Galaxy.
During the period 1990-1998 SIGMA observed more that one quarter of the sky with sensitivity better than 100 mCrab. The Galactic Center region had the deepest exposure ( approximately 9 million sec), with the sensitivity to a source discovery (S/N > ~ 5) or approximately 10 mCrab.
A list of all detected sources with references to publications on them is presented in the paper of Revnivtsev et al. 2004, Astr. Lett. v.6. In these survey images (40-100 keV) all performed observations are averaged together. Transient sources that were discovered by SIGMA may not visible in the averaged image.
This survey has some features that users should keep in mind. The SIGMA telescope is a complicated instrument and is strongly dominated by the accuracy of the background subtraction. The presence of a very bright source in the field of view of the telescope sometimes can not be fully accounted for and as a result of it some 'ghost' sources can appear. Such features can be seen in the regions near very bright sources like Crab Nebula, Cyg X-1, Nova Per 1992, Nova Mus 1991, Nova Oph 1993, and in the Galactic Center region. In addition to its nominal field of view (~17x17 deg) located around the optical axis of the telescope, SIGMA had another window of relatively high transparency of its shield, approximately 20-30° apart from the optical axis. Becuase of this a very bright sources like Cyg X-1 can cause non zero illumination of the SIGMA detector if they are located approximately 20-30° from the optical axis. The ring-like features caused by this effect, can be seen around Cyg X-1, and Nova Per 1992.
The count rate of detected sources (or upper limits) can be roughly translated into mCrab using the fact that that Crab nebula gives the count rate approximately 2.8e-3 cnts/s in the units, provided in 'flux' maps
| Provenance | High Energy Astrophysics Department, Space Research Institute, Moscow, Russia; CEA, Centre d'Etudes de Saclay Orme des Merisiers, France; Centre d'Etude Spatiale des Rayonnements, Toulouse, France; Fédération de Recherche Astroparticule et Cosmologie Université de Paris, France |
|---|---|
| Copyright | Public Domain |
| Regime | X-ray |
| NSurvey | 2 (significance and flux) |
| Frequency | 40-100 keV |
| Coverage | Approximately one quarter of the sky |
| Scale | 3.24 arc minutes/pix |
| Units | Statistical significance, Flux |
| Resolution | 12 arc minutes |
| Coordinates | Equatorial |
| Projection | Gnomonic |
| Equinox | 1950 |
| Epoch | 1989-1998 |
| Reference | Hard X-ray sky survey with the SIGMA telescope aboard GRANAT observatory, Revnivtsev M., Sunyaev R., Gilfanov M., Churazov E., Goldwurm A., Paul J., Mandrou P., Roques J.-P., Astronomy Letters 2004, v.30 |
See Allen, Jahoda, and Whitlock (1994) for full details about the available maps, their processing, and methods for converting the map intensities into familiar physical units.
| Provenance | NASA, HEASARC |
|---|---|
| Copyright | Public domain |
| Regime | X-ray |
| Frequency | 2 EHz 2-20 keV |
| CoordinateSystem | Ecliptic |
| Projection | Cartesion |
| Scale | 0.5x0.25 degrees |
| Units | Counts/Secont |
| Coverage | All-sky |
| NSurvey | 1 |
| Resolution | Approxmately 2 degrees |
| Epoch | ca. 1978 |
| Reference |
Shafer, R.A. 1983, Spatial Fluctuations in the
Diffuse X-Ray Background, University of Maryland Ph.D. thesis.
Allen, J., Jahoda, K., and Whitlock, L. 1994, HEAO-1 and the A2 experiment, Legacy, 5. |
| Provenance | Data from GSFC and MPE. SkyView mosaic generated by SkyView. |
|---|---|
| Copyright | Public Domain |
| Regime | X-ray |
| NSurvey | 1 |
| Frequency | 1 keV |
| Coverage | Observation patches covering ~1.8% of the sky. |
| PixelScale | 5" |
| PixelUnits | |
| Resolution | 1" |
| Coordinates | Equatorial |
| Equinox | 2000 |
| Projection | Gnomonic |
| Epoch | |
| Reference | The ROSAT High Resolution Imager (HRI) Calibration Report |
The SPI significance map is based on the public GCDE data and uses data in the 20 - 40 keV energy range. The analysis of the data was done using the SPIROS software (Skinner & Connell 2003, A&A, 411, L123). This software uses the 'Iterative Removal of Sources' technique in order to find the most significant sources. In the output significance map the sources found in this process are put on top of the residual map as points with a FWHM of 1 degree.
Current data respresent the combination of all public observations as of September 1, 2004.
| Provenance | INTEGRAL Science Data Center, Geneva, Switzerland |
|---|---|
| Copyright | Public Domain |
| Regime | X-ray |
| NSurvey | 1 (significance and flux) |
| Frequency | 20-40 keV |
| Coverage | |
| Scale | 6 arc minutes/pix |
| Units | Statistical significance, Flux |
| Resolution | approximately 1 degree |
| Coordinates | Galactic |
| Projection | Aitoff |
| Epoch | March 2002 - May 2003 |
| Reference | INTEGRAL Guest Observer Facility |
The smaller cut-offs allow users to distinguish point sources in fields where a bright source may have been towards the edge of one observation and near the center of another. In these cases the source appears fuzzy due to the poor resolution of ROSAT near the edge of the field of view. This comes at the cost of a substantial reduction in the fraction of the sky covered. Counts and exposure maps are included for users who may need this information (e.g., to do statistical analysis).
The global organization of the surveys is similar to the IRAS survey. Each map covers an area of 2.5°x2.5° with a minimum overlap of 0.25°. To cover the entire sky would require over 10,000 maps. However due to lack of coverage only approximately 4000-6000 maps are actually populated. Users asking for reqions where there is no ROSAT coverage may get a blank region returned.
Detailed information regarding the creation of the ROSAT suveys can be found in the ROSAT PSPC Generation Document.
| Provenance | Observational data from NASA Goddard Space Flight Center, mosaicking of images done by SkyView. |
|---|---|
| Copyright | Public domain |
| Regime | X-ray |
| NSurvey | 1 |
| Frequency | 0.3 EHz (.1-2.4 keV) |
| Coverage | Isolated pointings in the sky. Total coverage < 14% |
| PixelScale | 15" |
| PixelUnits | cts/s/pixel |
| Resolution | 30" but variable across the field of view |
| Coordinates | Equatorial |
| Equinox | 2000 |
| Projection | Gnomonic |
| Epoch | 1991-1994 |
| Reference | ROSAT Mission Description and Data Products Guide, available through the ROSAT Guest Observer Facility, NASA GSFC. SkyView Rosat Survey Generation description. |
The smaller cut-offs allow users to distinguish point sources in fields where a bright source may have been towards the edge of one observation and near the center of another. In these cases the source appears fuzzy due to the poor resolution of ROSAT near the edge of the field of view. This comes at the cost of a substantial reduction in the fraction of the sky covered. Counts and exposure maps are included for users who may need this information (e.g., to do statistical analysis).
The global organization of the surveys is similar to the IRAS survey. Each map covers an area of 2.5°x2.5° with a minimum overlap of 0.25°. To cover the entire sky would require over 10,000 maps. However due to lack of coverage only approximately 4000-6000 maps are actually populated. Users asking for reqions where there is no ROSAT coverage may get a blank region returned.
Detailed information regarding the creation of the ROSAT suveys can be found in the ROSAT PSPC Generation Document.
| Provenance | Observational data from NASA Goddard Space Flight Center, mosaicking of images done by SkyView. |
|---|---|
| Copyright | Public domain |
| Regime | X-ray |
| NSurvey | 1 |
| Frequency | 0.3 EHz (.1-2.4 keV) |
| Coverage | Isolated pointings in the sky. Total coverage < 14% |
| PixelScale | 15" |
| PixelUnits | cts/s/pixel |
| Resolution | 30" but variable across the field of view |
| Coordinates | Equatorial |
| Equinox | 2000 |
| Projection | Gnomonic |
| Epoch | 1992-1994 |
| Reference |
The smaller cut-offs allow users to distinguish point sources in fields where a bright source may have been towards the edge of one observation and near the center of another. In these cases the source appears fuzzy due to the poor resolution of ROSAT near the edge of the field of view. This comes at the cost of a substantial reduction in the fraction of the sky covered. Counts and exposure maps are included for users who may need this information (e.g., to do statistical analysis).
The global organization of the surveys is similar to the IRAS survey. Each map covers an area of 2.5°x2.5° with a minimum overlap of 0.25°. To cover the entire sky would require over 10,000 maps. However due to lack of coverage only approximately 4000-6000 maps are actually populated. Users asking for reqions where there is no ROSAT coverage may get a blank region returned.
Detailed information regarding the creation of the ROSAT suveys can be found in the ROSAT PSPC Generation Document.
| Provenance | Observational data from NASA Goddard Space Flight Center, mosaicking of images done by SkyView. |
|---|---|
| Copyright | Public domain |
| Regime | X-ray |
| NSurvey | 1 |
| Frequency | 0.3 EHz (.1-2.4 keV) |
| Coverage | Isolated pointings in the sky. Total coverage < 14% |
| PixelScale | 15" |
| PixelUnits | cts/s/pixel |
| Resolution | 30" but variable across the field of view |
| Coordinates | Equatorial |
| Equinox | 2000 |
| Projection | Gnomonic |
| Epoch | 1991-1994 |
| Reference | ROSAT Mission Description and Data Products Guide, available thr ough the ROSAT Guest Observer Facility, NASA GSFC. SkyView Rosat Survey Generation description. |
SkyView also has two other sets of surveys derived from the RASS data with substantially higher resolution. The surveys whose names begin with RASS3 are counts maps with 45" pixels. The RASS or RASSInt surveys are intensity maps generated by dividing the counts maps with the exposure maps provided by MPE.
| Provenance | Max Planck Institute for Exterrestrial Physics (Garching FRG) |
|---|---|
| Copyright | MPI but data may be used for scientific purposes so long as appropriate reference is included. |
| Regime | X-ray |
| NSurvey | 3 |
| Frequency | 0.1-2 KeV |
| Coverage | All-sky |
| PixelScale | 40.5' |
| PixelUnits | 10-6counts/s |
| Resolution | ca. 2° |
| Coordinates | Galactic |
| Projection | Aitoff |
| Epoch | ca. 1991 |
| Reference | S.L. Snowden, M.J. Freyberg, P.P. Plucinsky, J.H.M.M. Schmitt, J. Trümper, W. Voges, R.J. Edgar, D. McCammon, W.T. Sanders: Astrophysical Journal, Vol.454 (1995), pp.643-653 |
SkyView has three sets of surveys derived from the RASS data. The surveys whose names begin with RASS3 are counts maps. The surveys with the names RASS or RASSINT are intensity images. These are simply the ratios of the counts maps and the exposure images produced by MPE. Both the counts maps and the intensity images have 45" pixels. A third set of RASS surveys is available int the surveys labeled RASS(.25|.75|1.5)keV. These are lower resolution intensity surveys (40.5' pixels) wiprith where point sources have been removed. They give the best sense of the background X-ray flux.
For the full-resolution RASS3 counts surveys data are organized in 1378 RASS3 fields each 6.4° x 6.4° covering the whole sky. Neighboring fields overlap by at least 0.23°.
Three bands are available through SkyView
| Provenance | Max Planck Institute for Exterrestrial Physics (Garching FRG) |
|---|---|
| Copyright | MPE but data may be used for scientific purposes so long as appropriate reference is included. |
| Regime | X-ray |
| NSurvey | 3 |
| Frequency | 0.1-2 KeV |
| Coverage | All-sky |
| PixelScale | 45" |
| PixelUnits | Counts |
| Resolution | |
| Coordinates | Equatorial |
| Equinox | |
| Projection | Gnomonic |
| Epoch | |
| Reference | The ROSAT All-Sky Survey |
SkyView has three sets of surveys derived from the RASS data. The surveys whose names begin with RASS3 are counts maps. The surveys with the names RASS or RASSINT are intensity images. These are simply the ratios of the counts maps and the exposure images produced by MPE. Both the counts maps and the intensity images have 45" pixels. A third set of RASS surveys is available int the surveys labeled RASS(.25|.75|1.5)keV. These are lower resolution intensity surveys (40.5' pixels) wiprith where point sources have been removed. They give the best sense of the background X-ray flux.
For the full-resolution RASS3 counts surveys data are organized in 1378 RASS3 fields each 6.4° x 6.4° covering the whole sky. Neighboring fields overlap by at least 0.23°.
Three bands are available through SkyView
| Provenance | Max Planck Institute for Exterrestrial Physics (Garching FRG) |
|---|---|
| Copyright | MPE but data may be used for scientific purposes so long as appropriate reference is included. |
| Regime | X-ray |
| NSurvey | 3 |
| Frequency | 0.5-2 KeV |
| Coverage | All-sky |
| PixelScale | 45" |
| PixelUnits | Counts |
| Resolution | |
| Coordinates | Equatorial |
| Equinox | |
| Projection | Gnomonic |
| Epoch | |
| Reference | The ROSAT All-Sky Survey |
The seven maps correspond to ranges in the pulse height analysis of the photons detected. Since the energy resolution of the PSPC is poor, there is consider overlap between adjacent bands.
The energy range for the bands corresponds to:
| Band | Energy range (keV) |
|---|---|
| Band 1 | 0.11 - 0.284 |
| Band 2 | 0.14 - 0.284 |
| Band 3 | 0.2 - 0.83 |
| Band 4 | 0.44 - 1.01 |
| Band 5 | 0.56 - 1.21 |
| Band 6 | 0.73 - 1.56 |
| Band 7 | 1.05 - 2.04 |
SkyView has several other sets of surveys derived from ROSAT data with substantially higher resolution and which include point sources. The RASS surveys are derived from the RASS all sky survey. These include count and intensity maps. The PSPC maps are dervived from the PSPC pointed observations which were combined by SkyView. The HRI survey is derived from a similar mosaicking of all HRI observations.
| Provenance | Max Planck Institute for Exterrestrial Physics (Garching FRG) |
|---|---|
| Copyright | MPI but data may be used for scientific purposes so long as appropriate reference is included. |
| Regime | X-ray |
| NSurvey | 6 |
| Frequency | 0.1-2 KeV |
| Coverage | All-sky |
| PixelScale | 0.2 |
| PixelUnits | 10-6counts/s |
| Resolution | ca. 2° |
| Coordinates | Galactic |
| Projection | Zenithal Equal Area |
| Epoch | ca. 1991 |
| Reference | S.L. Snowden, et al., Ap,J, Vol.485 (1997), pp.125 |
SkyView has three sets of surveys derived from the RASS data. The surveys whose names begin with RASS3 are counts maps. The surveys with the names RASS or RASSINT are intensity images. These are simply the ratios of the counts maps and the exposure images produced by MPE. Both the counts maps and the intensity images have 45" pixels. A third set of RASS surveys is available int the surveys labeled RASS(.25|.75|1.5)keV. These are lower resolution intensity surveys (40.5' pixels) wiprith where point sources have been removed. They give the best sense of the background X-ray flux.
For the full-resolution RASS intensity surveys data are organized in 1378 RASS fields each 6.4° x 6.4° covering the whole sky. Neighboring fields overlap by at least 0.23°.
Three bands are available through SkyView
| Provenance | Max Planck Institute for Exterrestrial Physics (Garching FRG) |
|---|---|
| Copyright | MPE but data may be used for scientific purposes so long as appropriate reference is included. |
| Regime | X-ray |
| NSurvey | 3 |
| Frequency | 0.1-2 KeV |
| Coverage | All-sky |
| PixelScale | 45" |
| PixelUnits | Counts/S |
| Resolution | |
| Coordinates | Equatorial |
| Equinox | |
| Projection | Gnomonic |
| Epoch | |
| Reference | The ROSAT All-Sky Survey |
We have utilized the slew parts of all RXTE/PCA observations performed from April 15, 1996-July 16, 2002 which amounts in total to approximately 50,000 observations. The exposure time at a given point in the map is typically between 200-500 seconds. The observational period before April 15, 1996 (High Voltage Epochs 1 and 2) was excluded from the analysis because during that time the PCA had significantly different gain and dependence of the effective area on energy. The data reduction was done using standard tools of the LHEASOFT with a set of packages written by M. Revnivtsev (HEAD/IKI, Moscow; MPA, Garching).
The survey has several features. It has strongly different exposure times at different points on the sky that lead to strong variability of the statistical noise on images. Because of that the only meaningful representation of images is the map in units of statistical significance. After the detection of a source flux can be determined from the map in the 'flux' units. Map resolution is determined mainly by the slew rate of the RXTE (<0.05-0.1°/sec) and the time resolution of used data (16 sec, Std2 mode of the PCA). Sources can be detected down to the level of ~6e-12 erg/s/cm2, but at this level the confusion starts to play an important role. Details of the survey are presented in the paper of Revnivtsev et al. (2004).
| Provenance | High Energy Astrophysics Department, Space Research Institute, Moscow, Russia; MPA, Garching, Germany |
|---|---|
| Copyright | Public domain |
| Regime | X-ray |
| NSurvey | 6 |
| Frequency | 3-20keV, 3-8keV, 8-20keV |
| Coverage | All-sky |b| > 3 |
| PixelScale | .5x.5° pixel |
| PixelUnits | Statistical significance, Flux |
| Resolution | 1° |
| Coordinates | Galactic |
| Equinox | |
| Projection | Gnomonic |
| Epoch | 1996-2002 |
| Reference | RXTE all-sky slew survey. Catalog of X-ray sources at |b|>10 °, M. Revnivtsev, S. Sazonov, M. Gilfanov, K. Jahoda 2004, A&A, 418, 927 |
We have utilized the slew parts of all RXTE/PCA observations performed from April 15, 1996-July 16, 2002 which amounts in total to approximately 50,000 observations. The exposure time at a given point in the map is typically between 200-500 seconds. The observational period before April 15, 1996 (High Voltage Epochs 1 and 2) was excluded from the analysis because during that time the PCA had significantly different gain and dependence of the effective area on energy. The data reduction was done using standard tools of the LHEASOFT with a set of packages written by M. Revnivtsev (HEAD/IKI, Moscow; MPA, Garching).
The survey has several features. It has strongly different exposure times at different points on the sky that lead to strong variability of the statistical noise on images. Because of that the only meaningful representation of images is the map in units of statistical significance. After the detection of a source flux can be determined from the map in the 'flux' units. Map resolution is determined mainly by the slew rate of the RXTE (<0.05-0.1°/sec) and the time resolution of used data (16 sec, Std2 mode of the PCA). Sources can be detected down to the level of ~6e-12 erg/s/cm2, but at this level the confusion starts to play an important role. Details of the survey are presented in the paper of Revnivtsev et al. (2004).
| Provenance | High Energy Astrophysics Department, Space Research Institute, Moscow, Russia; M PA, Garching, Germany |
|---|---|
| Copyright | Public domain |
| Regime | X-ray |
| NSurvey | 6 |
| Frequency | 3-20keV, 3-8keV, 8-20keV |
| Coverage | All-sky |b| > 3 |
| PixelScale | .5x.5° pixel |
| PixelUnits | Statistical significance, Flux |
| Resolution | 1° |
| Coordinates | Galactic |
| Equinox | |
| Projection | Gnomonic |
| Epoch | 1996-2002 |
| Reference | RXTE all-sky slew survey. Catalog of X-ray sources at |b|>10 &# 176;, M. Revnivtsev, S. Sazonov, M. Gilfanov, K. Jahoda 2004, A&A, 418, 92 7 |
We have utilized the slew parts of all RXTE/PCA observations performed from April 15, 1996-July 16, 2002 which amounts in total to approximately 50,000 observations. The exposure time at a given point in the map is typically between 200-500 seconds. The observational period before April 15, 1996 (High Voltage Epochs 1 and 2) was excluded from the analysis because during that time the PCA had significantly different gain and dependence of the effective area on energy. The data reduction was done using standard tools of the LHEASOFT with a set of packages written by M. Revnivtsev (HEAD/IKI, Moscow; MPA, Garching).
The survey has several features. It has strongly different exposure times at different points on the sky that lead to strong variability of the statistical noise on images. Because of that the only meaningful representation of images is the map in units of statistical significance. After the detection of a source flux can be determined from the map in the 'flux' units. Map resolution is determined mainly by the slew rate of the RXTE (<0.05-0.1°/sec) and the time resolution of used data (16 sec, Std2 mode of the PCA). Sources can be detected down to the level of ~6e-12 erg/s/cm2, but at this level the confusion starts to play an important role. Details of the survey are presented in the paper of Revnivtsev et al. (2004).
| Provenance | High Energy Astrophysics Department, Space Research Institute, Moscow, Russia; M PA, Garching, Germany |
|---|---|
| Copyright | Public domain |
| Regime | X-ray |
| NSurvey | 6 |
| Frequency | 8-20keV |
| Coverage | All-sky |b| > 3 |
| PixelScale | .5x.5° pixel |
| PixelUnits | Statistical significance, Flux |
| Resolution | 1° |
| Coordinates | Galactic |
| Equinox | |
| Projection | Gnomonic |
| Epoch | 1996-2002 |
| Reference | RXTE all-sky slew survey. Catalog of X-ray sources at |b|>10 &# 176;, M. Revnivtsev, S. Sazonov, M. Gilfanov, K. Jahoda 2004, A&A, 418, 92 7 |
The maps were originally generated by the CompTel Instrument Team as three separate maps in the bands:
All CompTel observations from phases 1, 2 and 3 were included in the maps (May 1991 through October 1994). These maps were combined into a single 3-D map at SkyView
| Provenance | CompTel Instrument Team. Maps generated by Andrew Strong, Max-Planck Institute for Extraterrestrial Physics (Garching). |
|---|---|
| Copyright | Public domain |
| Regime | Gamma Ray |
| NSurvey | 1 survey with 3 bands |
| Frequency | 1-3 MeV, 3-10 MeV, 10-30 MeV |
| Coverage | All-sky |
| PixelScale | 1d |
| PixelUnits | cts/s/cm2/steradian |
| Resolution | ~3d |
| Epoch | May 1991 to October 1994 |
| CoordinateSystem | Galactic |
| Projection | Rectangular (CAR) |
| Reference | Comptel Instrument Team Home Page |
The EGRET 3D map is comprised of ten channels with the following energy ranges:
The default two dimensional image for the EGRET 3D survey is an average of Channels 4 - 10 (energies greater than 100 MeV).
| Provenance | EGRET Instrument team, NASA Goddard Space Flight Center |
|---|---|
| Copyright | Public domain |
| Regime | Gamma Ray |
| NSurveys | 3 |
| Frequency | 6 ZHz to 1 YHz (30-100 MeV, 100-10000 MeV) |
| Coverage | All-sky |
| Resolution | ca. 5d below 100 MeV, ca. 2d above 100 MeV |
| PixelScale | 0.5 degrees/pixel |
| PixelUnits | cts/s/cm2/steradian |
| Coordinates | Galactic |
| Projection | Rectangular |
| Epoch | 1992-1995 |
| Reference | Hartman, et al., 1999, The Third EGRET Source Catalog, ApJ Supplement, 123, 79-202 |
The EGRET 3D map is comprised of ten channels with the following energy ranges:
The default two dimensional image for the EGRET 3D survey is an average of Channels 4 - 10 (energies greater than 100 MeV).
| Provenance | EGRET Instrument team, NASA Goddard Space Flight Center |
|---|---|
| Copyright | Public domain |
| Regime | Gamma Ray |
| NSurveys | 3 |
| Frequency | 6 ZHz to 1 YHz (30-100 MeV, 100-10000 MeV) |
| Coverage | All-sky |
| Resolution | ca. 5 degrees below 100 MeV, ca. 2 degrees above 100 MeV |
| PixelScale | 0.5 d/pixel |
| PixelUnits | cts/s/cm2/steradian |
| Coordinates | Galactic |
| Projection | Rectangular |
| Epoch | 1992-1995 |
| Reference | Hartman, et al., 1999, The Third EGRET Source Catalog, ApJ Supplement, 123, 79-202 |
-------------- Other surveys --------------
Galaxy Explorer All Sky Survey: Near UV
Short name[s] used to specify survey: GalexNear,GALEX NEAR UV
The SkyView GALEX surveys mosaic the intensity images of All-Sky Survey images. For a given pixel only the nearest image is used. Since a given GALEX observation is circular, this maximizes the coverage compared with default image finding algorithms which use the distance from edge of the image.
| Provenance | All data is downloaded from the MAST GALEX archive. |
|---|---|
| Copyright | Public domain. |
| Regime | UV |
| NSurvey | 2 |
| Frequency | Near UV: 1-1.7 PHz (2831-1771A), Far UV: 1.7-2.4 PHz (1786-1344A) |
| Coverage | All sky/patchy |
| PixelScale | 1.5" |
| PixelUnits | Intensity |
| Resolution | 5" |
| Coordinates | Equatorial |
| Equinox | 2000 |
| Projection | Tangent |
| Epoch | ca. 2007 |
| Reference | The GALEX Guest Invesitigator and MAST Archive sites provide documentation and characteristics of the GALEX observatory and archive. |
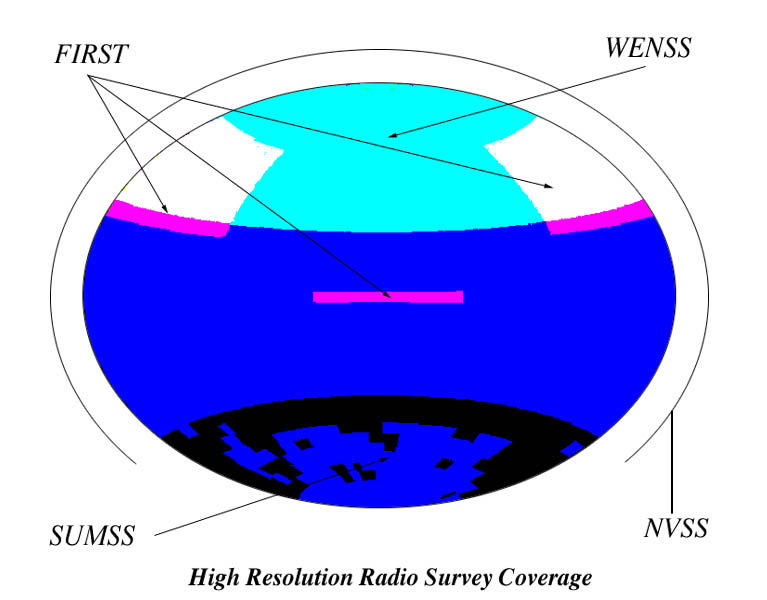