Appendix B. Maps
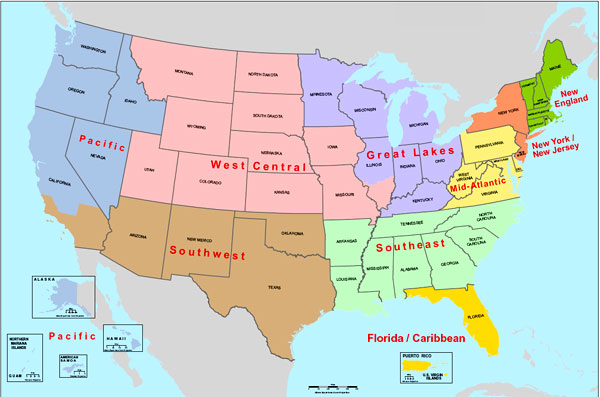
Map 1. Nine OCDETF regions.
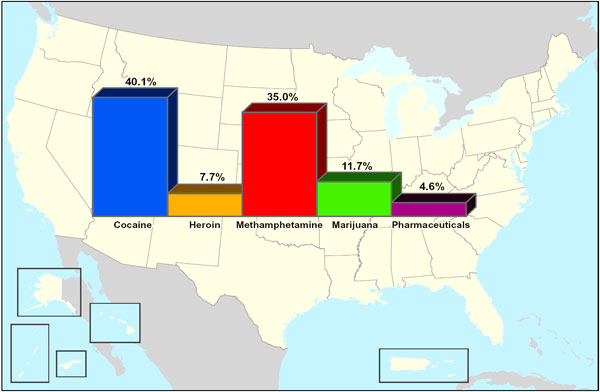
Map 2 National Drug Threat Survey 2007 greatest drug threat as reported by state and local agencies..
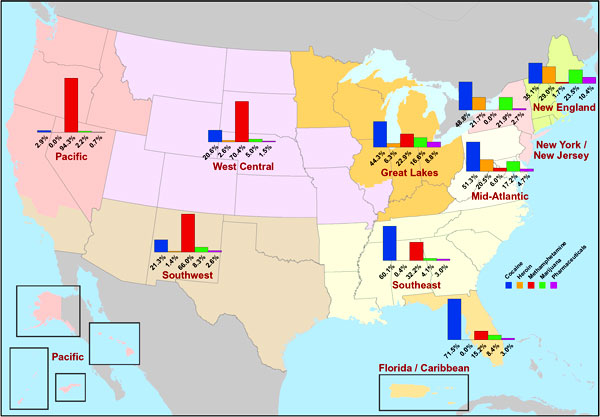
Map 3. National Drug Threat Survey 2007 greatest drug threat by region as
reported by state and local agencies.
Map 4. U.S. cities with cocaine shortages reported by law enforcement agencies during
the second quarter of 2007.
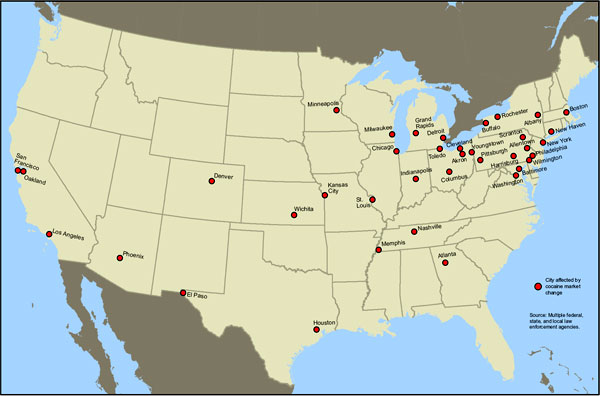
Source: Multiple federal, state, and local law enforcement agencies.
Map 5. Changes in Quest cocaine positivity results in cities with reported cocaine shortages, second quarter 2006 compared with second quarter 2007.

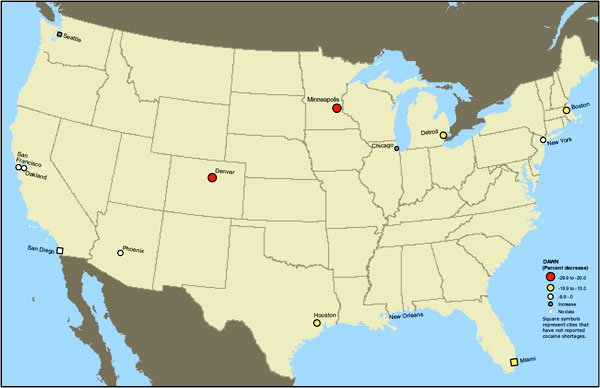
Map 6. DAWN: Changes in cocaine emergency department visits for second quarters of 2006 and 2007.