Department of Health and Human Services
Centers for Disease Control and Prevention
|
|
||||||||||||||||
|
|
|
|
|
|||||||||||||
|
|
Control and Prevention Division of Cancer Prevention and Control 4770 Buford Hwy, NE MS K-64 Atlanta, GA 30341-3717 Call: 1 (800) CDC-INFO TTY: 1 (888) 232-6348 FAX: (770) 488-4760 E-mail: cdcinfo@cdc.gov Submit a Question Online |
|
|
|
Ovarian Cancer: Compare by Race and EthnicityRelated Information: Compare by State The rate of women in the United States getting or dying from ovarian cancer varies by race and ethnicity. Ovarian cancer incidence (new cases) and mortality (deaths) rates are higher among Caucasian women than women of any other racial group.1 Incidence Rates by Race and EthnicityIncidence refers to the number of women who get a disease each year. The graph below shows the incidence rates in the U.S. for ovarian cancer from 1975–2004, the most recent year for which data are available. As the graph illustrates, the rate of women getting ovarian cancer varied by race and ethnicity during this period. Ovarian Cancer 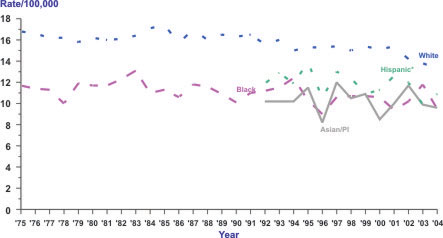
*The group, or category, called "Hispanic" may be included in other categories like American Indian/Alaska Native (AI/AN), and Asian/Pacific Islander (Asian/PI). Mortality Rates by Race and EthnicityMortality refers to the number of women who die from a disease each year. The graph below shows the mortality rates in the U.S. for ovarian cancer from 1969–2004, the most recent year for which data are available. As the graph illustrates, the rate of women dying from ovarian cancer varied by race and ethnicity during this period. Ovarian Cancer 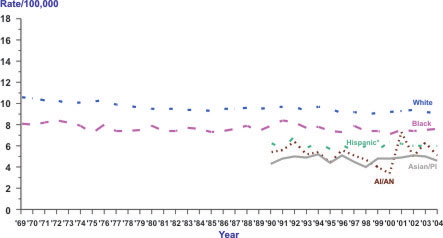
*The group, or category, called "Hispanic" may be included in other categories like American Indian/Alaska Native (AI/AN), and Asian/Pacific Islander (Asian/PI). Reference
Page last reviewed: March 14, 2008
Page last updated: March 14, 2008 Content source: Division of Cancer Prevention and Control, National Center for Chronic Disease Prevention and Health Promotion |
|
|||||||||||||||||||||||||||||||||||||||||||||||||||||||||||||||||||||||||||||||||||||||||||||||||||||||
|
|
|
||||||||||||
|