1988�07 No Leisure-Time Physical Activity Trend Chart
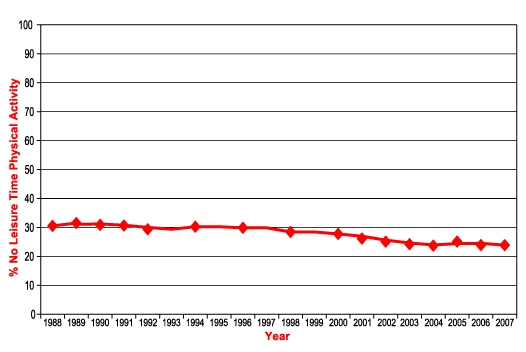
Data are reported from 36 participating states from 1988�07. The proportion of the U.S. population that reported no leisure-time physical activity decreased from about 31% in 1989 to about 28% in 2000, then decreased to about 24% in 2007.
| Prevalence of No
Leisure-Time Physical Activity – Behavioral Risk Factor Surveillance System, 35 Statesa and the District of Columbia, 1988�07 |
||
|---|---|---|
| Year | % | 95% CIb |
| 1988 | 30.5 | (29.9-31.2) |
| 1989 | 31.5 | (30.9-32.1) |
| 1990 | 30.9 | (30.3-31.5) |
| 1991 | 30.6 | (30.1-31.2) |
| 1992 | 29.3 | (28.9-29.8) |
| 1994 | 30.2 | (29.7-30.8) |
| 1996 | 29.9 | (29.4-30.3) |
| 1998 | 28.4 | (28.0-28.9) |
| 2000 | 27.8 | (27.3-28.2) |
| 2001 | 26.2 | (25.7-26.6) |
| 2002 | 25.1 | (24.7-25.4) |
| 2003 | 24.2 | (23.8-24.6) |
| 2004 | 23.7 | (23.3-24.1) |
| 2005 | 25.1 | (24.7-25.5) |
| 2006 | 23.9 | (23.5-24.3) |
| 2007 | 23.9 | (23.5-24.3) |
|
Note: Data were adjusted for non-responses,
age-adjusted to the 2000 U.S. standard population, and
weighted to provide estimates. Confidence
intervals were calculated using SUDAAN to adjust for the
complex survey sample design. |
||
![]() Please note: Some of these publications are available for download only as *.pdf files. These files require Adobe Acrobat Reader in order to be viewed. Please review the information on downloading and using Acrobat Reader software.
Please note: Some of these publications are available for download only as *.pdf files. These files require Adobe Acrobat Reader in order to be viewed. Please review the information on downloading and using Acrobat Reader software.
* Links to non-Federal organizations found at this site are provided solely as a service to our users. These links do not constitute an endorsement of these organizations or their programs by CDC or the Federal Government, and none should be inferred. CDC is not responsible for the content of the individual organization Web pages found at these links.
Page last updated: March 5, 2008
Content Source: Division of Nutrition, Physical Activity and Obesity, National Center for Chronic Disease Prevention and Health Promotion