Skip all navigation and jump to content Jump to site navigation Jump to section navigation.
NASA Logo - Goddard Space Flight Center + Visit NASA.gov
HOME PROJECTS RESOURCES SEARCH MAP

+ Advanced Search
Home
Home
View Most Recently Released Imagery
View Gallery of Imagery: A topical collection of SVS Imagery
Search Imagery by the keywords assigned to it
Search Imagery by the instruments that supplied data for a visualization product
Search Imagery by the series of visualizations that have been produced
Search Imagery by the scientist providing the data used in a visualization product
Search Imagery by the animator that created the product
Search Imagery by the identification number assigned to the visualization product
See other search options
Learn about the SVS Image Server
  + About the Server
  + Animation List
  + How to Use the Server


  + RSS Feeds
blank image
Previous Animation
Next Animation
Atlantic Hurricane/Storm Summary

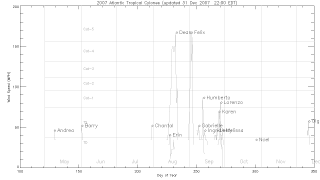
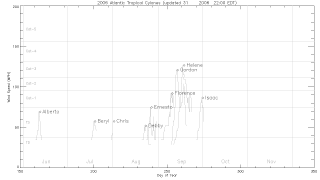
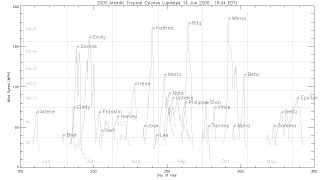
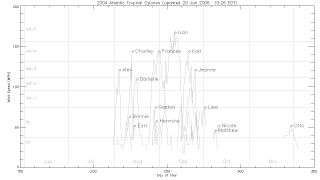
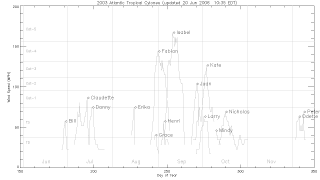
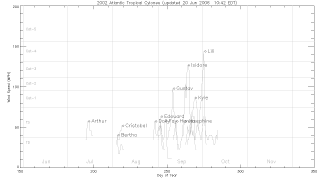
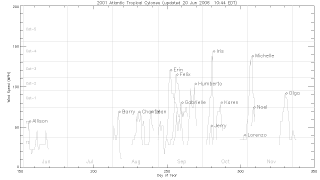
These still images shows plots of time vs. wind speed for each tropical storm/hurricane of the Atlantic Hurricane seasons. Horizontal lines indicate wind speed category thresholds. A line plot for each storm shows the storm's name and a marker at the peak wind speed.

The 2008 plot automatically updates every 2 hours during hurricane season.


2008 Atlantic hurricanes and storms    2008 Atlantic hurricanes and storms

Available formats:
  1280 x 720       GIF 15 KB
  80 x 40             PNG     588 B
  160 x 80           PNG   1 KB
  320 x 180         PNG   2 KB


2007 Atlantic hurricanes and storms    2007 Atlantic hurricanes and storms

Available formats:
  1280 x 720       GIF 15 KB
  80 x 40             PNG     579 B
  160 x 80           PNG   1018 B
  320 x 180         PNG   2 KB


2006 Atlantic hurricanes and storms    2006 Atlantic hurricanes and storms

Available formats:
  1280 x 720       GIF 14 KB
  320 x 180         PNG   2 KB
  160 x 80           PNG   1 KB
  80 x 40             PNG     898 B


2005 Atlantic hurricanes and storms    2005 Atlantic hurricanes and storms

Available formats:
  160 x 80           PNG   7 KB
  1280 x 720       GIF 30 KB
  320 x 180         PNG   9 KB


2004 Atlantic hurricanes and storms    2004 Atlantic hurricanes and storms

Available formats:
  160 x 80           PNG   5 KB
  1280 x 720       GIF 25 KB
  320 x 180         PNG   4 KB


2003 Atlantic hurricanes and storms    2003 Atlantic hurricanes and storms

Available formats:
  160 x 80           PNG   5 KB
  1280 x 720       GIF 23 KB
  320 x 180         PNG   4 KB


2002 Atlantic hurricanes and storms    2002 Atlantic hurricanes and storms

Available formats:
  160 x 80           PNG   4 KB
  1280 x 720       GIF 20 KB
  320 x 180         PNG   3 KB


2001 Atlantic hurricanes and storms    2001 Atlantic hurricanes and storms

Available formats:
  160 x 80           PNG   5 KB
  1280 x 720       GIF 23 KB
  320 x 180         PNG   4 KB

Animation Number:3361
Animator:Greg Shirah (SVS) (Lead)
Completed:2006-06-13
Data set:Unisys Hurricane Tracking Data
Data Collected:06/01/2006 through present (or end of hurricane season)
Keywords:
DLESE >> Atmospheric science
SVS >> Hurricane
DLESE >> Natural hazards
GCMD >> EARTH SCIENCE >> Atmosphere >> Atmospheric Phenomena >> Hurricanes
 
 
Please give credit for this item to
NASA/Goddard Space Flight Center Scientific Visualization Studio
Storm wind speeds provided by NOAA's National Weather Service via UNISYS


Back to Top

USA.gov logo - the U.S. Government's official Web portal. + Privacy Policy and Important Notices
+ Reproduction Guidelines
NASA NASA Official:
SVS Contact:
Curator: