Hurricane Rita from TRMM: September 22, 2005
|
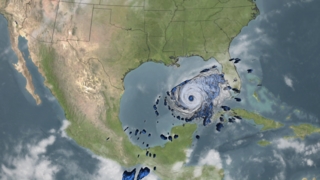
NASA's TRMM spacecraft observed this view of Hurricane Rita on September 22, 2005 at 0810Z. At this time the storm was the most destructive category 5 hurricane with a minimum pressure of 898mb, sustained winds of 150 knots, and a 15 nautical mile eye diameter. The cloud cover is taken by TRMM's Visible and Infrared Scanner(VIRS) and the GOES spacecraft. The rain structure is taken by TRMM's Tropical Microwave Imager (TMI). It looks underneath of the storm's clouds to reveal the underlying rain structure. Blue represents areas with at least 0.25 inches of rain per hour. Green shows at least 0.5 inches of rain per hour. Yellow is at least 1.0 inches of rain and red is at least 2.0 inches of rain per hour.
|
|

|
|
Hurricane Rita threatens the gulf coast. Blue under the clouds represents the energy of the storm, its rain.
Duration: 15.0 seconds
Available formats:
2560x1920
TIFF
6 MB
720x486 (30 fps)
Frames
320x240
JPEG
58 KB
160x80
PNG
24 KB
80x40
PNG
6 KB
720x480 (30 fps)
MPEG-1
10 MB
720x480 (29.97 fps)
MPEG-2
13 MB
How to play our movies
|
|
|
|
High definition version 1280 by 720
Duration: 15.0 seconds
Available formats:
1280x720 (29.97 fps)
MPEG-2
33 MB
1280x720 (30 fps)
Frames
320x180
JPEG
45 KB
160x80
PNG
29 KB
80x40
PNG
8 KB
How to play our movies
|
|
|
|
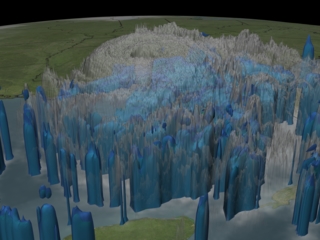
Bands of light rain (0.25 inches per hour) are shown in blue. Bands of heavier rain (0.5 inches per hour) are in green.
Available formats:
2560 x 1920
TIFF
6 MB
320 x 240
JPEG
52 KB
160 x 80
PNG
22 KB
|
|
|
|
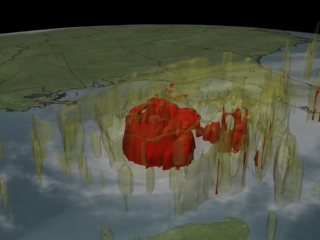
Red represents areas where at least 2 inches of rain per hour fell and yellow shows where at least 1 inch per hour fell.
Available formats:
2560 x 1920
TIFF
4 MB
320 x 240
JPEG
43 KB
160 x 80
PNG
20 KB
80 x 40
PNG
5 KB
|
|
|
Back to Top
|

