UI PERFORMS
CY 1998 Annual Report
U.S. Department of Labor
Employment and Training Administration
Unemployment Insurance Service
August 1999
Material contained in this publication is in the public domain and may be reproduced, fully or partially, without permission of the Federal Government. Source credit is requested but not required. Permission is required only to reproduce and copyright material contained herein.
This material will be made available to sensory impaired individuals upon
request.
Voice phone: 202-219-7664
TDD* phone 1-800-326-2577
*Telecommunications Device for the Deaf.
Alexis M. Herman, Secretary
Employment and Training Administration
Raymond Bramucci, Assistant Secretary
Unemployment Insurance Service
Grace A. Kilbane, Director
August 1999
This CY 1998 report is the second comprehensive UI PERFORMS Annual Report. It is intended to give a representative overview of Unemployment Insurance operational performance during the 12 months ending December 31, 1998. Thus, it presents the results of key indicators of the full range of UI operational performanceóbenefits, appeals, tax and cash management. At various times, the Department may supplement this report with reports in greater depth on individual areas, or present the same material using a different format.
UI PERFORMS
UI PERFORMS is the umbrella term adopted to designate the Departmentís closed-loop system for promoting continuous improvement in UI operational performance. The goal of UI PERFORMS is to ensure that the systemís ultimate customersóUI beneficiaries and subject employersóreceive ever-increasing quality of services. Key elements of the enhanced system are a revised set of performance objectives, developed in partnership with the States, for which the Department and the States will be held accountable; increased validation of data reported; and revitalized performance planning and improvement processes. In 1996, UIS began efforts to revise and enhance the various components of this closed-loop system as part of the UI PERFORMS initiative. The Department realized it would take several years to implement all changes envisioned; therefore, it phased in changes to the various components as they were completed. Most initial efforts focused on implementing or changing the systemís three principal performance measurement modules. These are the Tax Performance System (TPS) which assesses the timeliness, completeness and accuracy of tax processing operations; the Benefit Accuracy Measurement (BAM) program which assesses accuracy of benefit payments and eventually decisions to deny; and Benefits Timeliness and Accuracy (BTQ) which embraces measurements of the timeliness and quality of benefit claims, payment and appeals operations. The performance indicators in this report are drawn from those systems plus the report on Benefit Payment Control activities.
To assess the state of performance and promote continuous improvement, the two advisory groups which have developed and guided the implementation of the UI PERFORMS system identified over 50 key performance measures. They designated ten of the most important of these as "Tier I" measures and instructed the Department to establish uniform national criteria for them representing minimally acceptable performance. States performing below a criterion would be required to include a corrective action plan in their annual State Quality Service Plan. Persistent performance below a criterion could result in various actions by the Department including the withholding of administrative grants. Because these measures have national criteria, the Tier I measures must be measured consistently and have comparable meanings in all States.
In the fall of 1998 the Department asked the UI system and its stakeholders to comment on nine of the original ten measures, and the national criteria identifying minimally acceptable performance. (See Unemployment Insurance Program Letter (UIPL) 4-99 and Federal Register Notice 63 FR 63544, November 20, 1998). The Department deferred seeking comment on the tenth measure, timeliness of depositing tax contributions into the Clearing Account, until some States could resolve measurement inconsistencies. In the spring of 1999, the Department promulgated the final Tier I measures and their associated criteria by UIPL and Federal Register Notice. Table 1, on page 5, lists the measures, their criteria, and when they become effective. This report includes every Stateís performance on all nine Tier I measures.
For a variety of reasons, the new measures and criteria become effective at various times between the date of issuance of the UIPL and Fiscal Year 2005. The measures and criteria now used to implement the Secretaryís Standards for Initial Claims timeliness and Lower Authority Appeals timeliness cannot be changed until the new UI PERFORMS regulation supersedes the regulations in which they are embodied. Some criteria are being delayed to give States time to raise performance, which is now considerably below the criteria in many States, or to work out measurement irregularities.
The UIPL which implements the new UI PERFORMS Tier I measures also identifies the so-called Tier II performance measures. Although many Tier II measures cover dimensions of performance as significant as Tier I measures, States may differ enough in these areas that the measures have varying meanings from one State to another. Thus, the Department will issue no national criteria for these measures. Instead, the States and the ETA Regional Offices will negotiate performance targets for those being emphasized in the current State Quality Service Plan (SQSP). Many of the performance measures included in this report are Tier II measures. Appendix B lists the complete set of Tier II measures. This report includes State performance on about a third of the Tier II measures.
THE MAIN UNEMPLOYMENT INSURANCE MEASUREMENT SYSTEMS
Most of the UI performance measures use data from one of three measurement subsystems: Benefits Timeliness and Quality, Benefit Accuracy Measurement, and Tax Performance System. These were all developed to give a fuller view of State performance and thus better to permit the Department to exercise its role as a partner in ensuring that claimants and employers receive high-quality UI services.
The Department of Labor, Employment and Training Administration (ETA), Unemployment Insurance Service (UIS) has the responsibility by law, as mandated in Title III of the Social Security Act, for assuring that State Employment Security Agencies (SESAs) operate an effective and efficient unemployment insurance program. Various provisions of Federal law require that certain UI activities be performed promptly and accurately. Section 303(a)(1) of the Social Security Act requires, as a condition of a State's receiving UI administrative grants, "[s]uch methods of administration. . .as are found by the Secretary of Labor to be reasonably calculated to insure full payment of unemployment compensation when due."
| TABLE 1 TIER I MEASURES | Criterion | |||
|---|---|---|---|---|
| Present | FY 2000 | FY 2002 SQSP or New Reg |
FY 2005 | |
| First Payment Timeliness | ||||
| % of 1st Payments within 14/21 days: IntraState UI, full weeks | 87 | 87 | ||
| % of 1st Payments within 35 days: IntraState UI, full weeks | 93 | 93 | ||
| % of 1st Payments within 14/21 days: InterState UI, full weeks | 70 | 70 | ||
| % of 1st Payments within 35 days: InterState UI, full weeks | 78 | 78 | ||
| % of 1st Payments within 14/21 days: Intra + Inter State UI, UCFE, UCX Programs, full + partial weeks |
90 | 90 | ||
| % of 1st Payments within 35 days: Intra + Inter State UI, UCFE, UCX Programs, full + partial weeks |
95 | 95 | ||
| Nonmonetary Determinations | ||||
| % of Separation Issues determined within 21 days of Detection Date (Intra + Inter State UI, UCFE, UCX) |
80 | 80 | ||
| % of Nonseparation Issues determined within 14 days of Detection Date (Intra + Inter State UI, UCFE, UCX) |
80 | 80 | ||
| % of Separation and Nonseparation Determinations with Quality Scores >80 points | 75 | 75 | ||
| Appeals | ||||
| % of Lower Authority Appeals decided within 30 Days of Filing | 60 | 60 | 60 | 60 |
| % of Lower Authority Appeals decided within 45 Days of Filing | 80 | 80 | 85 | 85 |
| % of Lower Authority Appeals decided within 90 Days of Filing | 95 | 95 | ||
| % of Higher Authority Appeals decided within 45 Days of Filing | 50 | 50 | 50 | |
| % of Higher Authority Appeals decided within 75 Days of Filing | 80 | 80 | 80 | |
| % of Higher Authority Appeals decided within 150 Days of Filing | 95 | 95 | 95 | |
| % of Lower Authority Appeals with Quality Scores at least 85% of potential points |
80 | 80 | 80 | |
| Tax/Cash Management | ||||
| % of New Status Determinations within 90 days of Quarter End Date | 60 | 60 | 60 | |
| % of New Status Determinations within 180 days of Quarter End Date | 80 | 80 | 80 | |
| Acceptance Sample for Accuracy of 60 New Status Determinations --Pass with No More than 6 Failed Cases |
Pass | Pass | ||
| Days Worth of Deposits in Clearing Account before Transfer to UTF | <= 2 | |||
| Ratio of average daily loanable balance in Clearing Account to Avg. daily Transfer to UT |
<= 1.75 | <= 1.0 | ||
The UI PERFORMS measures computed using data from the BTQ, BAM, TPS and other administrative data systems represent the Departmentís continuing effort to provide ever more accurate and useful information on the functioning of all UI program activities. These systems are designed and managed with certain considerations in mind, primarily:
Benefit Accuracy Measurement System
The UI Benefit Accuracy Measurement (BAM) program, formerly Benefits Quality Control (BQC), became mandatory in the fifty States, the District of Columbia, and Puerto Rico on October 5, 1987, for operation in calendar year (CY) 1988. This is the eleventh year for which calendar year data from the program have been published.
BAM is a diagnostic tool used to identify payment errors and measure the effect of previously initiated corrective actions. BAM is based on random samples of UI payments. The sampling procedures are designed to produce samples that are representative of a State's universe of paid UI claims. Each sample represents one compensated week of benefits. Each case in the sample is thoroughly reviewed for compliance with the State's UI laws, regulations, policies, and operating procedures. BAMís premise is that dollars overpaid and underpaid can be estimated by projecting the results from a State's BAM sample to its entire population of payments. The BAM program gathers information to assist States in developing program improvement plans to correct problems in their UI benefit payment systems and to enable them to measure the effects of implementing those plans. States also use this information in implementing policies to ensure accurate administration of their laws, regulations, and operating procedures.
The Department has one overriding goal for BAM: to ensure that the UI program operates with the highest degree of accuracy attainable within available administrative resources. The BAM methodology is a sound means for measuring the accuracy of State UI administration, and thus, BAM is an integral part of the Secretary's oversight system. It is the major vehicle by which the Department oversees the accuracy of State UI benefit payments.
Readers are strongly cautioned that it may be misleading to c ompare one State ís BAM overpayment and underpayment rates with those of other States. No two Statesí written laws, regulations, or policies specifying eligibility conditions are identical, and differences in these conditions influence the potential for error. States with stringent, complex provisions will tend to have higher overpayment rates than those with simpler, more straightforward provisions, for example.
Program Development. The basic concept of intensive investigations of small but representative samples of cases was first applied to UI in the late 1970s. A National Commission on Unemployment Compensation (NCUC) study in six metropolitan areas revealed that the "true error rate" of UI payments in the test sites was several times higher than that reported by the measurement systems then in place. One important conclusion was that field verifications must supplement desk reviews to accurately estimate the UI payment error rate. The Department applied the approach, now called Random Audit (RA), at the State level and by 1984, 46 States operated RA programs.
In the summer of 1983, an Interagency Benefit Payment Oversight Committee reviewed the findings from RA and other systems for measuring and correcting payment errors in the UI system and recommended that the Department establish a UI Quality Control program. After developmental work and policy review, most States began implementing the Benefits Quality Control (BQC) program on a voluntary basis in April 1986. The BQC program was established by regulation on September 3, 1987.
In July 1993, following a period of pilot testing, States were permitted to conduct certain portions of the field verifications by mail, telephone and fax instead of in person. In 1996, the Department began implementing other changes to BAM recommended by the Performance Enhancement Workgroup (PEWG). The programís name was changed to Benefit Accuracy Measurement from Benefits Quality Control, and States no longer were required to release their annual error rates to the public media. On January 1, 1997, allocated annual sample sizes were reduced to 360 in the ten smallest States and 480 in the rest, and States were given the option of conducting all aspects of verifications by mail, phone and fax. The Department also began designing a pilot test of the use of the BAM methodology to determine the accuracy of decisions denying eligibility.
Program Scope. BAM covers the three largest permanently authorized unemployment compensation (UC) programs: regular State UI (including benefits paid on the basis of combining wages), the federally-funded Unemployment Compensation for Federal Employees, and Unemployment Compensation for Ex-service members. Together, these programs accounted for 92.8% of benefit outlays in CY 1997. The BAM sample does not include UC benefits paid under Trade Adjustment Assistance, Disaster Unemployment Assistance, the interstate arrangement, or any Federal extended benefits program.
Although denied claims and appeals are not directly investigated, the BAM universe includes approximately 86% of all decisions. BAM covers monetary, separation, and nonmonetary/nonseparation issues which affect the claimant's eligibility for benefits but directly samples only those which the agency decided to pay. The BAM underpayment rate is based on payments which are less than the amount the claimant should have received. BAM underestimates the underpayment rate because erroneously denied claims are not identified. A successful 5-State pilot test of applying the BAM methodology to measuring denied claim accuracy (including claims filed on an interstate basis) concluded in September 1998. The Department intends to include some denial decisions in the BAM program in 2000. The quality, including the accuracy, of benefit appeal decisions is reviewed and assessed quarterly under the BTQ system. There is no plan to incorporate appeal decisions into BAM.
CY 1998 Sample Size. The States received sufficient resources to investigate a total of 23,760 cases in CY 1998. Individual State sample sizes varied, with the ten smallest States receiving resources to investigate a sample of 360, and the 42 larger States receiving resources to investigate a sample of 480, cases per year. Some States chose to draw larger samples, and 26,353 cases were completed in CY 1998, an average of 507 cases per State.
Data Collected. BAM investigators compile a data record on each case consisting of up to 116 required elements and any additional elements defined and collected at each State's discretion. Since all States have computerized records on weeks compensated, many of the data elements can be transferred from the stateís mainframe database directly to the BAM computer record at the time the case is selected for investigation. This both reduces coding time and minimizes coding and data entry errors.
Most elements pertain directly to UI eligibility, relating to the claimantís benefit history, base period work, monetary eligibility, reason for separation, ability to work, availability for work, and work search effort. Data on age, sex, and ethnic classification are gathered to verify the representativeness of the BAM samples. The data record concludes with elements related to error classification, including type of error (if any), amount of error, the responsible party, the cause, and the point of detection. Multiple errors can be detected in the course of one BAM case investigation and documented in the database.
The Department provides each State with computer hardware and software to store, retrieve, and analyze its own BAM data. States also have received remote terminals, printers, and modems so that outstationed investigators can enter case information directly in the BAM computer record.
Data Collection Methodology. The BAM investigator obtains information pertaining to the monetary, separation, and continuing eligibility issues for the payment selected, and various claimant characteristics. This is done through in-person and telephone contacts with the claimant, various employers, and third parties such as labor unions and employment agencies identified by the claimant. This information is compared to agency records to determine its impact on the accuracy of the payment received by the claimant. The BAM investigation also determines whether decisions conformed to State law, policy, and procedures.
Benefits Timeliness and Quality
Development. The existing Benefits Timeliness and Quality (BTQ) measurement suite is a lineal descendent of the Quality Appraisal measures. These were initially developed in 1975 by a Federal-State task force. It developed a comprehensive system called the Performance Appraisal Package after considering all existing performance and promptness measures.
The Performance Appraisal consisted of three measurement systems: "A Performance Based Quality Control Program for Nonmonetary Adjudication" (known as QPI), the Appeals Quality Package, and portions of a State UI Self Appraisal. The results of the new appraisals were reviewed by the National Office together with States and Regional Offices, and Desired Levels of Achievement (DLAs) were established for many of the activities reviewed. DLAs were first established for Fiscal Year 1978 and were revised along with the evaluation package, which was renamed "UI Quality Appraisal" in 1979. The DLAs were used to supplement the Secretary's Standards to measure the quality of State operations. Secretary's Standards are mandated in two areas: timeliness of processing lower authority appeals (20 CFR 650) and timeliness of intrastate and interstate first benefit payments (20 CFR Part 640).
The results of the UI Quality Appraisal of all major UI State program activities, reviewed by Regional and National Offices, were distributed to each State to be used in the State Annual Program and Budget Plan (PBP). The data also were published in a UI Quality Appraisal annual report. This mode of presentation served more than one purpose. It indicated levels of performance, absolutely and relative to other States, and by giving performance relative to Secretary's Standards or DLAs it also served as the document of record for determining whether corrective actions plans had to be included in the annual Program Budget Plan submitted by each State.
Because technological changes in SESA operations had made new systems of oversight both possible and necessary, the Department of Labor (DOL) initiated the Performance Measurement Review (PMR) project in 1988 to review and improve the Quality Appraisal measures. The QA process had not been subjected to in-depth review since the mid-1970's. Increasing use of automated and electronic systems, and other operational changes, had transformed the delivery of UI services to the public.
PMR was designed and completed in three phases. The first phase consisted of the analysis of existing benefits time lapse and quality measures to determine their legislative basis and to identify gaps or overlaps in measurement areas, the development of new or revised measures, and the design for a field test of selected measures. State and Federal UI representatives carefully defined time lapse measures and quality measures covering benefit payments, nonmonetary determinations, and lower and higher authority appeals.
In the second phase of the project, six States conducted a 15-month field test of reporting data for the time lapse and quality measures. The evaluation showed that the new measures and the software developed for analysis of results could yield meaningful and statistically valid information in a cost-effective manner.
The third phase involved nationwide implementation of the new benefits time lapse and quality measures as a part of the new closed-loop management system, UI PERFORMS, which was implemented in UI in 1996. The nonmonetary promptness measure, implemented using the detection date of an issue on a claim as the starting point, was not field tested, but was included for implementation at the recommendation of the State-Federal Performance Enhancement Work Group after completion of the field test.
The new measures were embodied in a new "9050" series of reports. These new reports required programming changes in every State to allow reporting of all the measures with their new definitions and new intervals. State implementation of BTQ began with the quality reviews of nonmonetary determinations and lower authority appeals. After creating the universes for sampling, they drew the first samples in October 1996 for the quarter ending September 30, 1996. In January 1997 States began collecting the data from which the timeliness measures are calculated.
Changes in Reporting for Timeliness. The new timeliness measures incorporate changes designed to improve performance measurement in several ways.
Changes in Quality Assessment. Measures based on samples are used to track the quality of SESA nonmonetary determinations and lower authority appeals. The BTQ system made the following changes designed to improve overall assessment:
Benefit Payment Control
The PMR initiative was originally intended to review Benefit Payment Control (BPC) measures, but they were deferred in Phase I. In 1996, a Federal-State workgroup developed 10 measures which were field-tested in three States. In 1998, the UIS circulated two of the tested measures for comment to the UI system but neither received strong support. Until revised measures are implemented, the Department will continue to report the BPC measures for which the Quality Appraisal system specified DLAs. These are the proportions of both fraud and nonfraud overpayments established in the current period which the agency collected.
Tax Peformance System
Development. The Department developed the Tax Performance System (TPS) to assist in exercising its general oversight responsibilities toward the UI program and to help meet its responsibility to protect and maintain the soundness of the Unemployment Trust Fund. At the time the Department began the development of the Benefits Quality Control (BQC) program in 1983, tax oversight consisted principally of review of data reported on the ETA 581 (Contribution Operations) report and periodic program reviews, and reviews of Trust Fund operations. The annual Quality Appraisal Results included indicators for which DLAs had been set: Status Determinations Promptness; Field Audit Penetration; Report Delinquency; Collections Promptness; Promptness of Deposit to the Clearing Account; and two Trust Fund deposit transfer timeliness measures. There was also a measure of field audit performance with no DLA. The long-term Quality Control program design envisioned a tax component.
In 1988 a Revenue Quality Control (RQC) Task Force comprising a small Federal staff assisted by State tax specialists was established to design a quality control program for tax operations. In 1990, the basic system, called Core RQC, was pretested in eight States. In the next two years, eight other States formally pilot tested the RQC approach. In 1993, 49 States began implementing the RQC design voluntarily. Mandatory implementation began in 1995 with changes to the form ETA 581, to obtain data needed for the new Computed Measures. All States implemented all aspects of RQC in January 1996. RQC was later renamed the Tax Performance System.
Methodology. The TPS approach divides tax operation into major functional components. For each function, it specifies key performance objectives based on three basic dimensions of quality: timeliness, accuracy, and completeness. There are performance indicators to measure the attainment of each objective. Measures and review techniques were selected to emphasize quality, cost-effectiveness, and reliance on data obtained as a by-product of ongoing program operations. Because TPS was designed to provide information which tax units can use directly to guide program improvement, it also seeks to gather and disseminate information on best practices in addition to methods for identifying weaknesses. The complete TPS "package" has three assessment components: (1) for timeliness and completeness, Computed Measures; (2) for accuracy, Program Reviews; and (3) to identify best practices, Methods Surveys.
Table 2 shows the methodologies used to review the various tax functions. The combination of Computed Measures, System Reviews, Acceptance Samples, and Methods Surveys is shown in detail to present a well-rounded assessment of each function.
Timeliness and Completeness. Most of the information on timeliness and completeness of UI tax functions were taken from program data obtained from the key tax report, ETA 581. These indices are termed "Computed Measures". The ETA 581 report was revised to ensure that States collected the data for calculating the computed measures.
Accuracy. The Benefits Quality Control model for measuring accuracyóreviewing large samples of end products was found to be expensive and difficult to apply in the tax environment. Instead, a two-step methodology based on financial and program audits was developed, which TPS terms Program Review.
TABLE 2
REVIEW METHODOLOGIES
| TAX FUNCTION | COMPUTED MEASURES |
PROGRAM REVIEW Sys Rev & Sampling |
METHODS SURVEY |
|---|---|---|---|
| STATUS DETERMINATION | X | X | X |
| CASHIERING | X | ||
| REPORT DELINQUENCY | X | X | X |
| COLLECTIONS | X | X | X |
| FIELD AUDIT | X | X | X |
| ACCOUNT MAINTENANCE | X |
The combination of a thorough front-end review and a small acceptance sample efficiently establishes a reasonable assurance of accuracy, directly identifies any areas of program weakness, and immediately indicates where program improvements are needed. If there is a need to know the actual level of a particular tax function's problem, the Acceptance Sample can be readily expanded into a much larger Estimation Sample.
Best Practices. To identify best practices in several tax functions, TPS has designed Methods Surveys. States are required to complete these†every four years. Plans are underway to compile and distribute information on best practices to States and Regions.
This Tax Performance System section of the UI PERFORMS Annual Report for CY 1998 presents only data from the Computed Measures and Acceptance Samples because the System Reviews' examination of State internal controls contains too much detail to present in a brief format without distortion. In addition, Systems Reviews are intended largely to guide State program and Regional staff. Data from Methods Surveys will be compiled and analyzed later, as the necessary programming is delayed because of year 2000 priorities. However, the combination of Computed Measures and Acceptance Sample results provides a concise overview of the quality of State tax operations.
This chapter is divided into three main sections. The first section presents a brief overview of the recent economic conditions and the resultant movement in certain UI tax and benefit activities. The second shows the movement of major benefit payment activities and then reviews the national pattern of selected key benefit payment performance indicators. The third section approaches tax activities in the same way.
ECONOMIC ACTIVITY AND MAJOR PROGRAM ACTIVITIES
The labor market in 1998 achieved levels of tightness not seen for some three decades, as the total unemployment rate fell to an average of 4.5% and the insured unemployment rate (IUR) to 1.6%. The total unemployment rate has been declining steadily since the most recent recession high of 7.5% in 1992.
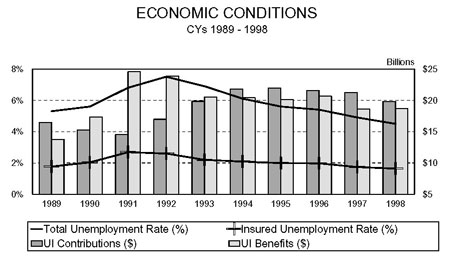
The movement in the IUR, which peaked in 1991, has been less pronounced. The peak in the IUR coincides with the peak in benefit payments in 1991 at nearly $25 billion. Benefit payments have since fallen to about $19 billion in 1998. Contributions, on the other hand, reached their 10-year low in 1991 at about $14 billion and rose to a high of over $22 billion in 1994 and 1995 before dropping to under $20 billion in 1998.
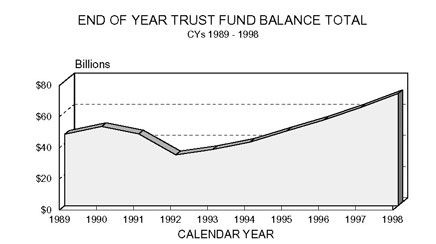
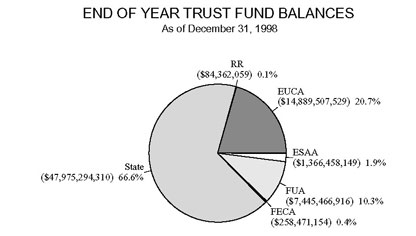
December 31 trust fund balances have risen steadily since their decade low in 1992 as States took advantage of improving conditions to replenish their funds. On December 31, 1998, balances in the UI trust fund reached $72 Billion. Of this, State accounts constituted two thirds and the Extended Unemployment Compensation Account (EUCA) one fifth.
The cost of administering the UI program is expressed as cents per dollar of benefits paid or of taxes collected. Tax activity tends to vary little over the business cycle and hence the cost is quite stable. Benefit payment levels fluctuate much more widely over the cycle than the funds States receive to administer them, causing the benefit cost to vary inversely with the economic cycle.

BENEFIT PAYMENT ACTIVITY
In 1998, unemployment insurance offices handled approximately 11 million new initial claims under the regular State UI, UCFE, and UCX programs. Approximately 4 million claimants were determined to be ineligible for monetary or separation reasons, or found new jobs before filing a first week claimed, so that ultimately about 7 million claimants actually received a first payment. This compares with the 14 million new initial claims filed, and 9 million first payments made, in the recession year 1991. Additional initial claims, over the same period, track first payments closely because they represent occasions when claimantsí benefit payment series were broken by intervening spells of employment. Each additional initial claim filed to resume benefit payments requires the agency to review the reason for separation (but not the monetary eligibility) and may lead to the identification and adjudication of a separation issue.
More striking than the movement in initial claims has been the path of continued weeks claimed. Continued weeks claims depend both on the number of first payments and on the average number of claims filed per benefit year, also called the "average duration."
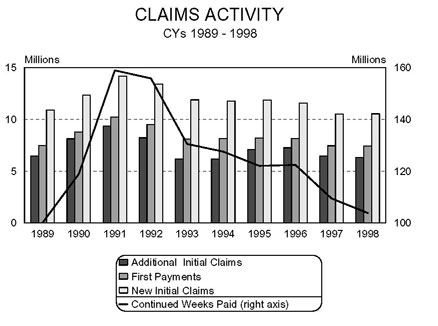
Economic conditions drive both components of weeks claimed. After reaching a high of 160 million weeks during 1991, the number has fallen sharply to about 105 million in 1998. The great majority of claims filed, and payments made, in any year are intrastate made under the regular State UI program. Table 3 indicates the relative magnitudes of both first payment and continued weeks paid by program in 1998. Overall, interstate claims (State, UCFE, and UCX) constitute only about 3% of all first payments and about 4% of continued weeks paid.
The regular State UI first payments are about 98.7% of the total, UCFE 0.7%, and UCX the remaining 0.6%. About one eighth of first payments, and one twelfth of continued payments, were made for partial and part-total weeks claimed. These shares differ little from one year to the next.
TABLE 3
| FIRST PAYMENTS WORKLOAD | CONTINUED WEEKS PAID WORKLOAD | |||||
|---|---|---|---|---|---|---|
| FULL | PARTIAL | TOTAL | FULL | PARTIAL | TOTAL | |
| INTERSTATE | 208,564 | 12,557 | 221,121 | 3,592,109 | 187,502 | 3,779,611 |
| - STATE UI | 203,625 | 12,366 | 215,991 | 3,476,066 | 179,883 | 3,655,949 |
| - UCFE | 3,748 | 123 | 3,871 | 68,436 | 4,361 | 72,797 |
| - UCX | 1,191 | 68 | 1,259 | 47,607 | 3,258 | 50,865 |
| INTRASTATE | 6,048,157 | 882,690 | 6,930,847 | 81,399,198 | 7,386,244 | 88,785,442 |
| - STATE UI | 5,964,276 | 877,237 | 6,841,513 | 80,066,492 | 7,289,670 | 87,356,162 |
| - UCFE | 41,760 | 3,159 | 44,919 | 735,249 | 55,961 | 791,210 |
| - UCX | 42,121 | 2,294 | 44,415 | 597,457 | 40,613 | 638,070 |
| TOTALS | 6,256,721 | 895,247 | 7,151,968 | 84,991,307 | 7,573,746 | 92,565,053 |
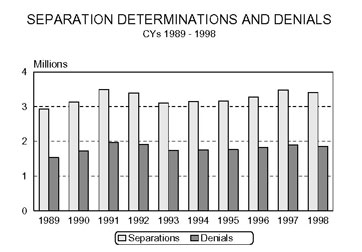
Although separation and nonseparation determinations both follow economic conditions, the relationship to their underlying claims series is not constant. Separation determinations are driven by the combination of new and additional initial claims. Although those claims have fallen since 1995, the number of separation issues adjudicated was actually higher in 1998 than in 1995. The reason is probably to be found in the fact that in good economic times, "clean" lackof- work claims are a smaller proportion of total claims than in recessions.
The same general pattern may be seen for nonseparation determinations, which depend on the number of weeks claimed. Nonseparation determinations declined along with continued weeks claimed from 1991 to 1994 but rose until they hit a peak of over 4.5 million in 1997 despite the continued declines in weeks claimed.
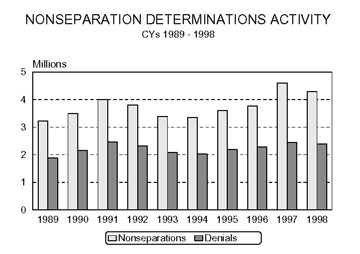
Buoyant economic times give claimants greater opportunities to work while claiming benefits, giving rise to a greater proportion of claims with nonseparation issues.
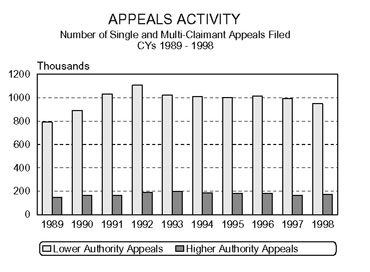
Most appeals are filed by claimants, upon receiving a denial for either separation or nonseparation reasons. Slightly over half of all nonmonetary determinations result in a denial. In 1998, about 4.2 million nonmonetary determinations, 55% of the total, were denied. About one in four (in 1998: 23%) went to a first level appeal, and of those about 18% went to a higher-authority appeal. Since 1991, the number of lower-authority appeals filed has remained quite constant, about one million a year, with only a slight increase to 1.1 million in the recession year 1992 and a slight drop to 950,000 in 1998. Higher authority appeals have displayed a gentle downturn since their peak in 1993.
BENEFIT PAYMENT PERFORMANCE
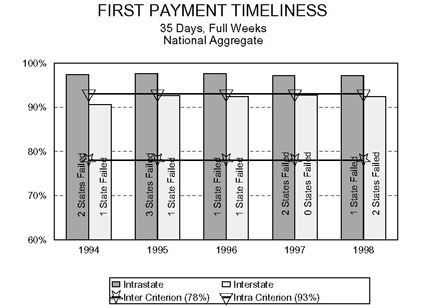
First Payment Timeliness
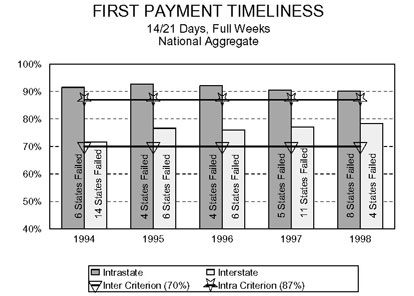
One of the UI systemís flagship measures is first payment time lapse. Criteria, set on a measure of the timeliness of full weeks of unemployment only, have been set to implement Secretaryís Standards for first payments made within 14/21 days and 35 days for both intrastate and interstate payments since 1978. At the 14/21 day level, aggregate timeliness performance reached its peak in 1995 and has drifted down slightly since for intrastate payments, while interstate performance has trended upward.
The charts show that the aggregate performance can be a misleading indicator of the number of States failing to meet the Secretaryís criteria. The number of states missing the criteria fluctuates much more widely than the aggregate.
For 35-day performance, the overall pattern is the same, with intrastate performance trending down slightly since 1995; intrastate performance jumped up from 1994 to 1995 and has been flat since. At both levels, aggregate performance is comfortably above the criteria.
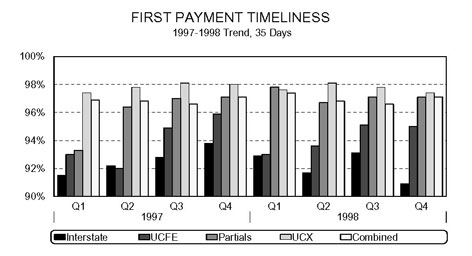
In July 1999 the Department issued the new the UI PERFORMS performance criteria (see introduction for the criteria and their effective dates). New 14/21-day and 35-day criteria based on a combined measure will replace the old criteria illustrated above when the new UI PERFORMS regulation becomes effective. The new measure will combine all first payments for partial as well as full weeks, intrastate and interstate payments, and payments made under the UCFE and UCX programs as well as State UI. The next two charts show 1998 performance under this combined measure, and illustrate the performance of the combined measures's various components other than the dominant intrastate, full weeks, State UI element.

In 1998, aggregate performance under the combined measure was about 5 percentage points below the Secretaryís Standard measure at 14/21 days, pulled down by all its new components. However, the differences are virtually nil at 35 days.

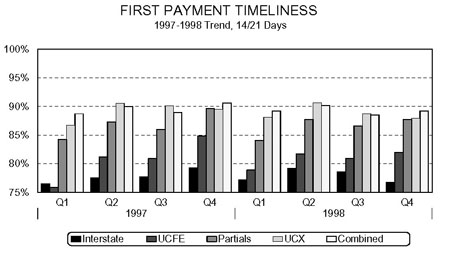
Time lapse performance is highly seasonal. Performance at the 14/21-day level tends to be lowest in the first and third calendar quarters and highest in the second quarter for most components. The second and third quarters tend to be lowest at 35 days.
Continued Weeks Timeliness
Overall, States paid over 60% of continued claims within 7 days in 1998, and over 90% within two weeks. Average performance at 7 and 14 days for partial weeks has run about 5 percentage points below the aggregate for the last two years.

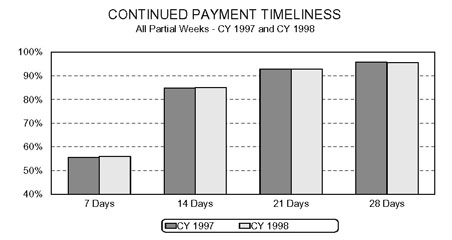
In contrast to first payment time lapse, continued weeks payment time lapse has virtually no seasonality. Time lapse performance for both intrastate and interstate payments exhibited a gentle upward trend throughout all the quarters of 1997 and 1998, due apparently to improvements in performance among the worst-performing States.
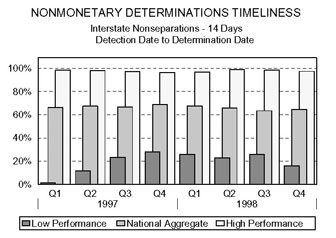
Nonmonetary Determinations Timeliness
Aggregate separation performance--the percent of separation determinations made within 21 days of the date the State detected an issue--lay below the 80% criterion which will go into effect in Fiscal Year 2002.
Aggregate performance was worse during 1998 than 1997 and has trended down each quarters since its peak in 1997:2. It does appear that performance in the worst state is improving, however.

Aggregate performance on the claim interstate component--interstate performance is traditionally lower than intrastate for most measures--is quite similar to the criterioned aggregate measure, except for the worst-performing State, where it is noticeably lower than the aggregate. There is no obvious seasonal pattern to nonmonetary time lapse.
For nonseparation determinations, aggregate performance has run about 10 percentage points below the 80% within 14-day criterion throughout both 1997 and 1998. Like separation time lapse, it has also worsened slightly during 1998. There is about a 60-point difference in performance between the bestand worst-performing State.
As with separations, the performance on interstate nonseparation determinations has declined slightly from 1997 to 1998 and lies slightly below the aggregate measure.
The adjacent chart shows the pattern of decision time lapse for issuing both kinds of determinations at different intervals in 1998. Nearly half of nonseparation issues were decided within the first week after detection, versus only 15% of separations (nearly all separations require obtaining information from employers). The percentage of nonseparation determinations exceeded those for separations at the 14-day interval (the nonsep criterion interval) and 21-day interval (the separation criterion interval). At 28 days and longer, States had issued a higher percentage of separations than nonseparation. By 35 days, they have made more than 90% of both kinds of determinations.
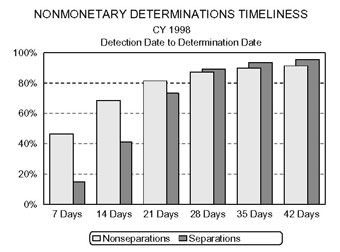
States reported that they detected separation issues much earlier than nonseparation issues in 1998. Over 90% of separation issues were detected within 21 days, whereas by 42 days, they had detected less than 85% of nonseparation issues.

Appeals Timeliness
Appeals performance is one of the most cyclically sensitive UI activities and thus has benefited from the decline in unemployment rates. However, the improvement has been reflected much more in the number of States passing the criteria than in the aggregate performance. Throughout the past five years, the aggregate percentage of appeals decided within 30 days rose from 68% in 1994 to about 71% in both 1995 and 1996, but has since dropped to under 70% again.
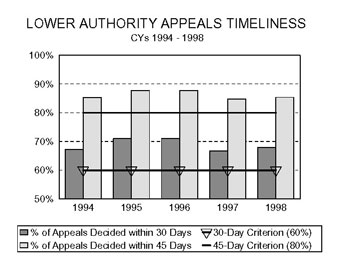
The percentage of appeals decided within 45 days followed the same pattern so that both series show no trend. The number of States passing the Secretary's criteria shows a down trend more in keeping with the improvement in economic conditions.

The past five years have also shown regular improvement in Higher Authority time lapse. The rise in aggregate time lapse has been accompanied by regular declines in the number of States that would have failed to meet the new Tier I criteria established in 1999.

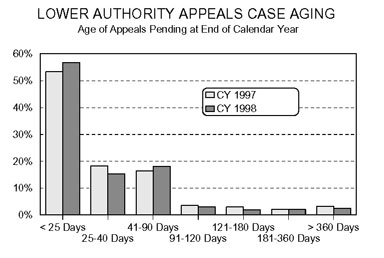
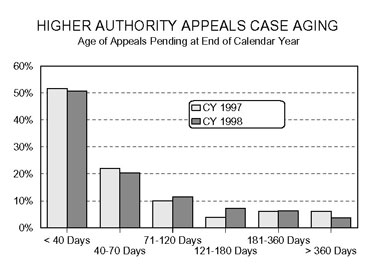
Supplementing the measures of how quickly States decide appeals is the age of undecided or pending appeals at the end of the year. The chart below shows that at the end of 1998, 57% of all undecided Lower Authority appeals had been filed less than 25 days ago (and hence were still likely to be decided within the first time lapse interval of 30 days). Further, this was an improvement over the 53% less than 25 days old at the end of 1997. The percentages of very old (91+ days) undecided appeals also declined slightly between 1997 and 1998.
The pattern is different for Higher Authority Appeals; the shares of appeals still able to meet time lapse (<40 and 40-70 days) rose slightly from 1997 to 1998, with corresponding increases in the shares at all longer age categories except for the last one of >360 days.
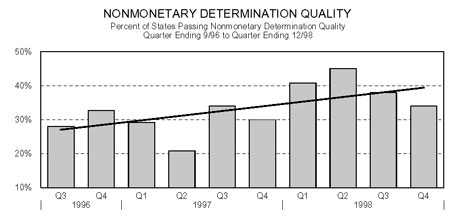
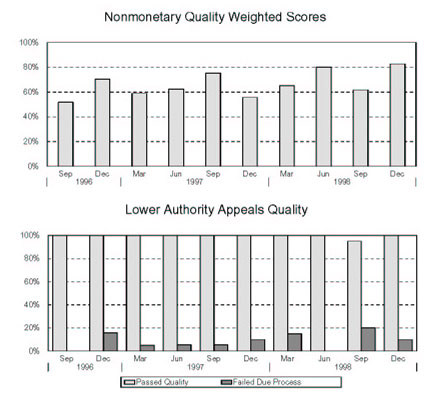
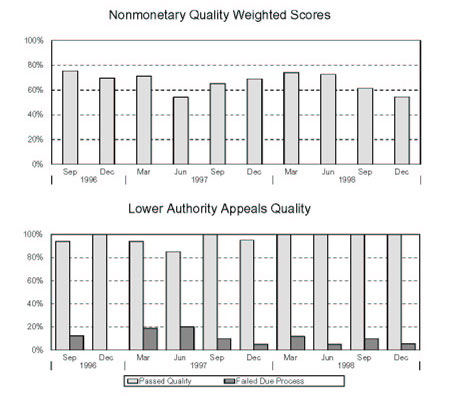
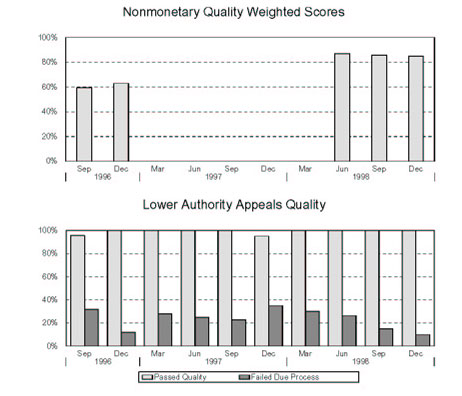
Nonmonetary Determinations Quality
The chart below shows that nonmon quality improved considerably between 1997 and 1998. The percentage of cases with passing quality scores (greater than 80 points) jumped from about 29% to nearly 40%.

The percentage of States that would have passed the new Tier I criterion--75% or more of their cases have scores of over 80 points--trended upward since the first quality samples were drawn and evaluated for the third quarter of 1996.
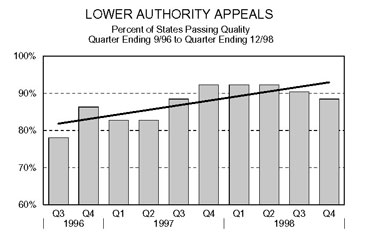
Lower Authority Appeals Quality
UI PERFORMS established a new Tier I performance criterion for appeals quality: 80 percent of appeals must pass with at least 85% of potential points. The scores of the due process subset of rating elements are also tabulated. For a case to pass the due process evaluation every element must be scored satisfactory.
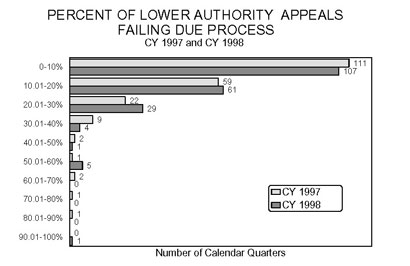
The lower chart shows the number of number of States' quarterly samples in 1997 and 1998 grouped by the percentages of cases failing due process. In 1997, there were both more quarters with 10% or fewer failing cases (111) and more than 30% (16) than in 1998 (107 and 11, respectively).
Benefit Accuracy Measurement Error Rates
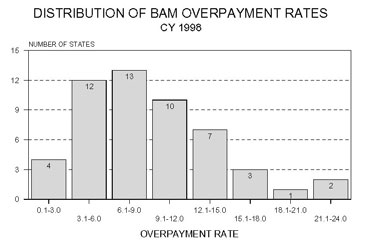
In Calendar Year 1998, the weighted BAM overpayment rate was 8.5%, and the underpayment rate was 0.9%, of benefits paid. Chart 35 illustrates that when first reported, for 1988, the rate exceeded 10%; it declined regularly to 7.5% in 1991, and since then it has stayed in the narrow range of 8% to 8.8%. Underpayments have been approximately 0.9% of benefits every year. Dollars overpaid have been approximately $1.6 billion each year since 1995.

In 1998, four states reported overpayment rates of 3% or less and three over 18%.

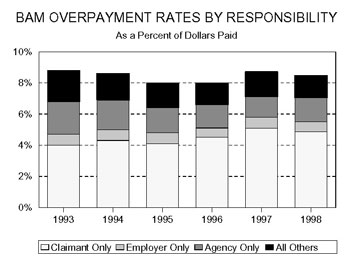
The largest cause of dollars overpaid in 1998 was Benefit Year Earnings violations--failing to report all or part of moneys earned while claiming benefits during the key week--followed by separations violations and then work search. The same pattern prevailed in 1997. Claimant errors were responsible for about 60% of overpayment errors, with claimants and the agency jointly responsible for another fifth.
Benefit Payment Control Recovery Performance
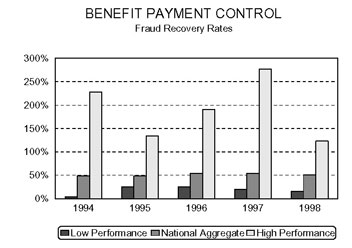
States reported that they recovered approximately 50% of the fraud overpayments they established in 1998, and about 55% of the nonfraud overpayments established. Although the aggregate recovery rate has been quite steady since 1994, the rate of the lowestperforming state has improved considerably for both fraud and nonfraud cases, and has risen steadily each year for nonfraud overpayments.

TAX PROGRAM ACTIVITY AND PERFORMANCE
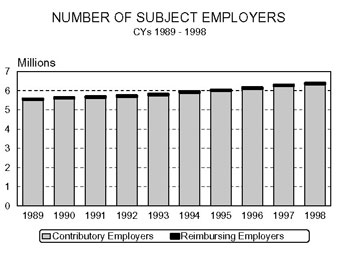
The number of subject employers has grown fairly steadily at a rate of about 1.5% a year since 1989 to a total of 6.4 million in 1998. Of these, about 6.3 million, or 98% were contributory.
The slow, steady annual growth conceals considerable turnover. Measured by status determination activity, turnover is quite high. Each year since 1994, new accounts and inactivations/terminations each amounted to about 13% of liable employers, and successorships close to 3%.

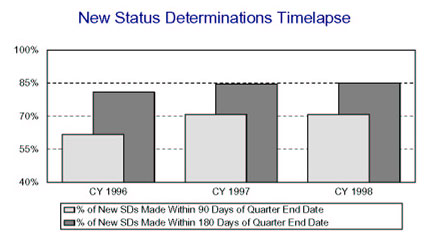
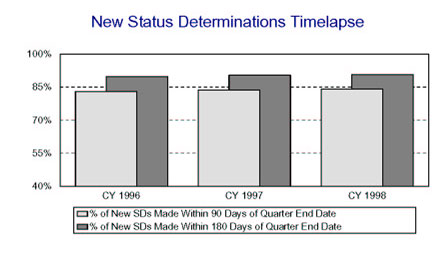
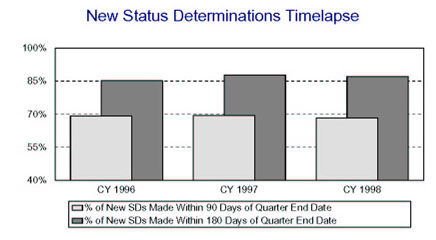
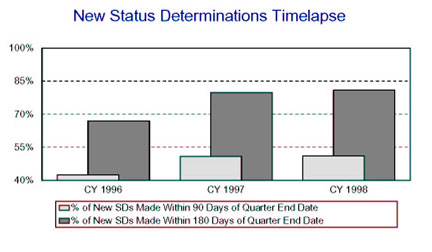
Status Determinations
State performance on both new and successor status determinations has remained quite stable since 1996. Nationally, they make nearly 80% of new determinations within 90 days, well above the new criterion of 60%, and about 90% within 180 days, also well over the new 180-day criterion. Successor timeliness is slower but has improved each year.
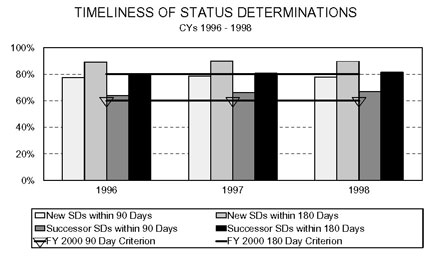
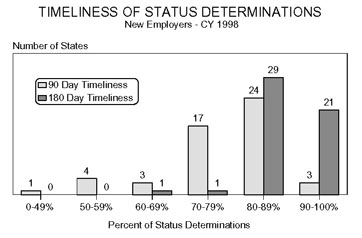
However, five States wouldhave failed to meet the 60-day criterion, and three the 180-day mark, in 1998, while two out of five States made all new determinations within 180 days.
States have not improved the accuracy of their status determinations since 1996. The number of States passing the new and successor acceptance samples has been flat at about 50% and 58%, respectively, while the number passing for terminations/inactivations has declined each year.

(Because the recently-announced Tier I criterion for the New Determinations accuracy is based on six allowable failures out of 60 instead of the present two, performance against that criterion would have been better than the figure shows.) The same pattern of declining accuracy holds for the posting of status findings.

Report Delinquency
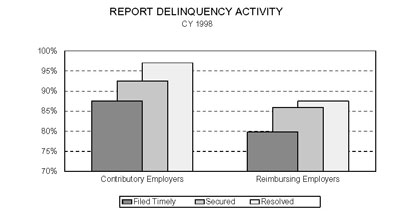
State receive more reports on time, and secure or resolve more delinquent reports, from contributory employers than from reimbursing. Over the last three years, there has been no noticeable pattern of improvement or decline in average timely reporting among contributory employers, although the performance of the best State has improved and that of the worstperforming State has worsened.

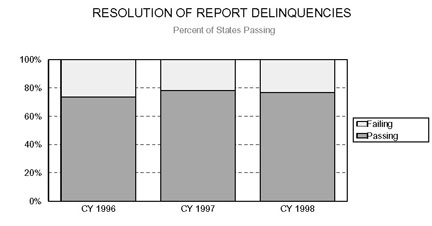
The number of States passing the acceptance sample for quality in delinquent reports operations improved from 1996 to 1997 and has held its level in 1998.
Collections
Just as with reporting, contributory employers are considerably more likely (92% to 81%) to pay due amounts on time than reimbursing.

Although the rates of turnover of delinquent amounts are about the same, States write off or declare doubtful about twice the proportions of unpaid amounts for reimbursing employers as for contributory.

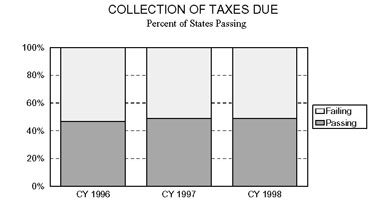
The proportion of total contributory employers taxes due paid timely was higher in 1998 than in 1996, and much higher than in 1997. Although there has been slight improvement from 1996 to 1998, only about half the States pass the acceptance sample for quality operation of the collections function.
Field Audit
In 1998, States audited about 2% of contributory employers. About two in five resulted in some change in the audited employerís liability or taxes due.

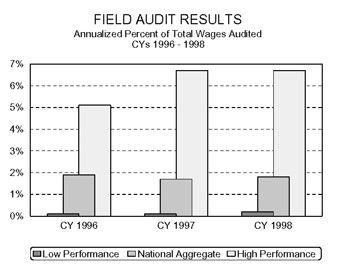
The aggregate penetration of wages is slightly lower than of employers. This suggests that on the whole, many smaller-than-average firms are selected for audit.
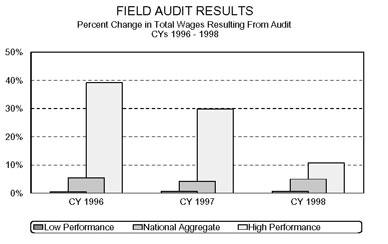
State performance in audit penetration varies considerably: the high State attains a penetration rate of wages which is about three times the average, and the low State about one tenth of the average. For the country as a whole, these audits resulted in a change of about 5% in aggregate wages in 1998, about the same result as in the two previous years. As with wage penetration, the range among States has always been considerable, from the lowest State reporting about 1% of wages changed due to audits to the highest of about 11% in 1998. The reported range was much greater in 1996 and 1997, because of changes reported by the highestchange States.
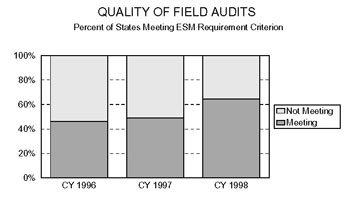
Field audit acceptance sample results have improved noticeably since 1996. In 1996, fewer than 50% passed the acceptance sample for satisfaction of Employment Security Manual audit requirements; by 1998, this had risen to about two thirds.
Account Maintenance
Calendar Year 1998 acceptance sample results show declining performance in the accuracy of most tax functions. The accuracy of field audits improved significantly from previous years.

The Calendar Year 1998 UI PERFORMS results, including data from the Benefit Accuracy Measurement, Benefits Timeliness and Quality , and the Tax Performance System programs, are displayed in a four-page format, individually, for each state. The display includes all Tier I measures and many Tier II measures. The corresponding national data is given as a means of comparison. Additionally, nonmonetary and lower authority appeals quality, and new status determination timeliness are displayed graphically.
The following symbols are used in the State reports:
* State did not report data as of 8/4/99.
** State had a problem in establishing the sample universe.
^ State did not participate in the program.
+ State does not have higher authority appeals.
A description of the footnotes referred to in the Benefit Accuracy Measurement section of the tabular display can be found in Appendix A.
| REPORTED MEASURE | WORKLOAD | STATE RESULTS |
NATIONAL RESULTS |
CRITERION |
|---|---|---|---|---|
| First Payment Timeliness | ||||
| Intrastate UI, full weeks - 14/21 Days | 113,569 | 96.7% | 90.1% | 87% |
| Intrastate UI, full weeks - 35 Days | 113,569 | 98.8% | 97.2% | 93% |
| Interstate UI, full weeks - 14/21 Days | 1,730 | 85.0% | 78.4% | 70% |
| Interstate UI, full weeks - 35 Days | 1,730 | 91.5% | 92.4% | 78% |
| All First Payments - 14/21 Days | 131,086 | 96.2% | 89.2% | 90% (Fiscal Year '02) |
| All First Payments - 35 Days | 131,086 | 98.6% | 97.0% | 95% (Fiscal Year '02) |
| Nonmonetary Determinations Timeliness: Detection Date to Determination Date |
||||
| Nonseparation Determ. within 14 Days | 116,188 | 64.3% | 68.6% | 80% (Fiscal Year '02) |
| Separation Determ. within 21 Days | 41,344 | 73.8% | 73.3% | 80% (Fiscal Year '02) |
| Nonmonetary Issue Detection Timeliness: First Week Affected to Detection Date |
||||
| Nonseparation Issues within 14 Days | 116,188 | 73.2% | 63.1% | none |
| Separation Issues within 21 Days | 41,344 | 93.9% | 90.7% | none |
| Lower Authority Appeals Timeliness | ||||
| Decisions within 30 Days of Filing | 12,929 | 82.9% | 67.9% | 60% |
| Decisions within 45 Days of Filing | 12,929 | 97.0% | 85.4% | 80% |
| Decisions within 90 Days of Filing | 12,929 | 99.6% | 95.5% | 95% (Fiscal Year '02) |
| Higher Authority Appeals Timeliness | ||||
| Decisions within 45 Days of Filing | 2,399 | 73.4% | 62.7% | 50% (Fiscal Year '00) |
| Decisions within 75 Days of Filing | 2,399 | 85.0% | 85.6% | 80% (Fiscal Year '00) |
| Decisions within 150 Days of Filing | 2,399 | 99.2% | 96.3% | 95% (Fiscal Year '00) |
| Combined Wage Program Timeliness | ||||
| Wage Transfers Made within 3 Days | 9,558 | 88.2% | 69.8% | none |
| Wage Transfers Made within 14 Days | 9,558 | 98.4% | 97.3% | none |
| Billing Made within 45 Days | 192 | 75.5% | 92.6% | none |
| Reimbursements Made within 45 Days | 185 | 99.5% | 96.4% | none |
| Continued Claims Payment Timeliness | ||||
| Payments Made within 7 Days | 1,257,022 | 86.9% | 61.4% | none |
| Payments Made within 14 Days | 1,257,022 | 97.0% | 92.5% | none |
| Payments Made within 21 Days | 1,257,022 | 98.9% | 96.3% | none |
| Benefit Quality Measures | ||||
| Nonmon. Determin. with Scores > 80% | 393 | 58.8% | 70.9% | 75% (Fiscal Year '02) |
| LA Appeals with Scores >= 85% | 78 | 97.5% | 90.5% | 80% (Fiscal Year '00) |
| Benefit Payment Control | ||||
| Fraud Overpayment Recovery Rate | 1,941,734 | 53.2% | 50.9% | none |
| Nonfraud Overpayment Recovery Rate | 4,266,552 | 77.2% | 56.1% | none |
| REPORTED MEASURE | STATE RESULTS | NATIONAL RESULTS | CRITERION | |
|---|---|---|---|---|
| Cash Management | ||||
| Average time (days) funds are on deposit before being transferred to Trust Fund | 2.6 | 2.1 days | < 2 (Fiscal Year '00) | |
| Ratio of avg daily loanable balance in Clearing Account to avg daily transfer to Tust Fund | 2.45 | 1.70 | < 1.75 (Fiscal Year '02) | |
| Benefit Accuracy Measurement | ||||
| Total Dollars Paid in Population | $211,507,128 | $18.8 B | none | |
| Sample Size | 702 | 26,353 | none | |
| Proper Payment Rate | 92.5 +/- 1.9 | 91.5% | none | |
| Overpayment Rate | 7.5 +/- 1.9 | 8.5% | none | |
| Underpayment Rate | 0.6 +/- 0.4 | 0.9% | none | |
| Footnotes: | none | |||

| REPORTED MEASURE | STATE RESULTS | NATIONAL RESULTS | ||
|---|---|---|---|---|
| Status Determinations | ||||
| New Employer Determinations: | ||||
| Percentage Made Within 90 Days (Fiscal Year '00 criterion: 60%) | 70.7% | 78.0% | ||
| Percentage Made Within 180 Days (Fiscal Year '00 criterion: 80%) | 84.9% | 89.7% | ||
| Accuracy In Determinations? (Fiscal Year '02 criterion: <= 6 failed) | ** | 45.8% Pass | ||
| Accuracy In Postings? | ** | 39.6% Pass | ||
| Successor Determinations: | ||||
| Percentage Made Within 90 Days | 47.2% | 67.0% | ||
| Percentage Made Within 180 Days | 77.3% | 81.5% | ||
| Accuracy In Determinations? | P | 54.2% Pass | ||
| Accuracy In Postings? | P | 45.8% Pass | ||
| Inactivations: | ||||
| Accuracy In Determinations? | ** | 64.4% Pass | ||
| Accuracy In Postings? | ** | 64.6% Pass | ||
| Report Delinquency | ||||
| Reports From Contributory Employers: | ||||
| Percentage Filed Timely | 91.9% | 87.4% | ||
| Percentage Secured | 96.1% | 92.5% | ||
| Percentage Resolved | 98.0% | 97.1% | ||
| Reports From Reimbursing Employers: | ||||
| Percentage Filed Timely | 95.4% | 79.8% | ||
| Percentage Secured | 95.8% | 85.9% | ||
| Percentage Resolved | 96.1% | 87.5% | ||
| Appropriate Actions Taken To Resolve Delinquencies? | ** | 76.6% Pass | ||
| Collections | ||||
| Collections From Contributory Employers: | ||||
| Percentage Of Tax Due Paid Timely | 95.9% | 92.0% | ||
| Turnover Ratio - Ratio Of Receivables Liquidated Or Declared Uncollectible/Doubtful To Tax Due | 3.0% | 8.1% | ||
| Percentage of Tax Due Declared Uncollectible/Doubtful | 0.0% | 1.3% | ||
| Accounts Receivable As A Percentage Of Tax Due | 2.8% | 2.2% | ||
| Collections From Reimbursing Employers: | ||||
| Percentage Of Tax Due Paid Timely | 77.9% | 80.6% | ||
| Turnover Ratio - Ratio Of Receivables Liquidated Or Declared Uncollectible/Doubtful To Tax Due | 20.1% | 19.4% | ||
| Percentage of Tax Due Declared Uncollectible/Doubtful | 0.0% | 1.2% | ||
| Accounts Receivable As A Percentage Of Tax Due | 3.7% | 4.6% | ||
| Appropriate Actions Taken To Collect Tax Due? | P | 48.9% Pass | ||
| Cashiering | ||||
| Remittances Deposited Within Three Days? | P | 92.0% Pass | ||
| Field Audit | ||||
| Percent Change In Total Wages Resulting From Audits | 0.6% | 5.0% | ||
| Percentage Of Contributory Employers Audited | 2.0% | 2.0% | ||
| Annualized Percentage Of Total Wages Audited | 1.0% | 1.8% | ||
| Audits Meet Employment Security Manual Requirements? | F | 64.6% Pass | ||
| Account Maintenance | ||||
| Accuracy In Report Processing? | P | 96.0% Pass | ||
| Accuracy In Contributory Employer Billing? | P | 84.8% Pass | ||
| Accuracy In Reimbursing Employer Billings? | ** | 85.7% Pass | ||
| Accuracy In Credits/Refunds? | F | 73.9% Pass | ||
| Accuracy In Benefit Charging? | P | 89.6% Pass | ||
| Accuracy In Experience Rating? | P | 87.8% Pass | ||
** State had a problem in establishing the sample universe.
| Alaska | ||||
| REPORTED MEASURE | WORKLOAD | STATE RESULTS |
NATIONAL RESULTS |
CRITERION |
|---|---|---|---|---|
| First Payment Timeliness | ||||
| Intrastate UI, full weeks - 14/21 Days | 28,040 | 90.5% | 90.1% | 87% |
| Intrastate UI, full weeks - 35 Days | 28,040 | 97.2% | 97.2% | 93% |
| Interstate UI, full weeks - 14/21 Days | 12,163 | 82.2% | 78.4% | 70% |
| Interstate UI, full weeks - 35 Days | 12,163 | 92.8% | 92.4% | 78% |
| All First Payments - 14/21 Days | 45,431 | 87.3% | 89.2% | 90% (Fiscal Year '02) |
| All First Payments - 35 Days | 45,431 | 95.8% | 97.0% | 95% (Fiscal Year '02) |
| Nonmonetary Determinations Timeliness: Detection Date to Determination Date |
||||
| Nonseparation Determ. within 14 Days | 27,166 | 89.4% | 68.6% | 80% (Fiscal Year '02) |
| Separation Determ. within 21 Days | 11,973 | 95.9% | 73.3% | 80% (Fiscal Year '02) |
| Nonmonetary Issue Detection Timeliness: First Week Affected to Detection Date |
||||
| Nonseparation Issues within 14 Days | 27,166 | 78.3% | 63.1% | none |
| Separation Issues within 21 Days | 11,973 | 46.0% | 90.7% | none |
| Lower Authority Appeals Timeliness | ||||
| Decisions within 30 Days of Filing | 2,543 | 63.7% | 67.9% | 60% |
| Decisions within 45 Days of Filing | 2,543 | 90.6% | 85.4% | 80% |
| Decisions within 90 Days of Filing | 2,543 | 99.1% | 95.5% | 95% (Fiscal Year '02) |
| Higher Authority Appeals Timeliness | ||||
| Decisions within 45 Days of Filing | 162 | 44.4% | 62.7% | 50% (Fiscal Year '00) |
| Decisions within 75 Days of Filing | 162 | 82.7% | 85.6% | 80% (Fiscal Year '00) |
| Decisions within 150 Days of Filing | 162 | 96.9% | 96.3% | 95% (Fiscal Year '00) |
| Combined Wage Program Timeliness | ||||
| Wage Transfers Made within 3 Days | 6,420 | 0.0% | 69.8% | none |
| Wage Transfers Made within 14 Days | 6,420 | 94.2% | 97.3% | none |
| Billing Made within 45 Days | 96 | 100.0% | 92.6% | none |
| Reimbursements Made within 45 Days | 81 | 84.0% | 96.4% | none |
| Continued Claims Payment Timeliness | ||||
| Payments Made within 7 Days | 632,108 | 44.2% | 61.4% | none |
| Payments Made within 14 Days | 632,108 | 90.6% | 92.5% | none |
| Payments Made within 21 Days | 632,108 | 96.0% | 96.3% | none |
| Benefit Quality Measures | ||||
| Nonmon. Determin. with Scores > 80% | 228 | 72.2% | 70.9% | 75% (Fiscal Year '02) |
| LA Appeals with Scores >= 85% | 78 | 96.2% | 90.5% | 80% (Fiscal Year '00) |
| Benefit Payment Control | ||||
| Fraud Overpayment Recovery Rate | 787,509 | 73.9% | 50.9% | none |
| Nonfraud Overpayment Recovery Rate | 1,050,641 | 90.3% | 56.1% | none |
| Alaska | ||||
| REPORTED MEASURE | STATE RESULTS | NATIONAL RESULTS | CRITERION | |
|---|---|---|---|---|
| Cash Management | ||||
| Average time (days) funds are on deposit before being transferred to Trust Fund | 1.6 | 2.1 days | <= 2 (Fiscal Year '00) | |
| Ratio of avg daily loanable balance in Clearing Account to avg daily transfer to Tust Fund | .20 | 1.70 | <= 1.75 (Fiscal Year '02) | |
| Benefit Accuracy Measurement | ||||
| Total Dollars Paid in Population | $92,772,219 | $18.8 B | none | |
| Sample Size | 481 | 26,353 | none | |
| Proper Payment Rate | 92.5 +/- 2.4 | 91.5% | none | |
| Overpayment Rate | 7.5 +/- 2.4 | 8.5% | none | |
| Underpayment Rate | 1.4 +/- 0.5 | 0.9% | none | |
| Footnotes: | #1 | |||
| Alaska | ||||
| REPORTED MEASURE | STATE RESULTS | NATIONAL RESULTS | ||
|---|---|---|---|---|
| Status Determinations | ||||
| New Employer Determinations: | ||||
| Percentage Made Within 90 Days (Fiscal Year '00 criterion: 60%) | 84.0% | 78.0% | ||
| Percentage Made Within 180 Days (Fiscal Year '00 criterion: 80%) | 90.6% | 89.7% | ||
| Accuracy In Determinations? (Fiscal Year '02 criterion: <= 6 failed) | F | 45.8% Pass | ||
| Accuracy In Postings? | F | 39.6% Pass | ||
| Successor Determinations: | ||||
| Percentage Made Within 90 Days | 79.2% | 67.0% | ||
| Percentage Made Within 180 Days | 86.8% | 81.5% | ||
| Accuracy In Determinations? | F | 54.2% Pass | ||
| Accuracy In Postings? | F | 45.8% Pass | ||
| Inactivations: | ||||
| Accuracy In Determinations? | P | 64.4% Pass | ||
| Accuracy In Postings? | P | 64.6% Pass | ||
| Report Delinquency | ||||
| Reports From Contributory Employers: | ||||
| Percentage Filed Timely | 90.8% | 87.4% | ||
| Percentage Secured | 96.3% | 92.5% | ||
| Percentage Resolved | 99.3% | 97.1% | ||
| Reports From Reimbursing Employers: | ||||
| Percentage Filed Timely | 93.8% | 79.8% | ||
| Percentage Secured | 95.9% | 85.9% | ||
| Percentage Resolved | 98.5% | 87.5% | ||
| Appropriate Actions Taken To Resolve Delinquencies? | P | 76.6% Pass | ||
| Collections | ||||
| Collections From Contributory Employers: | ||||
| Percentage Of Tax Due Paid Timely | 88.3% | 92.0% | ||
| Turnover Ratio - Ratio Of Receivables Liquidated Or Declared Uncollectible/Doubtful To Tax Due | 11.4% | 8.1% | ||
| Percentage of Tax Due Declared Uncollectible/Doubtful | 0.3% | 1.3% | ||
| Accounts Receivable As A Percentage Of Tax Due | 2.0% | 2.2% | ||
| Collections From Reimbursing Employers: | ||||
| Percentage Of Tax Due Paid Timely | 95.7% | 80.6% | ||
| Turnover Ratio - Ratio Of Receivables Liquidated Or Declared Uncollectible/Doubtful To Tax Due | 4.6% | 19.4% | ||
| Percentage of Tax Due Declared Uncollectible/Doubtful | 0.0% | 1.2% | ||
| Accounts Receivable As A Percentage Of Tax Due | 0.4% | 4.6% | ||
| Appropriate Actions Taken To Collect Tax Due? | F | 48.9% Pass | ||
| Cashiering | ||||
| Remittances Deposited Within Three Days? | P | 92.0% Pass | ||
| Field Audit | ||||
| Percent Change In Total Wages Resulting From Audits | 7.0% | 5.0% | ||
| Percentage Of Contributory Employers Audited | 2.2% | 2.0% | ||
| Annualized Percentage Of Total Wages Audited | 2.6% | 1.8% | ||
| Audits Meet Employment Security Manual Requirements? | F | 64.6% Pass | ||
| Account Maintenance | ||||
| Accuracy In Report Processing? | P | 96.0% Pass | ||
| Accuracy In Contributory Employer Billing? | P | 84.8% Pass | ||
| Accuracy In Reimbursing Employer Billings? | F | 85.7% Pass | ||
| Accuracy In Credits/Refunds? | F | 73.9% Pass | ||
| Accuracy In Benefit Charging? | F | 89.6% Pass | ||
| Accuracy In Experience Rating? | P | 87.8% Pass | ||
| Arizona | ||||
| REPORTED MEASURE | WORKLOAD | STATE RESULTS |
NATIONAL RESULTS |
CRITERION |
|---|---|---|---|---|
| First Payment Timeliness | ||||
| Intrastate UI, full weeks - 14/21 Days | 53,436 | 96.1% | 90.1% | 87% |
| Intrastate UI, full weeks - 35 Days | 53,436 | 98.3% | 97.2% | 93% |
| Interstate UI, full weeks - 14/21 Days | 3,157 | 78.2% | 78.4% | 70% |
| Interstate UI, full weeks - 35 Days | 3,157 | 94.2% | 92.4% | 78% |
| All First Payments - 14/21 Days | 61,066 | 94.9% | 89.2% | 90% (Fiscal Year '02) |
| All First Payments - 35 Days | 61,066 | 98.1% | 97.0% | 95% (Fiscal Year '02) |
| Nonmonetary Determinations Timeliness: Detection Date to Determination Date |
||||
| Nonseparation Determ. within 14 Days | 49,935 | 83.9% | 68.6% | 80% (Fiscal Year '02) |
| Separation Determ. within 21 Days | 48,154 | 95.6% | 73.3% | 80% (Fiscal Year '02) |
| Nonmonetary Issue Detection Timeliness: First Week Affected to Detection Date |
||||
| Nonseparation Issues within 14 Days | 49,935 | 87.1% | 63.1% | none |
| Separation Issues within 21 Days | 48,154 | 94.8% | 90.7% | none |
| Lower Authority Appeals Timeliness | ||||
| Decisions within 30 Days of Filing | 12,401 | 83.4% | 67.9% | 60% |
| Decisions within 45 Days of Filing | 12,401 | 96.1% | 85.4% | 80% |
| Decisions within 90 Days of Filing | 12,401 | 98.8% | 95.5% | 95% (Fiscal Year '02) |
| Higher Authority Appeals Timeliness | ||||
| Decisions within 45 Days of Filing | 1,613 | 78.1% | 62.7% | 50% (Fiscal Year '00) |
| Decisions within 75 Days of Filing | 1,613 | 94.0% | 85.6% | 80% (Fiscal Year '00) |
| Decisions within 150 Days of Filing | 1,613 | 98.3% | 96.3% | 95% (Fiscal Year '00) |
| Combined Wage Program Timeliness | ||||
| Wage Transfers Made within 3 Days | 9,364 | 0.0% | 69.8% | none |
| Wage Transfers Made within 14 Days | 9,364 | 99.6% | 97.3% | none |
| Billing Made within 45 Days | 0 | 0.0% | 92.6% | none |
| Reimbursements Made within 45 Days | 0 | 0.0% | 96.4% | none |
| Continued Claims Payment Timeliness | ||||
| Payments Made within 7 Days | 854,114 | 95.0% | 61.4% | none |
| Payments Made within 14 Days | 854,114 | 98.2% | 92.5% | none |
| Payments Made within 21 Days | 854,114 | 99.0% | 96.3% | none |
| Benefit Quality Measures | ||||
| Nonmon. Determin. with Scores > 80% | 388 | 65.4% | 70.9% | 75% (Fiscal Year '02) |
| LA Appeals with Scores >= 85% | 76 | 97.4% | 90.5% | 80% (Fiscal Year '00) |
| Benefit Payment Control | ||||
| Fraud Overpayment Recovery Rate | 2,219,212 | 67.3% | 50.9% | none |
| Nonfraud Overpayment Recovery Rate | 2,030,602 | 68.1% | 56.1% | none |
| Arizona | ||||
| REPORTED MEASURE | STATE RESULTS | NATIONAL RESULTS | CRITERION | |
|---|---|---|---|---|
| Cash Management | ||||
| Average time (days) funds are on deposit before being transferred to Trust Fund | 1.6 | 2.1 days | <= 2 (Fiscal Year '00) | |
| Ratio of avg daily loanable balance in Clearing Account to avg daily transfer to Tust Fund | 0.65 | 1.70 | <= 1.75 (Fiscal Year '02) | |
| Benefit Accuracy Measurement | ||||
| Total Dollars Paid in Population | $123,745,079 | $18.8 B | none | |
| Sample Size | 480 | 26,353 | none | |
| Proper Payment Rate | 89.3 +/- 3 | 91.5% | none | |
| Overpayment Rate | 10.7 +/- 3 | 8.5% | none | |
| Underpayment Rate | 0.4 +/- 0.3 | 0.9% | none | |
| Footnotes: | none | |||
| Arizona | ||||
| REPORTED MEASURE | STATE RESULTS | NATIONAL RESULTS | ||
|---|---|---|---|---|
| Status Determinations | ||||
| New Employer Determinations: | ||||
| Percentage Made Within 90 Days (Fiscal Year '00 criterion: 60%) | 68.2% | 78.0% | ||
| Percentage Made Within 180 Days (Fiscal Year '00 criterion: 80%) | 87.1% | 89.7% | ||
| Accuracy In Determinations? (Fiscal Year '02 criterion: <= 6 failed) | F | 45.8% Pass | ||
| Accuracy In Postings? | F | 39.6% Pass | ||
| Successor Determinations: | ||||
| Percentage Made Within 90 Days | 63.2% | 67.0% | ||
| Percentage Made Within 180 Days | 81.2% | 81.5% | ||
| Accuracy In Determinations? | F | 54.2% Pass | ||
| Accuracy In Postings? | F | 45.8% Pass | ||
| Inactivations: | ||||
| Accuracy In Determinations? | F | 64.4% Pass | ||
| Accuracy In Postings? | F | 64.6% Pass | ||
| Report Delinquency | ||||
| Reports From Contributory Employers: | ||||
| Percentage Filed Timely | 89.7% | 87.4% | ||
| Percentage Secured | 98.0% | 92.5% | ||
| Percentage Resolved | 102.5% | 97.1% | ||
| Reports From Reimbursing Employers: | ||||
| Percentage Filed Timely | 92.0% | 79.8% | ||
| Percentage Secured | 98.9% | 85.9% | ||
| Percentage Resolved | 100.7% | 87.5% | ||
| Appropriate Actions Taken To Resolve Delinquencies? | F | 76.6% Pass | ||
| Collections | ||||
| Collections From Contributory Employers: | ||||
| Percentage Of Tax Due Paid Timely | 96.7% | 92.0% | ||
| Turnover Ratio - Ratio Of Receivables Liquidated Or Declared Uncollectible/Doubtful To Tax Due | 3.4% | 8.1% | ||
| Percentage of Tax Due Declared Uncollectible/Doubtful | 0.4% | 1.3% | ||
| Accounts Receivable As A Percentage Of Tax Due | 1.3% | 2.2% | ||
| Collections From Reimbursing Employers: | ||||
| Percentage Of Tax Due Paid Timely | 89.3% | 80.6% | ||
| Turnover Ratio - Ratio Of Receivables Liquidated Or Declared Uncollectible/Doubtful To Tax Due | 9.8% | 19.4% | ||
| Percentage of Tax Due Declared Uncollectible/Doubtful | 0.0% | 1.2% | ||
| Accounts Receivable As A Percentage Of Tax Due | 1.1% | 4.6% | ||
| Appropriate Actions Taken To Collect Tax Due? | P | 48.9% Pass | ||
| Cashiering | ||||
| Remittances Deposited Within Three Days? | P | 92.0% Pass | ||
| Field Audit | ||||
| Percent Change In Total Wages Resulting From Audits | 2.5% | 5.0% | ||
| Percentage Of Contributory Employers Audited | 2.4% | 2.0% | ||
| Annualized Percentage Of Total Wages Audited | 2.2% | 1.8% | ||
| Audits Meet Employment Security Manual Requirements? | F | 64.6% Pass | ||
| Account Maintenance | ||||
| Accuracy In Report Processing? | P | 96.0% Pass | ||
| Accuracy In Contributory Employer Billing? | P | 84.8% Pass | ||
| Accuracy In Reimbursing Employer Billings? | P | 85.7% Pass | ||
| Accuracy In Credits/Refunds? | P | 73.9% Pass | ||
| Accuracy In Benefit Charging? | P | 89.6% Pass | ||
| Accuracy In Experience Rating? | P | 87.8% Pass | ||
| Arkansas | ||||
| REPORTED MEASURE | WORKLOAD | STATE RESULTS |
NATIONAL RESULTS |
CRITERION |
|---|---|---|---|---|
| First Payment Timeliness | ||||
| Intrastate UI, full weeks - 14/21 Days | 43,013 | 90.1% | 90.1% | 87% |
| Intrastate UI, full weeks - 35 Days | 43,013 | 97.3% | 97.2% | 93% |
| Interstate UI, full weeks - 14/21 Days | 1,434 | 72.6% | 78.4% | 70% |
| Interstate UI, full weeks - 35 Days | 1,434 | 92.7% | 92.4% | 78% |
| All First Payments - 14/21 Days | 57,369 | 90.4% | 89.2% | 90% (Fiscal Year '02) |
| All First Payments - 35 Days | 57,369 | 97.6% | 97.0% | 95% (Fiscal Year '02) |
| Nonmonetary Determinations Timeliness: Detection Date to Determination Date |
||||
| Nonseparation Determ. within 14 Days | 19,641 | 63.1% | 68.6% | 80% (Fiscal Year '02) |
| Separation Determ. within 21 Days | 27,046 | 54.2% | 73.3% | 80% (Fiscal Year '02) |
| Nonmonetary Issue Detection Timeliness: First Week Affected to Detection Date |
||||
| Nonseparation Issues within 14 Days | 19,641 | 74.0% | 63.1% | none |
| Separation Issues within 21 Days | 27,046 | 71.9% | 90.7% | none |
| Lower Authority Appeals Timeliness | ||||
| Decisions within 30 Days of Filing | 10,166 | 97.3% | 67.9% | 60% |
| Decisions within 45 Days of Filing | 10,166 | 99.4% | 85.4% | 80% |
| Decisions within 90 Days of Filing | 10,166 | 100.0% | 95.5% | 95% (Fiscal Year '02) |
| Higher Authority Appeals Timeliness | ||||
| Decisions within 45 Days of Filing | 1,944 | 90.3% | 62.7% | 50% (Fiscal Year '00) |
| Decisions within 75 Days of Filing | 1,944 | 95.3% | 85.6% | 80% (Fiscal Year '00) |
| Decisions within 150 Days of Filing | 1,944 | 98.1% | 96.3% | 95% (Fiscal Year '00) |
| Combined Wage Program Timeliness | ||||
| Wage Transfers Made within 3 Days | 6,515 | 18.4% | 69.8% | none |
| Wage Transfers Made within 14 Days | 6,515 | 71.6% | 97.3% | none |
| Billing Made within 45 Days | 250 | 20.4% | 92.6% | none |
| Reimbursements Made within 45 Days | 181 | 93.4% | 96.4% | none |
| Continued Claims Payment Timeliness | ||||
| Payments Made within 7 Days | 680,065 | 83.4% | 61.4% | none |
| Payments Made within 14 Days | 680,065 | 96.5% | 92.5% | none |
| Payments Made within 21 Days | 680,065 | 98.5% | 96.3% | none |
| Benefit Quality Measures | ||||
| Nonmon. Determin. with Scores > 80% | 175 | 85.9% | 70.9% | 75% (Fiscal Year '02) |
| LA Appeals with Scores >= 85% | 79 | 89.9% | 90.5% | 80% (Fiscal Year '00) |
| Benefit Payment Control | ||||
| Fraud Overpayment Recovery Rate | 816,423 | 37.2% | 50.9% | none |
| Nonfraud Overpayment Recovery Rate | 1,287,773 | 32.5% | 56.1% | none |
| Arkansas | ||||
| REPORTED MEASURE | STATE RESULTS | NATIONAL RESULTS | CRITERION | |
|---|---|---|---|---|
| Cash Management | ||||
| Average time (days) funds are on deposit before being transferred to Trust Fund | 1.7 | 2.1 days | <= 2 (Fiscal Year '00) | |
| Ratio of avg daily loanable balance in Clearing Account to avg daily transfer to Tust Fund | 0.65 | 1.70 | <= 1.75 (Fiscal Year '02) | |
| Benefit Accuracy Measurement | ||||
| Total Dollars Paid in Population | $173,585,152 | $18.8 B | none | |
| Sample Size | 479 | 26,353 | none | |
| Proper Payment Rate | 92.3 +/- 2.6 | 91.5% | none | |
| Overpayment Rate | 7.7 +/- 2.6 | 8.5% | none | |
| Underpayment Rate | 0.5 +/- 0.3 | 0.9% | none | |
| Footnotes: | none | |||
| Arkansas | ||||
| REPORTED MEASURE | STATE RESULTS | NATIONAL RESULTS | ||
|---|---|---|---|---|
| Status Determinations | ||||
| New Employer Determinations: | ||||
| Percentage Made Within 90 Days (Fiscal Year '00 criterion: 60%) | 51.1% | 78.0% | ||
| Percentage Made Within 180 Days (Fiscal Year '00 criterion: 80%) | 80.9% | 89.7% | ||
| Accuracy In Determinations? (Fiscal Year '02 criterion: <= 6 failed) | ** | 45.8% Pass | ||
| Accuracy In Postings? | ** | 39.6% Pass | ||
| Successor Determinations: | ||||
| Percentage Made Within 90 Days | 44.0% | 67.0% | ||
| Percentage Made Within 180 Days | 78.6% | 81.5% | ||
| Accuracy In Determinations? | ** | 54.2% Pass | ||
| Accuracy In Postings? | ** | 45.8% Pass | ||
| Inactivations: | ||||
| Accuracy In Determinations? | ** | 64.4% Pass | ||
| Accuracy In Postings? | ** | 64.6% Pass | ||
| Report Delinquency | ||||
| Reports From Contributory Employers: | ||||
| Percentage Filed Timely | 91.4% | 87.4% | ||
| Percentage Secured | 98.7% | 92.5% | ||
| Percentage Resolved | 101.9% | 97.1% | ||
| Reports From Reimbursing Employers: | ||||
| Percentage Filed Timely | 95.3% | 79.8% | ||
| Percentage Secured | 98.3% | 85.9% | ||
| Percentage Resolved | 100.3% | 87.5% | ||
| Appropriate Actions Taken To Resolve Delinquencies? | ** | 76.6% Pass | ||
| Collections | ||||
| Collections From Contributory Employers: | ||||
| Percentage Of Tax Due Paid Timely | 97.7% | 92.0% | ||
| Turnover Ratio - Ratio Of Receivables Liquidated Or Declared Uncollectible/Doubtful To Tax Due | 2.5% | 8.1% | ||
| Percentage of Tax Due Declared Uncollectible/Doubtful | 1.1% | 1.3% | ||
| Accounts Receivable As A Percentage Of Tax Due | 1.6% | 2.2% | ||
| Collections From Reimbursing Employers: | ||||
| Percentage Of Tax Due Paid Timely | 96.4% | 80.6% | ||
| Turnover Ratio - Ratio Of Receivables Liquidated Or Declared Uncollectible/Doubtful To Tax Due | 5.5% | 19.4% | ||
| Percentage of Tax Due Declared Uncollectible/Doubtful | 2.7% | 1.2% | ||
| Accounts Receivable As A Percentage Of Tax Due | 1.9% | 4.6% | ||
| Appropriate Actions Taken To Collect Tax Due? | ** | 48.9% Pass | ||
| Cashiering | ||||
| Remittances Deposited Within Three Days? | F | 92.0% Pass | ||
| Field Audit | ||||
| Percent Change In Total Wages Resulting From Audits | 1.4% | 5.0% | ||
| Percentage Of Contributory Employers Audited | 1.9% | 2.0% | ||
| Annualized Percentage Of Total Wages Audited | 0.9% | 1.8% | ||
| Audits Meet Employment Security Manual Requirements? | ** | 64.6% Pass | ||
| Account Maintenance | ||||
| Accuracy In Report Processing? | P | 96.0% Pass | ||
| Accuracy In Contributory Employer Billing? | ** | 84.8% Pass | ||
| Accuracy In Reimbursing Employer Billings? | ** | 85.7% Pass | ||
| Accuracy In Credits/Refunds? | ** | 73.9% Pass | ||
| Accuracy In Benefit Charging? | ** | 89.6% Pass | ||
| Accuracy In Experience Rating? | F | 87.8% Pass | ||
** State had a problem in establishing the sample universe.
| California | ||||
| REPORTED MEASURE | WORKLOAD | STATE RESULTS |
NATIONAL RESULTS |
CRITERION |
|---|---|---|---|---|
| First Payment Timeliness | ||||
| Intrastate UI, full weeks - 14/21 Days | 982,938 | 87.1% | 90.1% | 87% |
| Intrastate UI, full weeks - 35 Days | 982,938 | 96.9% | 97.2% | 93% |
| Interstate UI, full weeks - 14/21 Days | 20,938 | 77.4% | 78.4% | 70% |
| Interstate UI, full weeks - 35 Days | 20,938 | 93.5% | 92.4% | 78% |
| All First Payments - 14/21 Days | 1,059,905 | 86.2% | 89.2% | 90% (Fiscal Year '02) |
| All First Payments - 35 Days | 1,059,905 | 96.8% | 97.0% | 95% (Fiscal Year '02) |
| Nonmonetary Determinations Timeliness: Detection Date to Determination Date |
||||
| Nonseparation Determ. within 14 Days | 1,498,938 | 74.7% | 68.6% | 80% (Fiscal Year '02) |
| Separation Determ. within 21 Days | 582,481 | 90.3% | 73.3% | 80% (Fiscal Year '02) |
| Nonmonetary Issue Detection Timeliness: First Week Affected to Detection Date |
||||
| Nonseparation Issues within 14 Days | 1,459,411 | 54.9% | 63.1% | none |
| Separation Issues within 21 Days | 574,612 | 91.4% | 90.7% | none |
| Lower Authority Appeals Timeliness | ||||
| Decisions within 30 Days of Filing | 180,601 | 48.7% | 67.9% | 60% |
| Decisions within 45 Days of Filing | 180,601 | 70.1% | 85.4% | 80% |
| Decisions within 90 Days of Filing | 180,601 | 88.4% | 95.5% | 95% (Fiscal Year '02) |
| Higher Authority Appeals Timeliness | ||||
| Decisions within 45 Days of Filing | 14,491 | 91.8% | 62.7% | 50% (Fiscal Year '00) |
| Decisions within 75 Days of Filing | 14,491 | 60.8% | 85.6% | 80% (Fiscal Year '00) |
| Decisions within 150 Days of Filing | 14,491 | 89.8% | 96.3% | 95% (Fiscal Year '00) |
| Combined Wage Program Timeliness | ||||
| Wage Transfers Made within 3 Days | 26,278 | 91.8% | 69.8% | none |
| Wage Transfers Made within 14 Days | 26,278 | 99.8% | 97.3% | none |
| Billing Made within 45 Days | 208 | 100.0% | 92.6% | none |
| Reimbursements Made within 45 Days | 201 | 100.0% | 96.4% | none |
| Continued Claims Payment Timeliness | ||||
| Payments Made within 7 Days | 16,211,374 | 40.2% | 61.4% | none |
| Payments Made within 14 Days | 16,211,374 | 86.2% | 92.5% | none |
| Payments Made within 21 Days | 16,211,374 | 94.0% | 96.3% | none |
| Benefit Quality Measures | ||||
| Nonmon. Determin. with Scores > 80% | 332 | 42.8% | 70.9% | 75% (Fiscal Year '02) |
| LA Appeals with Scores >= 85% | 134 | 75.9% | 90.5% | 80% (Fiscal Year '00) |
| Benefit Payment Control | ||||
| Fraud Overpayment Recovery Rate | 83,968,281 | 57.0% | 50.9% | none |
| Nonfraud Overpayment Recovery Rate | 13,651,153 | 42.5% | 56.1% | none |
| California | ||||
| REPORTED MEASURE | STATE RESULTS | NATIONAL RESULTS | CRITERION | |
|---|---|---|---|---|
| Cash Management | ||||
| Average time (days) funds are on deposit before being transferred to Trust Fund | 1.0 | 2.1 days | <= 2 (Fiscal Year '00) | |
| Ratio of avg daily loanable balance in Clearing Account to avg daily transfer to Tust Fund | 0.72 | 1.70 | <= 1.75 (Fiscal Year '02) | |
| Benefit Accuracy Measurement | ||||
| Total Dollars Paid in Population | $2,518,273,771 | $18.8 B | none | |
| Sample Size | 1,729 | 26,353 | none | |
| Proper Payment Rate | 94.1 +/- 1.2 | 91.5% | none | |
| Overpayment Rate | 5.9 +/- 1.2 | 8.5% | none | |
| Underpayment Rate | 0.6 +/- 0.2 | 0.9% | none | |
| Footnotes: | none | |||
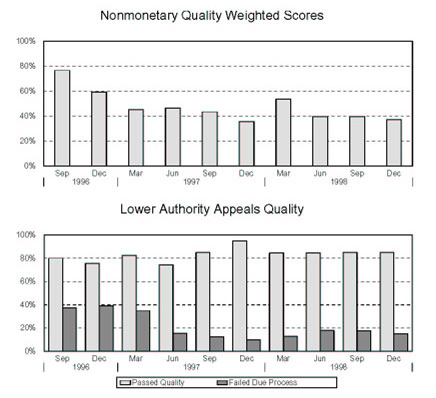
| California | ||||
| REPORTED MEASURE | STATE RESULTS | NATIONAL RESULTS | ||
|---|---|---|---|---|
| Status Determinations | ||||
| New Employer Determinations: | ||||
| Percentage Made Within 90 Days (Fiscal Year '00 criterion: 60%) | 89.0% | 78.0% | ||
| Percentage Made Within 180 Days (Fiscal Year '00 criterion: 80%) | 96.2% | 89.7% | ||
| Accuracy In Determinations? (Fiscal Year '02 criterion: <= 6 failed) | F | 45.8% Pass | ||
| Accuracy In Postings? | F | 39.6% Pass | ||
| Successor Determinations: | ||||
| Percentage Made Within 90 Days | 33.2% | 67.0% | ||
| Percentage Made Within 180 Days | 48.0% | 81.5% | ||
| Accuracy In Determinations? | ** | 54.2% Pass | ||
| Accuracy In Postings? | ** | 45.8% Pass | ||
| Inactivations: | ||||
| Accuracy In Determinations? | F | 64.4% Pass | ||
| Accuracy In Postings? | F | 64.6% Pass | ||
| Report Delinquency | ||||
| Reports From Contributory Employers: | ||||
| Percentage Filed Timely | 78.6% | 87.4% | ||
| Percentage Secured | 78.6% | 92.5% | ||
| Percentage Resolved | 89.5% | 97.1% | ||
| Reports From Reimbursing Employers: | ||||
| Percentage Filed Timely | 99.8% | 79.8% | ||
| Percentage Secured | 99.8% | 85.9% | ||
| Percentage Resolved | 97.3% | 87.5% | ||
| Appropriate Actions Taken To Resolve Delinquencies? | F | 76.6% Pass | ||
| Collections | ||||
| Collections From Contributory Employers: | ||||
| Percentage Of Tax Due Paid Timely | 95.9% | 92.0% | ||
| Turnover Ratio - Ratio Of Receivables Liquidated Or Declared Uncollectible/Doubtful To Tax Due | 3.5% | 8.1% | ||
| Percentage of Tax Due Declared Uncollectible/Doubtful | 1.6% | 1.3% | ||
| Accounts Receivable As A Percentage Of Tax Due | 3.3% | 2.2% | ||
| Collections From Reimbursing Employers: | ||||
| Percentage Of Tax Due Paid Timely | 96.6% | 80.6% | ||
| Turnover Ratio - Ratio Of Receivables Liquidated Or Declared Uncollectible/Doubtful To Tax Due | 3.4% | 19.4% | ||
| Percentage of Tax Due Declared Uncollectible/Doubtful | 0.2% | 1.2% | ||
| Accounts Receivable As A Percentage Of Tax Due | 1.8% | 4.6% | ||
| Appropriate Actions Taken To Collect Tax Due? | F | 48.9% Pass | ||
| Cashiering | ||||
| Remittances Deposited Within Three Days? | F | 92.0% Pass | ||
| Field Audit | ||||
| Percent Change In Total Wages Resulting From Audits | 0.0% | 5.0% | ||
| Percentage Of Contributory Employers Audited | 0.1% | 2.0% | ||
| Annualized Percentage Of Total Wages Audited | 0.2% | 1.8% | ||
| Audits Meet Employment Security Manual Requirements? | F | 64.6% Pass | ||
| Account Maintenance | ||||
| Accuracy In Report Processing? | P | 96.0% Pass | ||
| Accuracy In Contributory Employer Billing? | F | 84.8% Pass | ||
| Accuracy In Reimbursing Employer Billings? | F | 85.7% Pass | ||
| Accuracy In Credits/Refunds? | F | 73.9% Pass | ||
| Accuracy In Benefit Charging? | P | 89.6% Pass | ||
| Accuracy In Experience Rating? | P | 87.8% Pass | ||
**State had a problem in establishing the sample universe.
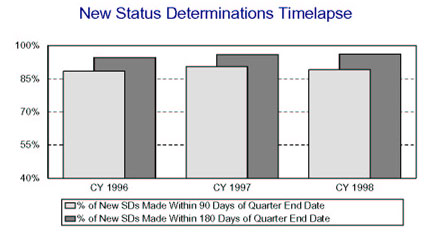
| Colorado | ||||
| REPORTED MEASURE | WORKLOAD | STATE RESULTS |
NATIONAL RESULTS |
CRITERION |
|---|---|---|---|---|
| First Payment Timeliness | ||||
| Intrastate UI, full weeks - 14/21 Days | 36,257 | 90.0% | 90.1% | 87% |
| Intrastate UI, full weeks - 35 Days | 36,257 | 96.5% | 97.2% | 93% |
| Interstate UI, full weeks - 14/21 Days | 2,443 | 83.1% | 78.4% | 70% |
| Interstate UI, full weeks - 35 Days | 2,443 | 94.7% | 92.4% | 78% |
| All First Payments - 14/21 Days | 42,176 | 89.6% | 89.2% | 90% (Fiscal Year '02) |
| All First Payments - 35 Days | 42,176 | 96.5% | 97.0% | 95% (Fiscal Year '02) |
| Nonmonetary Determinations Timeliness: Detection Date to Determination Date |
||||
| Nonseparation Determ. within 14 Days | 51,974 | 60.6% | 68.6% | 80% (Fiscal Year '02) |
| Separation Determ. within 21 Days | 80,773 | 37.0% | 73.3% | 80% (Fiscal Year '02) |
| Nonmonetary Issue Detection Timeliness: First Week Affected to Detection Date |
||||
| Nonseparation Issues within 14 Days | 51,974 | 75.7% | 63.1% | none |
| Separation Issues within 21 Days | 80,773 | 97.2% | 90.7% | none |
| Lower Authority Appeals Timeliness | ||||
| Decisions within 30 Days of Filing | 15,599 | 65.6% | 67.9% | 60% |
| Decisions within 45 Days of Filing | 15,599 | 91.5% | 85.4% | 80% |
| Decisions within 90 Days of Filing | 15,599 | 98.9% | 95.5% | 95% (Fiscal Year '02) |
| Higher Authority Appeals Timeliness | ||||
| Decisions within 45 Days of Filing | 2,063 | 55.8% | 62.7% | 50% (Fiscal Year '00) |
| Decisions within 75 Days of Filing | 2,063 | 90.6% | 85.6% | 80% (Fiscal Year '00) |
| Decisions within 150 Days of Filing | 2,063 | 97.7% | 96.3% | 95% (Fiscal Year '00) |
| Combined Wage Program Timeliness | ||||
| Wage Transfers Made within 3 Days | 8,998 | 84.8% | 69.8% | none |
| Wage Transfers Made within 14 Days | 8,998 | 100.0% | 97.3% | none |
| Billing Made within 45 Days | 194 | 100.0% | 92.6% | none |
| Reimbursements Made within 45 Days | 201 | 100.0% | 96.4% | none |
| Continued Claims Payment Timeliness | ||||
| Payments Made within 7 Days | 604,819 | 45.3% | 61.4% | none |
| Payments Made within 14 Days | 604,819 | 94.1% | 92.5% | none |
| Payments Made within 21 Days | 604,819 | 96.8% | 96.3% | none |
| Benefit Quality Measures | ||||
| Nonmon. Determin. with Scores > 80% | 368 | 41.7% | 70.9% | 75% (Fiscal Year '02) |
| LA Appeals with Scores >= 85% | 78 | 55.0% | 90.5% | 80% (Fiscal Year '00) |
| Benefit Payment Control | ||||
| Fraud Overpayment Recovery Rate | 1,896,441 | 38.0% | 50.9% | none |
| Nonfraud Overpayment Recovery Rate | 3,914,874 | 42.5% | 56.1% | none |
| Colorado | ||||
| REPORTED MEASURE | STATE RESULTS | NATIONAL RESULTS | CRITERION | |
|---|---|---|---|---|
| Cash Management | ||||
| Average time (days) funds are on deposit before being transferred to Trust Fund | 1.3 | 2.1 days | <= 2 (Fiscal Year '00) | |
| Ratio of avg daily loanable balance in Clearing Account to avg daily transfer to Tust Fund | 1.47 | 1.70 | <= 1.75 (Fiscal Year '02) | |
| Benefit Accuracy Measurement | ||||
| Total Dollars Paid in Population | $142,323,411 | $18.8 B | none | |
| Sample Size | 480 | 26,353 | none | |
| Proper Payment Rate | 87.2 +/- 3.1 | 91.5% | none | |
| Overpayment Rate | 12.8 +/- 3.1 | 8.5% | none | |
| Underpayment Rate | 0.6 +/- 0.4 | 0.9% | none | |
| Footnotes: | none | |||
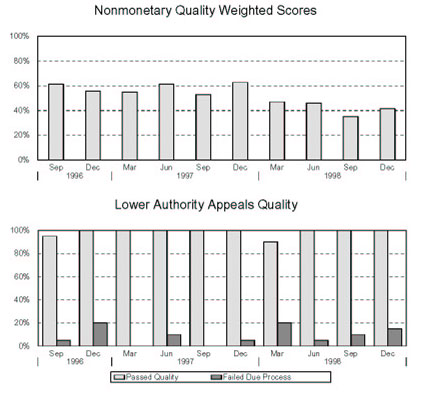
| Colorado | ||||
| REPORTED MEASURE | STATE RESULTS | NATIONAL RESULTS | ||
|---|---|---|---|---|
| Status Determinations | ||||
| New Employer Determinations: | ||||
| Percentage Made Within 90 Days (Fiscal Year '00 criterion: 60%) | 95.2% | 78.0% | ||
| Percentage Made Within 180 Days (Fiscal Year '00 criterion: 80%) | 97.0% | 89.7% | ||
| Accuracy In Determinations? (Fiscal Year '02 criterion: <= 6 failed) | F | 45.8% Pass | ||
| Accuracy In Postings? | P | 39.6% Pass | ||
| Successor Determinations: | ||||
| Percentage Made Within 90 Days | 85.2% | 67.0% | ||
| Percentage Made Within 180 Days | 93.9% | 81.5% | ||
| Accuracy In Determinations? | P | 54.2% Pass | ||
| Accuracy In Postings? | P | 45.8% Pass | ||
| Inactivations: | ||||
| Accuracy In Determinations? | P | 64.4% Pass | ||
| Accuracy In Postings? | P | 64.6% Pass | ||
| Report Delinquency | ||||
| Reports From Contributory Employers: | ||||
| Percentage Filed Timely | 90.7% | 87.4% | ||
| Percentage Secured | 93.8% | 92.5% | ||
| Percentage Resolved | 96.8% | 97.1% | ||
| Reports From Reimbursing Employers: | ||||
| Percentage Filed Timely | 94.6% | 79.8% | ||
| Percentage Secured | 97.0% | 85.9% | ||
| Percentage Resolved | 99.2% | 87.5% | ||
| Appropriate Actions Taken To Resolve Delinquencies? | P | 76.6% Pass | ||
| Collections | ||||
| Collections From Contributory Employers: | ||||
| Percentage Of Tax Due Paid Timely | 1.8% | 92.0% | ||
| Turnover Ratio - Ratio Of Receivables Liquidated Or Declared Uncollectible/Doubtful To Tax Due | 98.4% | 8.1% | ||
| Percentage of Tax Due Declared Uncollectible/Doubtful | 1.6% | 1.3% | ||
| Accounts Receivable As A Percentage Of Tax Due | 1.6% | 2.2% | ||
| Collections From Reimbursing Employers: | ||||
| Percentage Of Tax Due Paid Timely | 122.4% | 80.6% | ||
| Turnover Ratio - Ratio Of Receivables Liquidated Or Declared Uncollectible/Doubtful To Tax Due | 120.4% | 19.4% | ||
| Percentage of Tax Due Declared Uncollectible/Doubtful | 0.0% | 1.2% | ||
| Accounts Receivable As A Percentage Of Tax Due | 3.3% | 4.6% | ||
| Appropriate Actions Taken To Collect Tax Due? | F | 48.9% Pass | ||
| Cashiering | ||||
| Remittances Deposited Within Three Days? | P | 92.0% Pass | ||
| Field Audit | ||||
| Percent Change In Total Wages Resulting From Audits | 3.5% | 5.0% | ||
| Percentage Of Contributory Employers Audited | 2.5% | 2.0% | ||
| Annualized Percentage Of Total Wages Audited | 1.3% | 1.8% | ||
| Audits Meet Employment Security Manual Requirements? | P | 64.6% Pass | ||
| Account Maintenance | ||||
| Accuracy In Report Processing? | P | 96.0% Pass | ||
| Accuracy In Contributory Employer Billing? | F | 84.8% Pass | ||
| Accuracy In Reimbursing Employer Billings? | P | 85.7% Pass | ||
| Accuracy In Credits/Refunds? | P | 73.9% Pass | ||
| Accuracy In Benefit Charging? | P | 89.6% Pass | ||
| Accuracy In Experience Rating? | P | 87.8% Pass | ||
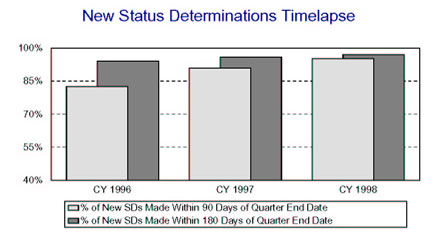
| Delaware | ||||
| REPORTED MEASURE | WORKLOAD | STATE RESULTS |
NATIONAL RESULTS |
CRITERION |
|---|---|---|---|---|
| First Payment Timeliness | ||||
| Intrastate UI, full weeks - 14/21 Days | 82,751 | 95.2% | 90.1% | 87% |
| Intrastate UI, full weeks - 35 Days | 82,751 | 97.7% | 97.2% | 93% |
| Interstate UI, full weeks - 14/21 Days | 3,186 | 80.0% | 78.4% | 70% |
| Interstate UI, full weeks - 35 Days | 3,186 | 89.8% | 92.4% | 78% |
| All First Payments - 14/21 Days | 111,630 | 93.5% | 89.2% | 90% (Fiscal Year '02) |
| All First Payments - 35 Days | 111,630 | 96.9% | 97.0% | 95% (Fiscal Year '02) |
| Nonmonetary Determinations Timeliness: Detection Date to Determination Date |
||||
| Nonseparation Determ. within 14 Days | 30,174 | 69.3% | 68.6% | 80% (Fiscal Year '02) |
| Separation Determ. within 21 Days | 45,855 | 90.2% | 73.3% | 80% (Fiscal Year '02) |
| Nonmonetary Issue Detection Timeliness: First Week Affected to Detection Date |
||||
| Nonseparation Issues within 14 Days | 30,174 | 90.9% | 63.1% | none |
| Separation Issues within 21 Days | 45,855 | 97.2% | 90.7% | none |
| Lower Authority Appeals Timeliness | ||||
| Decisions within 30 Days of Filing | 15,477 | 71.0% | 67.9% | 60% |
| Decisions within 45 Days of Filing | 15,477 | 87.3% | 85.4% | 80% |
| Decisions within 90 Days of Filing | 15,477 | 95.6% | 95.5% | 95% (Fiscal Year '02) |
| Higher Authority Appeals Timeliness | ||||
| Decisions within 45 Days of Filing | 2,168 | 67.7% | 62.7% | 50% (Fiscal Year '00) |
| Decisions within 75 Days of Filing | 2,168 | 89.0% | 85.6% | 80% (Fiscal Year '00) |
| Decisions within 150 Days of Filing | 2,168 | 95.6% | 96.3% | 95% (Fiscal Year '00) |
| Combined Wage Program Timeliness | ||||
| Wage Transfers Made within 3 Days | 6,146 | 55.2% | 69.8% | none |
| Wage Transfers Made within 14 Days | 6,146 | 94.7% | 97.3% | none |
| Billing Made within 45 Days | 196 | 100.0% | 92.6% | none |
| Reimbursements Made within 45 Days | 181 | 100.0% | 96.4% | none |
| Continued Claims Payment Timeliness | ||||
| Payments Made within 7 Days | 1,485,641 | 91.6% | 61.4% | none |
| Payments Made within 14 Days | 1,485,641 | 96.3% | 92.5% | none |
| Payments Made within 21 Days | 1,485,641 | 97.8% | 96.3% | none |
| Benefit Quality Measures | ||||
| Nonmon. Determin. with Scores > 80% | 358 | 76.5% | 70.9% | 75% (Fiscal Year '02) |
| LA Appeals with Scores >= 85% | 67 | 90.5% | 90.5% | 80% (Fiscal Year '00) |
| Benefit Payment Control | ||||
| Fraud Overpayment Recovery Rate | 5,095,191 | 49.4% | 50.9% | none |
| Nonfraud Overpayment Recovery Rate | 3,352,396 | 46.0% | 56.1% | none |
| Connecticut | ||||
| REPORTED MEASURE | STATE RESULTS | NATIONAL RESULTS | CRITERION | |
|---|---|---|---|---|
| Cash Management | ||||
| Average time (days) funds are on deposit before being transferred to Trust Fund | 2.0 | 2.1 days | <= 2 (Fiscal Year '00) | |
| Ratio of avg daily loanable balance in Clearing Account to avg daily transfer to Tust Fund | 1.26 | 1.70 | <= 1.75 (Fiscal Year '02) | |
| Benefit Accuracy Measurement | ||||
| Total Dollars Paid in Population | $308,495,421 | $18.8 B | none | |
| Sample Size | 481 | 26,353 | none | |
| Proper Payment Rate | 97.2 +/- 1.3 | 91.5% | none | |
| Overpayment Rate | 2.8 +/- 1.3 | 8.5% | none | |
| Underpayment Rate | 1.3 +/- 0.8 | 0.9% | none | |
| Footnotes: | none | |||
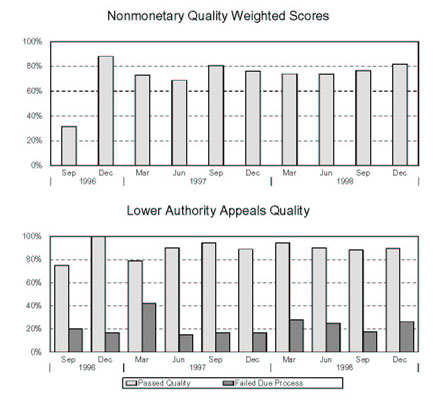
| Connecticut | ||||
| REPORTED MEASURE | STATE RESULTS | NATIONAL RESULTS | ||
|---|---|---|---|---|
| Status Determinations | ||||
| New Employer Determinations: | ||||
| Percentage Made Within 90 Days (Fiscal Year '00 criterion: 60%) | 85.6% | 78.0% | ||
| Percentage Made Within 180 Days (Fiscal Year '00 criterion: 80%) | 91.4% | 89.7% | ||
| Accuracy In Determinations? (Fiscal Year '02 criterion: <= 6 failed) | P | 45.8% Pass | ||
| Accuracy In Postings? | P | 39.6% Pass | ||
| Successor Determinations: | ||||
| Percentage Made Within 90 Days | 70.9% | 67.0% | ||
| Percentage Made Within 180 Days | 84.1% | 81.5% | ||
| Accuracy In Determinations? | P | 54.2% Pass | ||
| Accuracy In Postings? | P | 45.8% Pass | ||
| Inactivations: | ||||
| Accuracy In Determinations? | P | 64.4% Pass | ||
| Accuracy In Postings? | P | 64.6% Pass | ||
| Report Delinquency | ||||
| Reports From Contributory Employers: | ||||
| Percentage Filed Timely | 85.4% | 87.4% | ||
| Percentage Secured | 88.2% | 92.5% | ||
| Percentage Resolved | 97.6% | 97.1% | ||
| Reports From Reimbursing Employers: | ||||
| Percentage Filed Timely | 69.5% | 79.8% | ||
| Percentage Secured | 92.4% | 85.9% | ||
| Percentage Resolved | 96.1% | 87.5% | ||
| Appropriate Actions Taken To Resolve Delinquencies? | P | 76.6% Pass | ||
| Collections | ||||
| Collections From Contributory Employers: | ||||
| Percentage Of Tax Due Paid Timely | 97.9% | 92.0% | ||
| Turnover Ratio - Ratio Of Receivables Liquidated Or Declared Uncollectible/Doubtful To Tax Due | 2.2% | 8.1% | ||
| Percentage of Tax Due Declared Uncollectible/Doubtful | 0.6% | 1.3% | ||
| Accounts Receivable As A Percentage Of Tax Due | 1.3% | 2.2% | ||
| Collections From Reimbursing Employers: | ||||
| Percentage Of Tax Due Paid Timely | 54.3% | 80.6% | ||
| Turnover Ratio - Ratio Of Receivables Liquidated Or Declared Uncollectible/Doubtful To Tax Due | 47.7% | 19.4% | ||
| Percentage of Tax Due Declared Uncollectible/Doubtful | 2.7% | 1.2% | ||
| Accounts Receivable As A Percentage Of Tax Due | 7.5% | 4.6% | ||
| Appropriate Actions Taken To Collect Tax Due? | F | 48.9% Pass | ||
| Cashiering | ||||
| Remittances Deposited Within Three Days? | P | 92.0% Pass | ||
| Field Audit | ||||
| Percent Change In Total Wages Resulting From Audits | 3.0% | 5.0% | ||
| Percentage Of Contributory Employers Audited | 2.1% | 2.0% | ||
| Annualized Percentage Of Total Wages Audited | 1.1% | 1.8% | ||
| Audits Meet Employment Security Manual Requirements? | P | 64.6% Pass | ||
| Account Maintenance | ||||
| Accuracy In Report Processing? | P | 96.0% Pass | ||
| Accuracy In Contributory Employer Billing? | P | 84.8% Pass | ||
| Accuracy In Reimbursing Employer Billings? | P | 85.7% Pass | ||
| Accuracy In Credits/Refunds? | P | 73.9% Pass | ||
| Accuracy In Benefit Charging? | P | 89.6% Pass | ||
| Accuracy In Experience Rating? | P | 87.8% Pass | ||
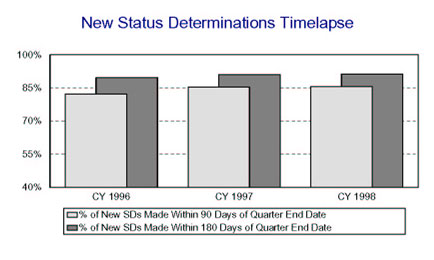
| Delaware | ||||
| REPORTED MEASURE | WORKLOAD | STATE RESULTS |
NATIONAL RESULTS |
CRITERION |
|---|---|---|---|---|
| First Payment Timeliness | ||||
| Intrastate UI, full weeks - 14/21 Days | 21,911 | 94.6% | 90.1% | 87% |
| Intrastate UI, full weeks - 35 Days | 21,911 | 97.7% | 97.2% | 93% |
| Interstate UI, full weeks - 14/21 Days | 1,933 | 76.7% | 78.4% | 70% |
| Interstate UI, full weeks - 35 Days | 1,933 | 90.0% | 92.4% | 78% |
| All First Payments - 14/21 Days | 30,645 | 93.1% | 89.2% | 90% (Fiscal Year '02) |
| All First Payments - 35 Days | 30,645 | 97.2% | 97.0% | 95% (Fiscal Year '02) |
| Nonmonetary Determinations Timeliness: Detection Date to Determination Date |
||||
| Nonseparation Determ. within 14 Days | 2,168 | 62.1% | 68.6% | 80% (Fiscal Year '02) |
| Separation Determ. within 21 Days | 5,857 | 76.1% | 73.3% | 80% (Fiscal Year '02) |
| Nonmonetary Issue Detection Timeliness: First Week Affected to Detection Date |
||||
| Nonseparation Issues within 14 Days | 2,168 | 70.0% | 63.1% | none |
| Separation Issues within 21 Days | 5,857 | 93.7% | 90.7% | none |
| Lower Authority Appeals Timeliness | ||||
| Decisions within 30 Days of Filing | 2,729 | 74.2% | 67.9% | 60% |
| Decisions within 45 Days of Filing | 2,729 | 98.4% | 85.4% | 80% |
| Decisions within 90 Days of Filing | 2,729 | 99.7% | 95.5% | 95% (Fiscal Year '02) |
| Higher Authority Appeals Timeliness | ||||
| Decisions within 45 Days of Filing | 577 | 62.7% | 62.7% | 50% (Fiscal Year '00) |
| Decisions within 75 Days of Filing | 577 | 90.8% | 85.6% | 80% (Fiscal Year '00) |
| Decisions within 150 Days of Filing | 577 | 99.0% | 96.3% | 95% (Fiscal Year '00) |
| Combined Wage Program Timeliness | ||||
| Wage Transfers Made within 3 Days | 5,171 | 82.6% | 69.8% | none |
| Wage Transfers Made within 14 Days | 5,171 | 96.4% | 97.3% | none |
| Billing Made within 45 Days | 140 | 100.0% | 92.6% | none |
| Reimbursements Made within 45 Days | 227 | 100.0% | 96.4% | none |
| Continued Claims Payment Timeliness | ||||
| Payments Made within 7 Days | 292,833 | 79.8% | 61.4% | none |
| Payments Made within 14 Days | 292,833 | 92.9% | 92.5% | none |
| Payments Made within 21 Days | 292,833 | 96.6% | 96.3% | none |
| Benefit Quality Measures | ||||
| Nonmon. Determin. with Scores > 80% | 176 | 75.8% | 70.9% | 75% (Fiscal Year '02) |
| LA Appeals with Scores >= 85% | 74 | 90.0% | 90.5% | 80% (Fiscal Year '00) |
| Benefit Payment Control | ||||
| Fraud Overpayment Recovery Rate | 432,944 | 37.7% | 50.9% | none |
| Nonfraud Overpayment Recovery Rate | 1,911,259 | 65.0% | 56.1% | none |
| Delaware | ||||
| REPORTED MEASURE | STATE RESULTS | NATIONAL RESULTS | CRITERION | |
|---|---|---|---|---|
| Cash Management | ||||
| Average time (days) funds are on deposit before being transferred to Trust Fund | 2.1 | 2.1 days | <= 2 (Fiscal Year '00) | |
| Ratio of avg daily loanable balance in Clearing Account to avg daily transfer to Tust Fund | 2.06 | 1.70 | <= 1.75 (Fiscal Year '02) | |
| Benefit Accuracy Measurement | ||||
| Total Dollars Paid in Population | $55,787,517 | $18.8 B | none | |
| Sample Size | 480 | 26,353 | none | |
| Proper Payment Rate | 87.4 +/- 3.3 | 91.5% | none | |
| Overpayment Rate | 12.6 +/- 3.3 | 8.5% | none | |
| Underpayment Rate | 0.7 +/- 0.4 | 0.9% | none | |
| Footnotes: | none | |||
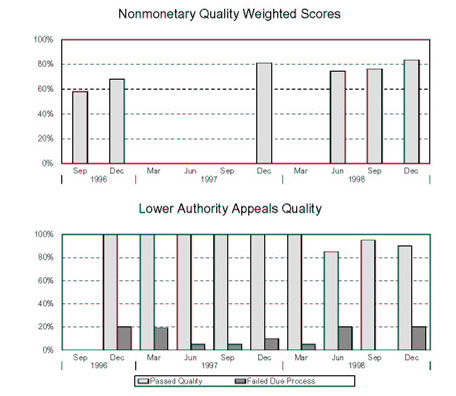
| Delaware | ||||
| REPORTED MEASURE | STATE RESULTS | NATIONAL RESULTS | ||
|---|---|---|---|---|
| Status Determinations | ||||
| New Employer Determinations: | ||||
| Percentage Made Within 90 Days (Fiscal Year '00 criterion: 60%) | 81.7% | 78.0% | ||
| Percentage Made Within 180 Days (Fiscal Year '00 criterion: 80%) | 88.6% | 89.7% | ||
| Accuracy In Determinations? (Fiscal Year '02 criterion: <= 6 failed) | F | 45.8% Pass | ||
| Accuracy In Postings? | F | 39.6% Pass | ||
| Successor Determinations: | ||||
| Percentage Made Within 90 Days | 78.2% | 67.0% | ||
| Percentage Made Within 180 Days | 87.7% | 81.5% | ||
| Accuracy In Determinations? | F | 54.2% Pass | ||
| Accuracy In Postings? | F | 45.8% Pass | ||
| Inactivations: | ||||
| Accuracy In Determinations? | F | 64.4% Pass | ||
| Accuracy In Postings? | F | 64.6% Pass | ||
| Report Delinquency | ||||
| Reports From Contributory Employers: | ||||
| Percentage Filed Timely | 85.7% | 87.4% | ||
| Percentage Secured | 90.9% | 92.5% | ||
| Percentage Resolved | 96.1% | 97.1% | ||
| Reports From Reimbursing Employers: | ||||
| Percentage Filed Timely | 0.0% | 79.8% | ||
| Percentage Secured | 0.0% | 85.9% | ||
| Percentage Resolved | 0.0% | 87.5% | ||
| Appropriate Actions Taken To Resolve Delinquencies? | P | 76.6% Pass | ||
| Collections | ||||
| Collections From Contributory Employers: | ||||
| Percentage Of Tax Due Paid Timely | 76.9% | 92.0% | ||
| Turnover Ratio - Ratio Of Receivables Liquidated Or Declared Uncollectible/Doubtful To Tax Due | 22.2% | 8.1% | ||
| Percentage of Tax Due Declared Uncollectible/Doubtful | 0.8% | 1.3% | ||
| Accounts Receivable As A Percentage Of Tax Due | 8.2% | 2.2% | ||
| Collections From Reimbursing Employers: | ||||
| Percentage Of Tax Due Paid Timely | 80.5% | 80.6% | ||
| Turnover Ratio - Ratio Of Receivables Liquidated Or Declared Uncollectible/Doubtful To Tax Due | 15.6% | 19.4% | ||
| Percentage of Tax Due Declared Uncollectible/Doubtful | 1.2% | 1.2% | ||
| Accounts Receivable As A Percentage Of Tax Due | 9.8% | 4.6% | ||
| Appropriate Actions Taken To Collect Tax Due? | P | 48.9% Pass | ||
| Cashiering | ||||
| Remittances Deposited Within Three Days? | P | 92.0% Pass | ||
| Field Audit | ||||
| Percent Change In Total Wages Resulting From Audits | 5.2% | 5.0% | ||
| Percentage Of Contributory Employers Audited | 1.8% | 2.0% | ||
| Annualized Percentage Of Total Wages Audited | 0.6% | 1.8% | ||
| Audits Meet Employment Security Manual Requirements? | ** | 64.6% Pass | ||
| Account Maintenance | ||||
| Accuracy In Report Processing? | P | 96.0% Pass | ||
| Accuracy In Contributory Employer Billing? | P | 84.8% Pass | ||
| Accuracy In Reimbursing Employer Billings? | P | 85.7% Pass | ||
| Accuracy In Credits/Refunds? | F | 73.9% Pass | ||
| Accuracy In Benefit Charging? | P | 89.6% Pass | ||
| Accuracy In Experience Rating? | P | 87.8% Pass | ||
** State had a problem in establishing the sample universe.
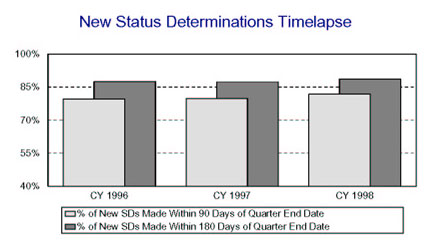
| District of Columbia | ||||
| REPORTED MEASURE | WORKLOAD | STATE RESULTS |
NATIONAL RESULTS |
CRITERION |
|---|---|---|---|---|
| First Payment Timeliness | ||||
| Intrastate UI, full weeks - 14/21 Days | 11,136 | 87.3% | 90.1% | 87% |
| Intrastate UI, full weeks - 35 Days | 11,136 | 92.3% | 97.2% | 93% |
| Interstate UI, full weeks - 14/21 Days | 3,636 | 80.6% | 78.4% | 70% |
| Interstate UI, full weeks - 35 Days | 3,636 | 92.2% | 92.4% | 78% |
| All First Payments - 14/21 Days | 16,820 | 84.4% | 89.2% | 90% (Fiscal Year '02) |
| All First Payments - 35 Days | 16,820 | 92.1% | 97.0% | 95% (Fiscal Year '02) |
| Nonmonetary Determinations Timeliness: Detection Date to Determination Date |
||||
| Nonseparation Determ. within 14 Days | 0 | 0.0% | 68.6% | 80% (Fiscal Year '02) |
| Separation Determ. within 21 Days | 0 | 0.0% | 73.3% | 80% (Fiscal Year '02) |
| Nonmonetary Issue Detection Timeliness: First Week Affected to Detection Date |
||||
| Nonseparation Issues within 14 Days | 0 | 0.0% | 63.1% | none |
| Separation Issues within 21 Days | 0 | 0.0% | 90.7% | none |
| Lower Authority Appeals Timeliness | ||||
| Decisions within 30 Days of Filing | 3,681 | 66.3% | 67.9% | 60% |
| Decisions within 45 Days of Filing | 3,681 | 89.6% | 85.4% | 80% |
| Decisions within 90 Days of Filing | 3,681 | 97.0% | 95.5% | 95% (Fiscal Year '02) |
| Higher Authority Appeals Timeliness | ||||
| Decisions within 45 Days of Filing | 931 | 79.5% | 62.7% | 50% (Fiscal Year '00) |
| Decisions within 75 Days of Filing | 931 | 93.7% | 85.6% | 80% (Fiscal Year '00) |
| Decisions within 150 Days of Filing | 931 | 99.2% | 96.3% | 95% (Fiscal Year '00) |
| Combined Wage Program Timeliness | ||||
| Wage Transfers Made within 3 Days | 0 | 0.0% | 69.8% | none |
| Wage Transfers Made within 14 Days | 0 | 0.0% | 97.3% | none |
| Billing Made within 45 Days | 0 | 0.0% | 92.6% | none |
| Reimbursements Made within 45 Days | 0 | 0.0% | 96.4% | none |
| Continued Claims Payment Timeliness | ||||
| Payments Made within 7 Days | 334,506 | 39.2% | 61.4% | none |
| Payments Made within 14 Days | 334,506 | 86.6% | 92.5% | none |
| Payments Made within 21 Days | 334,506 | 95.1% | 96.3% | none |
| Benefit Quality Measures | ||||
| Nonmon. Determin. with Scores > 80% | * | * | 70.9% | 75% (Fiscal Year '02) |
| LA Appeals with Scores >= 85% | 77 | 91.3% | 90.5% | 80% (Fiscal Year '00) |
| Benefit Payment Control | ||||
| Fraud Overpayment Recovery Rate | 852,151 | 79.3% | 50.9% | none |
| Nonfraud Overpayment Recovery Rate | 811,571 | 71.3% | 56.1% | none |
* State did not submit report as of 8/4/99.
| District of Columbia | ||||
| REPORTED MEASURE | STATE RESULTS | NATIONAL RESULTS | CRITERION | |
|---|---|---|---|---|
| Cash Management | ||||
| Average time (days) funds are on deposit before being transferred to Trust Fund | 3.3 | 2.1 days | <= 2 (Fiscal Year '00) | |
| Ratio of avg daily loanable balance in Clearing Account to avg daily transfer to Tust Fund | 2.66 | 1.70 | <= 1.75 (Fiscal Year '02) | |
| Benefit Accuracy Measurement | ||||
| Total Dollars Paid in Population | $56,676,930 | $18.8 B | none | |
| Sample Size | 360 | 26,353 | none | |
| Proper Payment Rate | 88.2 +/- 3.3 | 91.5% | none | |
| Overpayment Rate | 11.8 +/- 3.3 | 8.5% | none | |
| Underpayment Rate | 1.5 +/- 0.8 | 0.9% | none | |
| Footnotes: | #8 | |||

| District of Columbia | ||||
| REPORTED MEASURE | STATE RESULTS | NATIONAL RESULTS | ||
|---|---|---|---|---|
| Status Determinations | ||||
| New Employer Determinations: | ||||
| Percentage Made Within 90 Days (Fiscal Year '00 criterion: 60%) | 75.0% | 78.0% | ||
| Percentage Made Within 180 Days (Fiscal Year '00 criterion: 80%) | 88.2% | 89.7% | ||
| Accuracy In Determinations? (Fiscal Year '02 criterion: <= 6 failed) | ^ | 45.8% Pass | ||
| Accuracy In Postings? | ^ | 39.6% Pass | ||
| Successor Determinations: | ||||
| Percentage Made Within 90 Days | 83.9% | 67.0% | ||
| Percentage Made Within 180 Days | 93.1% | 81.5% | ||
| Accuracy In Determinations? | ^ | 54.2% Pass | ||
| Accuracy In Postings? | ^ | 45.8% Pass | ||
| Inactivations: | ||||
| Accuracy In Determinations? | ^ | 64.4% Pass | ||
| Accuracy In Postings? | ^ | 64.6% Pass | ||
| Report Delinquency | ||||
| Reports From Contributory Employers: | ||||
| Percentage Filed Timely | 87.3% | 87.4% | ||
| Percentage Secured | 89.5% | 92.5% | ||
| Percentage Resolved | 92.1% | 97.1% | ||
| Reports From Reimbursing Employers: | ||||
| Percentage Filed Timely | 86.4% | 79.8% | ||
| Percentage Secured | 88.8% | 85.9% | ||
| Percentage Resolved | 93.2% | 87.5% | ||
| Appropriate Actions Taken To Resolve Delinquencies? | ^ | 76.6% Pass | ||
| Collections | ||||
| Collections From Contributory Employers: | ||||
| Percentage Of Tax Due Paid Timely | 96.2% | 92.0% | ||
| Turnover Ratio - Ratio Of Receivables Liquidated Or Declared Uncollectible/Doubtful To Tax Due | 4.2% | 8.1% | ||
| Percentage of Tax Due Declared Uncollectible/Doubtful | 1.6% | 1.3% | ||
| Accounts Receivable As A Percentage Of Tax Due | 1.6% | 2.2% | ||
| Collections From Reimbursing Employers: | ||||
| Percentage Of Tax Due Paid Timely | 126.1% | 80.6% | ||
| Turnover Ratio - Ratio Of Receivables Liquidated Or Declared Uncollectible/Doubtful To Tax Due | 132.8% | 19.4% | ||
| Percentage of Tax Due Declared Uncollectible/Doubtful | 1.3% | 1.2% | ||
| Accounts Receivable As A Percentage Of Tax Due | 8.0% | 4.6% | ||
| Appropriate Actions Taken To Collect Tax Due? | ^ | 48.9% Pass | ||
| Cashiering | ||||
| Remittances Deposited Within Three Days? | ^ | 92.0% Pass | ||
| Field Audit | ||||
| Percent Change In Total Wages Resulting From Audits | 0.8% | 5.0% | ||
| Percentage Of Contributory Employers Audited | 1.2% | 2.0% | ||
| Annualized Percentage Of Total Wages Audited | 0.9% | 1.8% | ||
| Audits Meet Employment Security Manual Requirements? | ^ | 64.6% Pass | ||
| Account Maintenance | ||||
| Accuracy In Report Processing? | ^ | 96.0% Pass | ||
| Accuracy In Contributory Employer Billing? | ^ | 84.8% Pass | ||
| Accuracy In Reimbursing Employer Billings? | ^ | 85.7% Pass | ||
| Accuracy In Credits/Refunds? | ^ | 73.9% Pass | ||
| Accuracy In Benefit Charging? | ^ | 89.6% Pass | ||
| Accuracy In Experience Rating? | ^ | 87.8% Pass | ||

| Florida | ||||
| REPORTED MEASURE | WORKLOAD | STATE RESULTS |
NATIONAL RESULTS |
CRITERION |
|---|---|---|---|---|
| First Payment Timeliness | ||||
| Intrastate UI, full weeks - 14/21 Days | 223,704 | 89.2% | 90.1% | 87% |
| Intrastate UI, full weeks - 35 Days | 223,704 | 96.5% | 97.2% | 93% |
| Interstate UI, full weeks - 14/21 Days | 7,363 | 79.4% | 78.4% | 70% |
| Interstate UI, full weeks - 35 Days | 7,363 | 93.3% | 92.4% | 78% |
| All First Payments - 14/21 Days | 245,924 | 88.3% | 89.2% | 90% (Fiscal Year '02) |
| All First Payments - 35 Days | 245,924 | 96.3% | 97.0% | 95% (Fiscal Year '02) |
| Nonmonetary Determinations Timeliness: Detection Date to Determination Date |
||||
| Nonseparation Determ. within 14 Days | 51,552 | 50.6% | 68.6% | 80% (Fiscal Year '02) |
| Separation Determ. within 21 Days | 124,599 | 68.1% | 73.3% | 80% (Fiscal Year '02) |
| Nonmonetary Issue Detection Timeliness: First Week Affected to Detection Date |
||||
| Nonseparation Issues within 14 Days | 51,552 | 67.1% | 63.1% | none |
| Separation Issues within 21 Days | 124,599 | 90.0% | 90.7% | none |
| Lower Authority Appeals Timeliness | ||||
| Decisions within 30 Days of Filing | 48,939 | 69.2% | 67.9% | 60% |
| Decisions within 45 Days of Filing | 48,939 | 86.9% | 85.4% | 80% |
| Decisions within 90 Days of Filing | 48,939 | 92.6% | 95.5% | 95% (Fiscal Year '02) |
| Higher Authority Appeals Timeliness | ||||
| Decisions within 45 Days of Filing | 8,494 | 48.6% | 62.7% | 50% (Fiscal Year '00) |
| Decisions within 75 Days of Filing | 8,494 | 89.5% | 85.6% | 80% (Fiscal Year '00) |
| Decisions within 150 Days of Filing | 8,494 | 99.3% | 96.3% | 95% (Fiscal Year '00) |
| Combined Wage Program Timeliness | ||||
| Wage Transfers Made within 3 Days | 14,019 | 90.9% | 69.8% | none |
| Wage Transfers Made within 14 Days | 14,019 | 97.0% | 97.3% | none |
| Billing Made within 45 Days | 204 | 51.0% | 92.6% | none |
| Reimbursements Made within 45 Days | 198 | 100.0% | 96.4% | none |
| Continued Claims Payment Timeliness | ||||
| Payments Made within 7 Days | 3,009,355 | 42.7% | 61.4% | none |
| Payments Made within 14 Days | 3,009,355 | 89.9% | 92.5% | none |
| Payments Made within 21 Days | 3,009,355 | 95.6% | 96.3% | none |
| Benefit Quality Measures | ||||
| Nonmon. Determin. with Scores > 80% | 314 | 61.9% | 70.9% | 75% (Fiscal Year '02) |
| LA Appeals with Scores >= 85% | 152 | 89.5% | 90.5% | 80% (Fiscal Year '00) |
| Benefit Payment Control | ||||
| Fraud Overpayment Recovery Rate | 999,958 | 116.8% | 50.9% | none |
| Nonfraud Overpayment Recovery Rate | 12,923,594 | 33.8% | 56.1% | none |
| Florida | ||||
| REPORTED MEASURE | STATE RESULTS | NATIONAL RESULTS | CRITERION | |
|---|---|---|---|---|
| Cash Management | ||||
| Average time (days) funds are on deposit before being transferred to Trust Fund | 2.0 | 2.1 days | <= 2 (Fiscal Year '00) | |
| Ratio of avg daily loanable balance in Clearing Account to avg daily transfer to Tust Fund | 0.0 | 1.70 | <= 1.75 (Fiscal Year '02) | |
| Benefit Accuracy Measurement | ||||
| Total Dollars Paid in Population | $598,236,465 | $18.8 B | none | |
| Sample Size | 481 | 26,353 | none | |
| Proper Payment Rate | 93.4 +/- 2.4 | 91.5% | none | |
| Overpayment Rate | 6.6 +/- 2.4 | 8.5% | none | |
| Underpayment Rate | 0.7 +/- 0.5 | 0.9% | none | |
| Footnotes: | none | |||
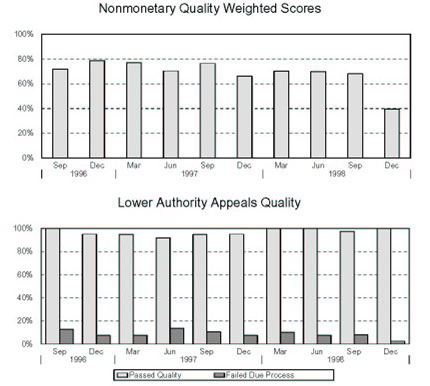
| Florida | ||||
| REPORTED MEASURE | STATE RESULTS | NATIONAL RESULTS | ||
|---|---|---|---|---|
| Status Determinations | ||||
| New Employer Determinations: | ||||
| Percentage Made Within 90 Days (Fiscal Year '00 criterion: 60%) | 56.4% | 78.0% | ||
| Percentage Made Within 180 Days (Fiscal Year '00 criterion: 80%) | 82.2% | 89.7% | ||
| Accuracy In Determinations? (Fiscal Year '02 criterion: <= 6 failed) | F | 45.8% Pass | ||
| Accuracy In Postings? | F | 39.6% Pass | ||
| Successor Determinations: | ||||
| Percentage Made Within 90 Days | 55.9% | 67.0% | ||
| Percentage Made Within 180 Days | 84.8% | 81.5% | ||
| Accuracy In Determinations? | F | 54.2% Pass | ||
| Accuracy In Postings? | F | 45.8% Pass | ||
| Inactivations: | ||||
| Accuracy In Determinations? | F | 64.4% Pass | ||
| Accuracy In Postings? | F | 64.6% Pass | ||
| Report Delinquency | ||||
| Reports From Contributory Employers: | ||||
| Percentage Filed Timely | 95.2% | 87.4% | ||
| Percentage Secured | 99.8% | 92.5% | ||
| Percentage Resolved | 108.0% | 97.1% | ||
| Reports From Reimbursing Employers: | ||||
| Percentage Filed Timely | 97.9% | 79.8% | ||
| Percentage Secured | 99.5% | 85.9% | ||
| Percentage Resolved | 102.1% | 87.5% | ||
| Appropriate Actions Taken To Resolve Delinquencies? | F | 76.6% Pass | ||
| Collections | ||||
| Collections From Contributory Employers: | ||||
| Percentage Of Tax Due Paid Timely | 83.5% | 92.0% | ||
| Turnover Ratio - Ratio Of Receivables Liquidated Or Declared Uncollectible/Doubtful To Tax Due | 16.1% | 8.1% | ||
| Percentage of Tax Due Declared Uncollectible/Doubtful | 1.4% | 1.3% | ||
| Accounts Receivable As A Percentage Of Tax Due | 3.0% | 2.2% | ||
| Collections From Reimbursing Employers: | ||||
| Percentage Of Tax Due Paid Timely | 133.0% | 80.6% | ||
| Turnover Ratio - Ratio Of Receivables Liquidated Or Declared Uncollectible/Doubtful To Tax Due | 135.2% | 19.4% | ||
| Percentage of Tax Due Declared Uncollectible/Doubtful | 1.1% | 1.2% | ||
| Accounts Receivable As A Percentage Of Tax Due | 13.4% | 4.6% | ||
| Appropriate Actions Taken To Collect Tax Due? | ** | 48.9% Pass | ||
| Cashiering | ||||
| Remittances Deposited Within Three Days? | P | 92.0% Pass | ||
| Field Audit | ||||
| Percent Change In Total Wages Resulting From Audits | 0.0% | 5.0% | ||
| Percentage Of Contributory Employers Audited | 1.8% | 2.0% | ||
| Annualized Percentage Of Total Wages Audited | 0.0% | 1.8% | ||
| Audits Meet Employment Security Manual Requirements? | P | 64.6% Pass | ||
| Account Maintenance | ||||
| Accuracy In Report Processing? | P | 96.0% Pass | ||
| Accuracy In Contributory Employer Billing? | ** | 84.8% Pass | ||
| Accuracy In Reimbursing Employer Billings? | ** | 85.7% Pass | ||
| Accuracy In Credits/Refunds? | F | 73.9% Pass | ||
| Accuracy In Benefit Charging? | P | 89.6% Pass | ||
| Accuracy In Experience Rating? | P | 87.8% Pass | ||
State had a problem in establishing the sample universe.
| Georgia | ||||
| REPORTED MEASURE | WORKLOAD | STATE RESULTS |
NATIONAL RESULTS |
CRITERION |
|---|---|---|---|---|
| First Payment Timeliness | ||||
| Intrastate UI, full weeks - 14/21 Days | 114,364 | 91.1% | 90.1% | 87% |
| Intrastate UI, full weeks - 35 Days | 114,364 | 96.1% | 97.2% | 93% |
| Interstate UI, full weeks - 14/21 Days | 2,943 | 82.8% | 78.4% | 70% |
| Interstate UI, full weeks - 35 Days | 2,943 | 92.6% | 92.4% | 78% |
| All First Payments - 14/21 Days | 175,580 | 88.1% | 89.2% | 90% (Fiscal Year '02) |
| All First Payments - 35 Days | 175,580 | 95.3% | 97.0% | 95% (Fiscal Year '02) |
| Nonmonetary Determinations Timeliness: Detection Date to Determination Date |
||||
| Nonseparation Determ. within 14 Days | 23,794 | 50.6% | 68.6% | 80% (Fiscal Year '02) |
| Separation Determ. within 21 Days | 76,163 | 80.1% | 73.3% | 80% (Fiscal Year '02) |
| Nonmonetary Issue Detection Timeliness: First Week Affected to Detection Date |
||||
| Nonseparation Issues within 14 Days | 23,794 | 67.1% | 63.1% | none |
| Separation Issues within 21 Days | 76,163 | 98.3% | 90.7% | none |
| Lower Authority Appeals Timeliness | ||||
| Decisions within 30 Days of Filing | 24,089 | 50.2% | 67.9% | 60% |
| Decisions within 45 Days of Filing | 24,089 | 83.0% | 85.4% | 80% |
| Decisions within 90 Days of Filing | 24,089 | 98.8% | 95.5% | 95% (Fiscal Year '02) |
| Higher Authority Appeals Timeliness | ||||
| Decisions within 45 Days of Filing | 3,360 | 75.5% | 62.7% | 50% (Fiscal Year '00) |
| Decisions within 75 Days of Filing | 3,360 | 99.4% | 85.6% | 80% (Fiscal Year '00) |
| Decisions within 150 Days of Filing | 3,360 | 99.9% | 96.3% | 95% (Fiscal Year '00) |
| Combined Wage Program Timeliness | ||||
| Wage Transfers Made within 3 Days | 13,895 | 91.2% | 69.8% | none |
| Wage Transfers Made within 14 Days | 13,895 | 97.8% | 97.3% | none |
| Billing Made within 45 Days | 137 | 100.0% | 92.6% | none |
| Reimbursements Made within 45 Days | 204 | 100.0% | 96.4% | none |
| Continued Claims Payment Timeliness | ||||
| Payments Made within 7 Days | 1,257,073 | 83.8% | 61.4% | none |
| Payments Made within 14 Days | 1,257,073 | 93.1% | 92.5% | none |
| Payments Made within 21 Days | 1,257,073 | 96.1% | 96.3% | none |
| Benefit Quality Measures | ||||
| Nonmon. Determin. with Scores > 80% | 394 | 75.5% | 70.9% | 75% (Fiscal Year '02) |
| LA Appeals with Scores >= 85% | 78 | 96.3% | 90.5% | 80% (Fiscal Year '00) |
| Benefit Payment Control | ||||
| Fraud Overpayment Recovery Rate | 1,891,010 | 79.4% | 50.9% | none |
| Nonfraud Overpayment Recovery Rate | 4,528,727 | 36.1% | 56.1% | none |
| Georgia | ||||
| REPORTED MEASURE | STATE RESULTS | NATIONAL RESULTS | CRITERION | |
|---|---|---|---|---|
| Cash Management | ||||
| Average time (days) funds are on deposit before being transferred to Trust Fund | 2.6 | 2.1 days | <= 2 (Fiscal Year '00) | |
| Ratio of avg daily loanable balance in Clearing Account to avg daily transfer to Tust Fund | 3.90 | 1.70 | <= 1.75 (Fiscal Year '02) | |
| Benefit Accuracy Measurement | ||||
| Total Dollars Paid in Population | $239,462,087 | $18.8 B | none | |
| Sample Size | 481 | 26,353 | none | |
| Proper Payment Rate | 96.3 +/- 1.7 | 91.5% | none | |
| Overpayment Rate | 3.7 +/- 1.7 | 8.5% | none | |
| Underpayment Rate | 0.4 +/- 0.3 | 0.9% | none | |
| Footnotes: | none | |||
| Georgia | ||||
| REPORTED MEASURE | STATE RESULTS | NATIONAL RESULTS | ||
|---|---|---|---|---|
| Status Determinations | ||||
| New Employer Determinations: | ||||
| Percentage Made Within 90 Days (Fiscal Year '00 criterion: 60%) | 43.9% | 78.0% | ||
| Percentage Made Within 180 Days (Fiscal Year '00 criterion: 80%) | 83.9% | 89.7% | ||
| Accuracy In Determinations? (Fiscal Year '02 criterion: <= 6 failed) | F | 45.8% Pass | ||
| Accuracy In Postings? | F | 39.6% Pass | ||
| Successor Determinations: | ||||
| Percentage Made Within 90 Days | 63.6% | 67.0% | ||
| Percentage Made Within 180 Days | 82.8% | 81.5% | ||
| Accuracy In Determinations? | F | 54.2% Pass | ||
| Accuracy In Postings? | P | 45.8% Pass | ||
| Inactivations: | ||||
| Accuracy In Determinations? | F | 64.4% Pass | ||
| Accuracy In Postings? | P | 64.6% Pass | ||
| Report Delinquency | ||||
| Reports From Contributory Employers: | ||||
| Percentage Filed Timely | 88.3% | 87.4% | ||
| Percentage Secured | 92.1% | 92.5% | ||
| Percentage Resolved | 98.9% | 97.1% | ||
| Reports From Reimbursing Employers: | ||||
| Percentage Filed Timely | 94.2% | 79.8% | ||
| Percentage Secured | 96.0% | 85.9% | ||
| Percentage Resolved | 99.8% | 87.5% | ||
| Appropriate Actions Taken To Resolve Delinquencies? | P | 76.6% Pass | ||
| Collections | ||||
| Collections From Contributory Employers: | ||||
| Percentage Of Tax Due Paid Timely | 94.5% | 92.0% | ||
| Turnover Ratio - Ratio Of Receivables Liquidated Or Declared Uncollectible/Doubtful To Tax Due | 5.9% | 8.1% | ||
| Percentage of Tax Due Declared Uncollectible/Doubtful | 0.6% | 1.3% | ||
| Accounts Receivable As A Percentage Of Tax Due | 2.0% | 2.2% | ||
| Collections From Reimbursing Employers: | ||||
| Percentage Of Tax Due Paid Timely | 32.1% | 80.6% | ||
| Turnover Ratio - Ratio Of Receivables Liquidated Or Declared Uncollectible/Doubtful To Tax Due | 56.6% | 19.4% | ||
| Percentage of Tax Due Declared Uncollectible/Doubtful | 0.1% | 1.2% | ||
| Accounts Receivable As A Percentage Of Tax Due | 12.5% | 4.6% | ||
| Appropriate Actions Taken To Collect Tax Due? | P | 48.9% Pass | ||
| Cashiering | ||||
| Remittances Deposited Within Three Days? | F | 92.0% Pass | ||
| Field Audit | ||||
| Percent Change In Total Wages Resulting From Audits | 1.9% | 5.0% | ||
| Percentage Of Contributory Employers Audited | 2.0% | 2.0% | ||
| Annualized Percentage Of Total Wages Audited | 1.0% | 1.8% | ||
| Audits Meet Employment Security Manual Requirements? | P | 64.6% Pass | ||
| Account Maintenance | ||||
| Accuracy In Report Processing? | P | 96.0% Pass | ||
| Accuracy In Contributory Employer Billing? | ** | 84.8% Pass | ||
| Accuracy In Reimbursing Employer Billings? | P | 85.7% Pass | ||
| Accuracy In Credits/Refunds? | ** | 73.9% Pass | ||
| Accuracy In Benefit Charging? | P | 89.6% Pass | ||
| Accuracy In Experience Rating? | P | 87.8% Pass | ||
State had a problem in establishing the sample universe.
| Hawaii | ||||
| REPORTED MEASURE | WORKLOAD | STATE RESULTS |
NATIONAL RESULTS |
CRITERION |
|---|---|---|---|---|
| First Payment Timeliness | ||||
| Intrastate UI, full weeks - 14/21 Days | 28,869 | 87.7% | 90.1% | 87% |
| Intrastate UI, full weeks - 35 Days | 28,869 | 97.2% | 97.2% | 93% |
| Interstate UI, full weeks - 14/21 Days | 2,068 | 72.7% | 78.4% | 70% |
| Interstate UI, full weeks - 35 Days | 2,068 | 94.5% | 92.4% | 78% |
| All First Payments - 14/21 Days | 38,264 | 85.3% | 89.2% | 90% (Fiscal Year '02) |
| All First Payments - 35 Days | 38,264 | 97.0% | 97.0% | 95% (Fiscal Year '02) |
| Nonmonetary Determinations Timeliness: Detection Date to Determination Date |
||||
| Nonseparation Determ. within 14 Days | 21,917 | 69.6% | 68.6% | 80% (Fiscal Year '02) |
| Separation Determ. within 21 Days | 16,640 | 72.7% | 73.3% | 80% (Fiscal Year '02) |
| Nonmonetary Issue Detection Timeliness: First Week Affected to Detection Date |
||||
| Nonseparation Issues within 14 Days | 21,917 | 48.5% | 63.1% | none |
| Separation Issues within 21 Days | 16,640 | 52.8% | 90.7% | none |
| Lower Authority Appeals Timeliness | ||||
| Decisions within 30 Days of Filing | 4,154 | 72.0% | 67.9% | 60% |
| Decisions within 45 Days of Filing | 4,154 | 89.8% | 85.4% | 80% |
| Decisions within 90 Days of Filing | 4,154 | 97.9% | 95.5% | 95% (Fiscal Year '02) |
| Higher Authority Appeals Timeliness | ||||
| Decisions within 45 Days of Filing | + | + | 62.7% | 50% (Fiscal Year '00) |
| Decisions within 75 Days of Filing | + | + | 85.6% | 80% (Fiscal Year '00) |
| Decisions within 150 Days of Filing | + | + | 96.3% | 95% (Fiscal Year '00) |
| Combined Wage Program Timeliness | ||||
| Wage Transfers Made within 3 Days | 1,346 | 94.9% | 69.8% | none |
| Wage Transfers Made within 14 Days | 1,346 | 99.8% | 97.3% | none |
| Billing Made within 45 Days | 172 | 100.0% | 92.6% | none |
| Reimbursements Made within 45 Days | 154 | 100.0% | 96.4% | none |
| Continued Claims Payment Timeliness | ||||
| Payments Made within 7 Days | 589,502 | 39.6% | 61.4% | none |
| Payments Made within 14 Days | 589,502 | 82.6% | 92.5% | none |
| Payments Made within 21 Days | 589,502 | 94.8% | 96.3% | none |
| Benefit Quality Measures | ||||
| Nonmon. Determin. with Scores > 80% | 232 | 75.0% | 70.9% | 75% (Fiscal Year '02) |
| LA Appeals with Scores >= 85% | 53 | 51.9% | 90.5% | 80% (Fiscal Year '00) |
| Benefit Payment Control | ||||
| Fraud Overpayment Recovery Rate | 282,420 | 55.2% | 50.9% | none |
| Nonfraud Overpayment Recovery Rate | 736,570 | 57.1% | 56.1% | none |
| Hawaii | ||||
| REPORTED MEASURE | STATE RESULTS | NATIONAL RESULTS | CRITERION | |
|---|---|---|---|---|
| Cash Management | ||||
| Average time (days) funds are on deposit before being transferred to Trust Fund | 1.0 | 2.1 days | <= 2 (Fiscal Year '00) | |
| Ratio of avg daily loanable balance in Clearing Account to avg daily transfer to Tust Fund | 3.90 | 1.70 | <= 1.75 (Fiscal Year '02) | |
| Benefit Accuracy Measurement | ||||
| Total Dollars Paid in Population | $137,884,666 | $18.8 B | none | |
| Sample Size | 481 | 26,353 | none | |
| Proper Payment Rate | 97.5 +/- 1.3 | 91.5% | none | |
| Overpayment Rate | 2.5 +/- 1.3 | 8.5% | none | |
| Underpayment Rate | 0.2 +/- 0.1 | 0.9% | none | |
| Footnotes: | none | |||

| Hawaii | ||||
| REPORTED MEASURE | STATE RESULTS | NATIONAL RESULTS | ||
|---|---|---|---|---|
| Status Determinations | ||||
| New Employer Determinations: | ||||
| Percentage Made Within 90 Days (Fiscal Year '00 criterion: 60%) | 88.1% | 78.0% | ||
| Percentage Made Within 180 Days (Fiscal Year '00 criterion: 80%) | 91.5% | 89.7% | ||
| Accuracy In Determinations? (Fiscal Year '02 criterion: <= 6 failed) | P | 45.8% Pass | ||
| Accuracy In Postings? | P | 39.6% Pass | ||
| Successor Determinations: | ||||
| Percentage Made Within 90 Days | 73.1% | 67.0% | ||
| Percentage Made Within 180 Days | 90.3% | 81.5% | ||
| Accuracy In Determinations? | P | 54.2% Pass | ||
| Accuracy In Postings? | P | 45.8% Pass | ||
| Inactivations: | ||||
| Accuracy In Determinations? | P | 64.4% Pass | ||
| Accuracy In Postings? | P | 64.6% Pass | ||
| Report Delinquency | ||||
| Reports From Contributory Employers: | ||||
| Percentage Filed Timely | 84.9% | 87.4% | ||
| Percentage Secured | 91.6% | 92.5% | ||
| Percentage Resolved | 94.3% | 97.1% | ||
| Reports From Reimbursing Employers: | ||||
| Percentage Filed Timely | 79.8% | 79.8% | ||
| Percentage Secured | 85.7% | 85.9% | ||
| Percentage Resolved | 68.2% | 87.5% | ||
| Appropriate Actions Taken To Resolve Delinquencies? | P | 76.6% Pass | ||
| Collections | ||||
| Collections From Contributory Employers: | ||||
| Percentage Of Tax Due Paid Timely | 95.6% | 92.0% | ||
| Turnover Ratio - Ratio Of Receivables Liquidated Or Declared Uncollectible/Doubtful To Tax Due | 5.3% | 8.1% | ||
| Percentage of Tax Due Declared Uncollectible/Doubtful | 1.1% | 1.3% | ||
| Accounts Receivable As A Percentage Of Tax Due | 2.5% | 2.2% | ||
| Collections From Reimbursing Employers: | ||||
| Percentage Of Tax Due Paid Timely | 79.4% | 80.6% | ||
| Turnover Ratio - Ratio Of Receivables Liquidated Or Declared Uncollectible/Doubtful To Tax Due | 20.4% | 19.4% | ||
| Percentage of Tax Due Declared Uncollectible/Doubtful | 0.0% | 1.2% | ||
| Accounts Receivable As A Percentage Of Tax Due | 0.2% | 4.6% | ||
| Appropriate Actions Taken To Collect Tax Due? | P | 48.9% Pass | ||
| Cashiering | ||||
| Remittances Deposited Within Three Days? | P | 92.0% Pass | ||
| Field Audit | ||||
| Percent Change In Total Wages Resulting From Audits | 7.6% | 5.0% | ||
| Percentage Of Contributory Employers Audited | 2.4% | 2.0% | ||
| Annualized Percentage Of Total Wages Audited | 1.0% | 1.8% | ||
| Audits Meet Employment Security Manual Requirements? | F | 64.6% Pass | ||
| Account Maintenance | ||||
| Accuracy In Report Processing? | P | 96.0% Pass | ||
| Accuracy In Contributory Employer Billing? | P | 84.8% Pass | ||
| Accuracy In Reimbursing Employer Billings? | P | 85.7% Pass | ||
| Accuracy In Credits/Refunds? | P | 73.9% Pass | ||
| Accuracy In Benefit Charging? | P | 89.6% Pass | ||
| Accuracy In Experience Rating? | P | 87.8% Pass | ||

| Idaho | ||||
| REPORTED MEASURE | WORKLOAD | STATE RESULTS |
NATIONAL RESULTS |
CRITERION |
|---|---|---|---|---|
| First Payment Timeliness | ||||
| Intrastate UI, full weeks - 14/21 Days | 35,361 | 95.4% | 90.1% | 87% |
| Intrastate UI, full weeks - 35 Days | 35,361 | 98.9% | 97.2% | 93% |
| Interstate UI, full weeks - 14/21 Days | 988 | 80.4% | 78.4% | 70% |
| Interstate UI, full weeks - 35 Days | 988 | 94.9% | 92.4% | 78% |
| All First Payments - 14/21 Days | 43,365 | 95.2% | 89.2% | 90% (Fiscal Year '02) |
| All First Payments - 35 Days | 43,365 | 98.8% | 97.0% | 95% (Fiscal Year '02) |
| Nonmonetary Determinations Timeliness: Detection Date to Determination Date |
||||
| Nonseparation Determ. within 14 Days | 25,440 | 86.1% | 68.6% | 80% (Fiscal Year '02) |
| Separation Determ. within 21 Days | 15,141 | 69.0% | 73.3% | 80% (Fiscal Year '02) |
| Nonmonetary Issue Detection Timeliness: First Week Affected to Detection Date |
||||
| Nonseparation Issues within 14 Days | 25,440 | 86.2% | 63.1% | none |
| Separation Issues within 21 Days | 15,141 | 96.4% | 90.7% | none |
| Lower Authority Appeals Timeliness | ||||
| Decisions within 30 Days of Filing | 3,582 | 43.3% | 67.9% | 60% |
| Decisions within 45 Days of Filing | 3,582 | 80.7% | 85.4% | 80% |
| Decisions within 90 Days of Filing | 3,582 | 97.5% | 95.5% | 95% (Fiscal Year '02) |
| Higher Authority Appeals Timeliness | ||||
| Decisions within 45 Days of Filing | 554 | 62.3% | 62.7% | 50% (Fiscal Year '00) |
| Decisions within 75 Days of Filing | 554 | 71.5% | 85.6% | 80% (Fiscal Year '00) |
| Decisions within 150 Days of Filing | 554 | 73.3% | 96.3% | 95% (Fiscal Year '00) |
| Combined Wage Program Timeliness | ||||
| Wage Transfers Made within 3 Days | 5,882 | 100.0% | 69.8% | none |
| Wage Transfers Made within 14 Days | 5,882 | 100.0% | 97.3% | none |
| Billing Made within 45 Days | 189 | 100.0% | 92.6% | none |
| Reimbursements Made within 45 Days | 173 | 94.8% | 96.4% | none |
| Continued Claims Payment Timeliness | ||||
| Payments Made within 7 Days | 523,030 | 89.2% | 61.4% | none |
| Payments Made within 14 Days | 523,030 | 98.1% | 92.5% | none |
| Payments Made within 21 Days | 523,030 | 99.2% | 96.3% | none |
| Benefit Quality Measures | ||||
| Nonmon. Determin. with Scores > 80% | 233 | 87.6% | 70.9% | 75% (Fiscal Year '02) |
| LA Appeals with Scores >= 85% | 68 | 84.8% | 90.5% | 80% (Fiscal Year '00) |
| Benefit Payment Control | ||||
| Fraud Overpayment Recovery Rate | 1,130,310 | 53.6% | 50.9% | none |
| Nonfraud Overpayment Recovery Rate | 969,352 | 76.2% | 56.1% | none |
| Idaho | ||||
| REPORTED MEASURE | STATE RESULTS | NATIONAL RESULTS | CRITERION | |
|---|---|---|---|---|
| Cash Management | ||||
| Average time (days) funds are on deposit before being transferred to Trust Fund | 2.5 | 2.1 days | <= 2 (Fiscal Year '00) | |
| Ratio of avg daily loanable balance in Clearing Account to avg daily transfer to Tust Fund | 2.34 | 1.70 | <= 1.75 (Fiscal Year '02) | |
| Benefit Accuracy Measurement | ||||
| Total Dollars Paid in Population | $96,995,012 | $18.8 B | none | |
| Sample Size | 483 | 26,353 | none | |
| Proper Payment Rate | 87.5 +/- 3 | 91.5% | none | |
| Overpayment Rate | 12.5 +/- 3 | 8.5% | none | |
| Underpayment Rate | 0.7 +/- 0.5 | 0.9% | none | |
| Footnotes: | none | |||
| Idaho | ||||
| REPORTED MEASURE | STATE RESULTS | NATIONAL RESULTS | ||
|---|---|---|---|---|
| Status Determinations | ||||
| New Employer Determinations: | ||||
| Percentage Made Within 90 Days (Fiscal Year '00 criterion: 60%) | 88.0% | 78.0% | ||
| Percentage Made Within 180 Days (Fiscal Year '00 criterion: 80%) | 92.6% | 89.7% | ||
| Accuracy In Determinations? (Fiscal Year '02 criterion: <= 6 failed) | P | 45.8% Pass | ||
| Accuracy In Postings? | P | 39.6% Pass | ||
| Successor Determinations: | ||||
| Percentage Made Within 90 Days | 91.9% | 67.0% | ||
| Percentage Made Within 180 Days | 96.5% | 81.5% | ||
| Accuracy In Determinations? | P | 54.2% Pass | ||
| Accuracy In Postings? | P | 45.8% Pass | ||
| Inactivations: | ||||
| Accuracy In Determinations? | P | 64.4% Pass | ||
| Accuracy In Postings? | P | 64.6% Pass | ||
| Report Delinquency | ||||
| Reports From Contributory Employers: | ||||
| Percentage Filed Timely | 88.6% | 87.4% | ||
| Percentage Secured | 96.7% | 92.5% | ||
| Percentage Resolved | 98.9% | 97.1% | ||
| Reports From Reimbursing Employers: | ||||
| Percentage Filed Timely | 90.3% | 79.8% | ||
| Percentage Secured | 97.7% | 85.9% | ||
| Percentage Resolved | 99.8% | 87.5% | ||
| Appropriate Actions Taken To Resolve Delinquencies? | P | 76.6% Pass | ||
| Collections | ||||
| Collections From Contributory Employers: | ||||
| Percentage Of Tax Due Paid Timely | 97.4% | 92.0% | ||
| Turnover Ratio - Ratio Of Receivables Liquidated Or Declared Uncollectible/Doubtful To Tax Due | 2.9% | 8.1% | ||
| Percentage of Tax Due Declared Uncollectible/Doubtful | 0.5% | 1.3% | ||
| Accounts Receivable As A Percentage Of Tax Due | 0.8% | 2.2% | ||
| Collections From Reimbursing Employers: | ||||
| Percentage Of Tax Due Paid Timely | 97.2% | 80.6% | ||
| Turnover Ratio - Ratio Of Receivables Liquidated Or Declared Uncollectible/Doubtful To Tax Due | 2.9% | 19.4% | ||
| Percentage of Tax Due Declared Uncollectible/Doubtful | 0.5% | 1.2% | ||
| Accounts Receivable As A Percentage Of Tax Due | 0.9% | 4.6% | ||
| Appropriate Actions Taken To Collect Tax Due? | P | 48.9% Pass | ||
| Cashiering | ||||
| Remittances Deposited Within Three Days? | P | 92.0% Pass | ||
| Field Audit | ||||
| Percent Change In Total Wages Resulting From Audits | 2.4% | 5.0% | ||
| Percentage Of Contributory Employers Audited | 2.2% | 2.0% | ||
| Annualized Percentage Of Total Wages Audited | 2.1% | 1.8% | ||
| Audits Meet Employment Security Manual Requirements? | P | 64.6% Pass | ||
| Account Maintenance | ||||
| Accuracy In Report Processing? | P | 96.0% Pass | ||
| Accuracy In Contributory Employer Billing? | P | 84.8% Pass | ||
| Accuracy In Reimbursing Employer Billings? | P | 85.7% Pass | ||
| Accuracy In Credits/Refunds? | P | 73.9% Pass | ||
| Accuracy In Benefit Charging? | P | 89.6% Pass | ||
| Accuracy In Experience Rating? | ** | 87.8% Pass | ||
** State had a problem in establishing the sample universe.
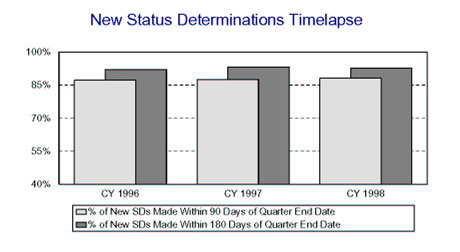
| Illinois | ||||
| REPORTED MEASURE | WORKLOAD | STATE RESULTS |
NATIONAL RESULTS |
CRITERION |
|---|---|---|---|---|
| First Payment Timeliness | ||||
| Intrastate UI, full weeks - 14/21 Days | 250,721 | 91.3% | 90.1% | 87% |
| Intrastate UI, full weeks - 35 Days | 250,721 | 97.2% | 97.2% | 93% |
| Interstate UI, full weeks - 14/21 Days | 9,087 | 80.4% | 78.4% | 70% |
| Interstate UI, full weeks - 35 Days | 9,087 | 94.9% | 92.4% | 78% |
| All First Payments - 14/21 Days | 268,270 | 91.1% | 89.2% | 90% (Fiscal Year '02) |
| All First Payments - 35 Days | 268,270 | 97.1% | 97.0% | 95% (Fiscal Year '02) |
| Nonmonetary Determinations Timeliness: Detection Date to Determination Date |
||||
| Nonseparation Determ. within 14 Days | 141,486 | 68.7% | 68.6% | 80% (Fiscal Year '02) |
| Separation Determ. within 21 Days | 154,214 | 90.0% | 73.3% | 80% (Fiscal Year '02) |
| Nonmonetary Issue Detection Timeliness: First Week Affected to Detection Date |
||||
| Nonseparation Issues within 14 Days | 141,486 | 62.3% | 63.1% | none |
| Separation Issues within 21 Days | 154,214 | 94.4% | 90.7% | none |
| Lower Authority Appeals Timeliness | ||||
| Decisions within 30 Days of Filing | 51,925 | 70.1% | 67.9% | 60% |
| Decisions within 45 Days of Filing | 51,925 | 92.1% | 85.4% | 80% |
| Decisions within 90 Days of Filing | 51,925 | 99.0% | 95.5% | 95% (Fiscal Year '02) |
| Higher Authority Appeals Timeliness | ||||
| Decisions within 45 Days of Filing | 11,044 | 23.9% | 62.7% | 50% (Fiscal Year '00) |
| Decisions within 75 Days of Filing | 11,044 | 71.1% | 85.6% | 80% (Fiscal Year '00) |
| Decisions within 150 Days of Filing | 11,044 | 98.7% | 96.3% | 95% (Fiscal Year '00) |
| Combined Wage Program Timeliness | ||||
| Wage Transfers Made within 3 Days | 12,754 | 40.2% | 69.8% | none |
| Wage Transfers Made within 14 Days | 12,754 | 96.8% | 97.3% | none |
| Billing Made within 45 Days | 0 | 0.0% | 92.6% | none |
| Reimbursements Made within 45 Days | 0 | 0.0% | 96.4% | none |
| Continued Claims Payment Timeliness | ||||
| Payments Made within 7 Days | 4,653,464 | 45.3% | 61.4% | none |
| Payments Made within 14 Days | 4,653,464 | 95.8% | 92.5% | none |
| Payments Made within 21 Days | 4,653,464 | 98.3% | 96.3% | none |
| Benefit Quality Measures | ||||
| Nonmon. Determin. with Scores > 80% | 367 | 63.8% | 70.9% | 75% (Fiscal Year '02) |
| LA Appeals with Scores >= 85% | 145 | 89.4% | 90.5% | 80% (Fiscal Year '00) |
| Benefit Payment Control | ||||
| Fraud Overpayment Recovery Rate | 15,244,389 | 24.4% | 50.9% | none |
| Nonfraud Overpayment Recovery Rate | 26,563,919 | 45.1% | 56.1% | none |
| Illinois | ||||
| REPORTED MEASURE | STATE RESULTS | NATIONAL RESULTS | CRITERION | |
|---|---|---|---|---|
| Cash Management | ||||
| Average time (days) funds are on deposit before being transferred to Trust Fund | 6.1 | 2.1 days | <= 2 (Fiscal Year '00) | |
| Ratio of avg daily loanable balance in Clearing Account to avg daily transfer to Tust Fund | 7.80 | 1.70 | <= 1.75 (Fiscal Year '02) | |
| Benefit Accuracy Measurement | ||||
| Total Dollars Paid in Population | $1,088,069,334 | $18.8 B | none | |
| Sample Size | 603 | 26,353 | none | |
| Proper Payment Rate | 88.9 +/- 2.4 | 91.5% | none | |
| Overpayment Rate | 11.1 +/- 2.4 | 8.5% | none | |
| Underpayment Rate | 1.3 +/- 0.5 | 0.9% | none | |
| Footnotes: | none | |||
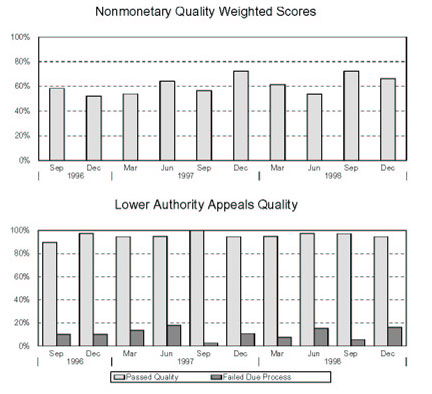
| Illinois | ||||
| REPORTED MEASURE | STATE RESULTS | NATIONAL RESULTS | ||
|---|---|---|---|---|
| Status Determinations | ||||
| New Employer Determinations: | ||||
| Percentage Made Within 90 Days (Fiscal Year '00 criterion: 60%) | 68.5% | 78.0% | ||
| Percentage Made Within 180 Days (Fiscal Year '00 criterion: 80%) | 88.9% | 89.7% | ||
| Accuracy In Determinations? (Fiscal Year '02 criterion: <= 6 failed) | F | 45.8% Pass | ||
| Accuracy In Postings? | F | 39.6% Pass | ||
| Successor Determinations: | ||||
| Percentage Made Within 90 Days | 79.3% | 67.0% | ||
| Percentage Made Within 180 Days | 93.2% | 81.5% | ||
| Accuracy In Determinations? | F | 54.2% Pass | ||
| Accuracy In Postings? | P | 45.8% Pass | ||
| Inactivations: | ||||
| Accuracy In Determinations? | P | 64.4% Pass | ||
| Accuracy In Postings? | P | 64.6% Pass | ||
| Report Delinquency | ||||
| Reports From Contributory Employers: | ||||
| Percentage Filed Timely | 89.2% | 87.4% | ||
| Percentage Secured | 93.7% | 92.5% | ||
| Percentage Resolved | 98.3% | 97.1% | ||
| Reports From Reimbursing Employers: | ||||
| Percentage Filed Timely | 96.3% | 79.8% | ||
| Percentage Secured | 98.4% | 85.9% | ||
| Percentage Resolved | 100.2% | 87.5% | ||
| Appropriate Actions Taken To Resolve Delinquencies? | P | 76.6% Pass | ||
| Collections | ||||
| Collections From Contributory Employers: | ||||
| Percentage Of Tax Due Paid Timely | 98.2% | 92.0% | ||
| Turnover Ratio - Ratio Of Receivables Liquidated Or Declared Uncollectible/Doubtful To Tax Due | 1.6% | 8.1% | ||
| Percentage of Tax Due Declared Uncollectible/Doubtful | 0.8% | 1.3% | ||
| Accounts Receivable As A Percentage Of Tax Due | 1.0% | 2.2% | ||
| Collections From Reimbursing Employers: | ||||
| Percentage Of Tax Due Paid Timely | 98.3% | 80.6% | ||
| Turnover Ratio - Ratio Of Receivables Liquidated Or Declared Uncollectible/Doubtful To Tax Due | 1.0% | 19.4% | ||
| Percentage of Tax Due Declared Uncollectible/Doubtful | 0.3% | 1.2% | ||
| Accounts Receivable As A Percentage Of Tax Due | 0.9% | 4.6% | ||
| Appropriate Actions Taken To Collect Tax Due? | P | 48.9% Pass | ||
| Cashiering | ||||
| Remittances Deposited Within Three Days? | P | 92.0% Pass | ||
| Field Audit | ||||
| Percent Change In Total Wages Resulting From Audits | 7.3% | 5.0% | ||
| Percentage Of Contributory Employers Audited | 2.2% | 2.0% | ||
| Annualized Percentage Of Total Wages Audited | 1.7% | 1.8% | ||
| Audits Meet Employment Security Manual Requirements? | P | 64.6% Pass | ||
| Account Maintenance | ||||
| Accuracy In Report Processing? | P | 96.0% Pass | ||
| Accuracy In Contributory Employer Billing? | P | 84.8% Pass | ||
| Accuracy In Reimbursing Employer Billings? | P | 85.7% Pass | ||
| Accuracy In Credits/Refunds? | P | 73.9% Pass | ||
| Accuracy In Benefit Charging? | P | 89.6% Pass | ||
| Accuracy In Experience Rating? | P | 87.8% Pass | ||
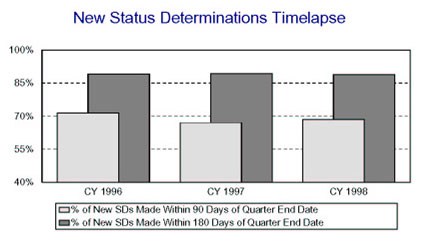
| Indiana | ||||
| REPORTED MEASURE | WORKLOAD | STATE RESULTS |
NATIONAL RESULTS |
CRITERION |
|---|---|---|---|---|
| First Payment Timeliness | ||||
| Intrastate UI, full weeks - 14/21 Days | 106,409 | 90.2% | 90.1% | 87% |
| Intrastate UI, full weeks - 35 Days | 106,409 | 97.3% | 97.2% | 93% |
| Interstate UI, full weeks - 14/21 Days | 3,485 | 70.3% | 78.4% | 70% |
| Interstate UI, full weeks - 35 Days | 3,485 | 87.3% | 92.4% | 78% |
| All First Payments - 14/21 Days | 116,651 | 89.2% | 89.2% | 90% (Fiscal Year '02) |
| All First Payments - 35 Days | 116,651 | 97.0% | 97.0% | 95% (Fiscal Year '02) |
| Nonmonetary Determinations Timeliness: Detection Date to Determination Date |
||||
| Nonseparation Determ. within 14 Days | 41,902 | 68.7% | 68.6% | 80% (Fiscal Year '02) |
| Separation Determ. within 21 Days | 112,904 | 74.4% | 73.3% | 80% (Fiscal Year '02) |
| Nonmonetary Issue Detection Timeliness: First Week Affected to Detection Date |
||||
| Nonseparation Issues within 14 Days | 41,902 | 89.3% | 63.1% | none |
| Separation Issues within 21 Days | 112,904 | 97.8% | 90.7% | none |
| Lower Authority Appeals Timeliness | ||||
| Decisions within 30 Days of Filing | 24,491 | 70.7% | 67.9% | 60% |
| Decisions within 45 Days of Filing | 24,491 | 85.0% | 85.4% | 80% |
| Decisions within 90 Days of Filing | 24,491 | 97.4% | 95.5% | 95% (Fiscal Year '02) |
| Higher Authority Appeals Timeliness | ||||
| Decisions within 45 Days of Filing | 2,924 | 71.8% | 62.7% | 50% (Fiscal Year '00) |
| Decisions within 75 Days of Filing | 2,924 | 79.9% | 85.6% | 80% (Fiscal Year '00) |
| Decisions within 150 Days of Filing | 2,924 | 89.7% | 96.3% | 95% (Fiscal Year '00) |
| Combined Wage Program Timeliness | ||||
| Wage Transfers Made within 3 Days | 14,522 | 78.4% | 69.8% | none |
| Wage Transfers Made within 14 Days | 14,522 | 94.6% | 97.3% | none |
| Billing Made within 45 Days | 189 | 100.0% | 92.6% | none |
| Reimbursements Made within 45 Days | 263 | 100.0% | 96.4% | none |
| Continued Claims Payment Timeliness | ||||
| Payments Made within 7 Days | 1,230,119 | 76.8% | 61.4% | none |
| Payments Made within 14 Days | 1,230,119 | 92.2% | 92.5% | none |
| Payments Made within 21 Days | 1,230,119 | 96.6% | 96.3% | none |
| Benefit Quality Measures | ||||
| Nonmon. Determin. with Scores > 80% | 387 | 76.2% | 70.9% | 75% (Fiscal Year '02) |
| LA Appeals with Scores >= 85% | 73 | 97.3% | 90.5% | 80% (Fiscal Year '00) |
| Benefit Payment Control | ||||
| Fraud Overpayment Recovery Rate | 1,824,794 | 53.4% | 50.9% | none |
| Nonfraud Overpayment Recovery Rate | 5,133,623 | 70.5% | 56.1% | none |
| Indiana | ||||
| REPORTED MEASURE | STATE RESULTS | NATIONAL RESULTS | CRITERION | |
|---|---|---|---|---|
| Cash Management | ||||
| Average time (days) funds are on deposit before being transferred to Trust Fund | 1.0 | 2.1 days | <= 2 (Fiscal Year '00) | |
| Ratio of avg daily loanable balance in Clearing Account to avg daily transfer to Tust Fund | 0.16 | 1.70 | <= 1.75 (Fiscal Year '02) | |
| Benefit Accuracy Measurement | ||||
| Total Dollars Paid in Population | $253,086,782 | $18.8 B | none | |
| Sample Size | 690 | 26,353 | none | |
| Proper Payment Rate | 85.1 +/- 2.8 | 91.5% | none | |
| Overpayment Rate | 14.9 +/- 2.8 | 8.5% | none | |
| Underpayment Rate | 0.4 +/- 0.4 | 0.9% | none | |
| Footnotes: | none | |||
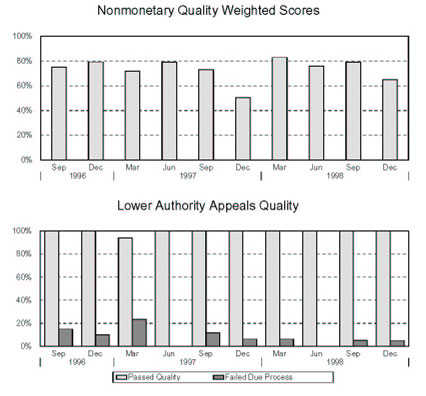
| Indiana | ||||
| REPORTED MEASURE | STATE RESULTS | NATIONAL RESULTS | ||
|---|---|---|---|---|
| Status Determinations | ||||
| New Employer Determinations: | ||||
| Percentage Made Within 90 Days (Fiscal Year '00 criterion: 60%) | 80.9% | 78.0% | ||
| Percentage Made Within 180 Days (Fiscal Year '00 criterion: 80%) | 88.2% | 89.7% | ||
| Accuracy In Determinations? (Fiscal Year '02 criterion: <= 6 failed) | F | 45.8% Pass | ||
| Accuracy In Postings? | F | 39.6% Pass | ||
| Successor Determinations: | ||||
| Percentage Made Within 90 Days | 62.5% | 67.0% | ||
| Percentage Made Within 180 Days | 67.5% | 81.5% | ||
| Accuracy In Determinations? | F | 54.2% Pass | ||
| Accuracy In Postings? | P | 45.8% Pass | ||
| Inactivations: | ||||
| Accuracy In Determinations? | F | 64.4% Pass | ||
| Accuracy In Postings? | F | 64.6% Pass | ||
| Report Delinquency | ||||
| Reports From Contributory Employers: | ||||
| Percentage Filed Timely | 90.2% | 87.4% | ||
| Percentage Secured | 94.6% | 92.5% | ||
| Percentage Resolved | 95.0% | 97.1% | ||
| Reports From Reimbursing Employers: | ||||
| Percentage Filed Timely | 93.7% | 79.8% | ||
| Percentage Secured | 97.3% | 85.9% | ||
| Percentage Resolved | 98.7% | 87.5% | ||
| Appropriate Actions Taken To Resolve Delinquencies? | F | 76.6% Pass | ||
| Collections | ||||
| Collections From Contributory Employers: | ||||
| Percentage Of Tax Due Paid Timely | 94.5% | 92.0% | ||
| Turnover Ratio - Ratio Of Receivables Liquidated Or Declared Uncollectible/Doubtful To Tax Due | 5.6% | 8.1% | ||
| Percentage of Tax Due Declared Uncollectible/Doubtful | 1.5% | 1.3% | ||
| Accounts Receivable As A Percentage Of Tax Due | 2.9% | 2.2% | ||
| Collections From Reimbursing Employers: | ||||
| Percentage Of Tax Due Paid Timely | 80.8% | 80.6% | ||
| Turnover Ratio - Ratio Of Receivables Liquidated Or Declared Uncollectible/Doubtful To Tax Due | 23.1% | 19.4% | ||
| Percentage of Tax Due Declared Uncollectible/Doubtful | 1.4% | 1.2% | ||
| Accounts Receivable As A Percentage Of Tax Due | 4.1% | 4.6% | ||
| Appropriate Actions Taken To Collect Tax Due? | F | 48.9% Pass | ||
| Cashiering | ||||
| Remittances Deposited Within Three Days? | P | 92.0% Pass | ||
| Field Audit | ||||
| Percent Change In Total Wages Resulting From Audits | 1.0% | 5.0% | ||
| Percentage Of Contributory Employers Audited | 2.8% | 2.0% | ||
| Annualized Percentage Of Total Wages Audited | 2.8% | 1.8% | ||
| Audits Meet Employment Security Manual Requirements? | F | 64.6% Pass | ||
| Account Maintenance | ||||
| Accuracy In Report Processing? | P | 96.0% Pass | ||
| Accuracy In Contributory Employer Billing? | P | 84.8% Pass | ||
| Accuracy In Reimbursing Employer Billings? | F | 85.7% Pass | ||
| Accuracy In Credits/Refunds? | P | 73.9% Pass | ||
| Accuracy In Benefit Charging? | P | 89.6% Pass | ||
| Accuracy In Experience Rating? | P | 87.8% Pass | ||
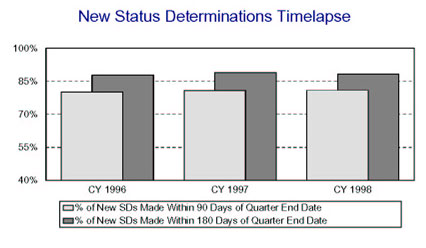
| Iowa | ||||
| REPORTED MEASURE | WORKLOAD | STATE RESULTS |
NATIONAL RESULTS |
CRITERION |
|---|---|---|---|---|
| First Payment Timeliness | ||||
| Intrastate UI, full weeks - 14/21 Days | 47,597 | 93.2% | 90.1% | 87% |
| Intrastate UI, full weeks - 35 Days | 47,597 | 97.6% | 97.2% | 93% |
| Interstate UI, full weeks - 14/21 Days | 1,192 | 81.7% | 78.4% | 70% |
| Interstate UI, full weeks - 35 Days | 1,192 | 93.1% | 92.4% | 78% |
| All First Payments - 14/21 Days | 67,292 | 92.0% | 89.2% | 90% (Fiscal Year '02) |
| All First Payments - 35 Days | 67,292 | 96.8% | 97.0% | 95% (Fiscal Year '02) |
| Nonmonetary Determinations Timeliness: Detection Date to Determination Date |
||||
| Nonseparation Determ. within 14 Days | 23,814 | 80.3% | 68.6% | 80% (Fiscal Year '02) |
| Separation Determ. within 21 Days | 31,219 | 69.4% | 73.3% | 80% (Fiscal Year '02) |
| Nonmonetary Issue Detection Timeliness: First Week Affected to Detection Date |
||||
| Nonseparation Issues within 14 Days | 23,814 | 69.2% | 63.1% | none |
| Separation Issues within 21 Days | 31,219 | 95.0% | 90.7% | none |
| Lower Authority Appeals Timeliness | ||||
| Decisions within 30 Days of Filing | 9,800 | 86.4% | 67.9% | 60% |
| Decisions within 45 Days of Filing | 9,800 | 93.3% | 85.4% | 80% |
| Decisions within 90 Days of Filing | 9,800 | 98.3% | 95.5% | 95% (Fiscal Year '02) |
| Higher Authority Appeals Timeliness | ||||
| Decisions within 45 Days of Filing | 1,921 | 73.8% | 62.7% | 50% (Fiscal Year '00) |
| Decisions within 75 Days of Filing | 1,921 | 98.4% | 85.6% | 80% (Fiscal Year '00) |
| Decisions within 150 Days of Filing | 1,921 | 99.7% | 96.3% | 95% (Fiscal Year '00) |
| Combined Wage Program Timeliness | ||||
| Wage Transfers Made within 3 Days | 7,177 | 97.8% | 69.8% | none |
| Wage Transfers Made within 14 Days | 7,177 | 98.4% | 97.3% | none |
| Billing Made within 45 Days | 0 | 0.0% | 92.6% | none |
| Reimbursements Made within 45 Days | 0 | 0.0% | 96.4% | none |
| Continued Claims Payment Timeliness | ||||
| Payments Made within 7 Days | 742,108 | 72.6% | 61.4% | none |
| Payments Made within 14 Days | 742,108 | 96.8% | 92.5% | none |
| Payments Made within 21 Days | 742,108 | 98.0% | 96.3% | none |
| Benefit Quality Measures | ||||
| Nonmon. Determin. with Scores > 80% | 225 | 80.4% | 70.9% | 75% (Fiscal Year '02) |
| LA Appeals with Scores >= 85% | 79 | 96.3% | 90.5% | 80% (Fiscal Year '00) |
| Benefit Payment Control | ||||
| Fraud Overpayment Recovery Rate | 1,893,080 | 64.1% | 50.9% | none |
| Nonfraud Overpayment Recovery Rate | 3,282,506 | 83.2% | 56.1% | none |
| Iowa | ||||
| REPORTED MEASURE | STATE RESULTS | NATIONAL RESULTS | CRITERION | |
|---|---|---|---|---|
| Cash Management | ||||
| Average time (days) funds are on deposit before being transferred to Trust Fund | 2.3 | 2.1 days | <= 2 (Fiscal Year '00) | |
| Ratio of avg daily loanable balance in Clearing Account to avg daily transfer to Tust Fund | 1.26 | 1.70 | <= 1.75 (Fiscal Year '02) | |
| Benefit Accuracy Measurement | ||||
| Total Dollars Paid in Population | $156,367,178 | $18.8 B | none | |
| Sample Size | 480 | 26,353 | none | |
| Proper Payment Rate | 91.9 +/- 2.5 | 91.5% | none | |
| Overpayment Rate | 8.1 +/- 2.5 | 8.5% | none | |
| Underpayment Rate | 1.1 +/- 0.9 | 0.9% | none | |
| Footnotes: | #1 | |||
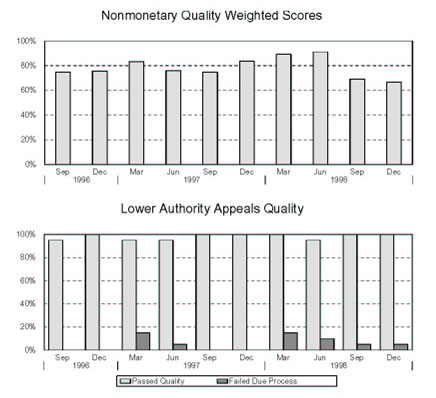
| Iowa | ||||
| REPORTED MEASURE | STATE RESULTS | NATIONAL RESULTS | ||
|---|---|---|---|---|
| Status Determinations | ||||
| New Employer Determinations: | ||||
| Percentage Made Within 90 Days (Fiscal Year '00 criterion: 60%) | 71.5% | 78.0% | ||
| Percentage Made Within 180 Days (Fiscal Year '00 criterion: 80%) | 83.4% | 89.7% | ||
| Accuracy In Determinations? (Fiscal Year '02 criterion: <= 6 failed) | F | 45.8% Pass | ||
| Accuracy In Postings? | F | 39.6% Pass | ||
| Successor Determinations: | ||||
| Percentage Made Within 90 Days | 73.4% | 67.0% | ||
| Percentage Made Within 180 Days | 89.8% | 81.5% | ||
| Accuracy In Determinations? | P | 54.2% Pass | ||
| Accuracy In Postings? | F | 45.8% Pass | ||
| Inactivations: | ||||
| Accuracy In Determinations? | F | 64.4% Pass | ||
| Accuracy In Postings? | P | 64.6% Pass | ||
| Report Delinquency | ||||
| Reports From Contributory Employers: | ||||
| Percentage Filed Timely | 90.3% | 87.4% | ||
| Percentage Secured | 97.6% | 92.5% | ||
| Percentage Resolved | 99.6% | 97.1% | ||
| Reports From Reimbursing Employers: | ||||
| Percentage Filed Timely | 96.9% | 79.8% | ||
| Percentage Secured | 99.3% | 85.9% | ||
| Percentage Resolved | 99.9% | 87.5% | ||
| Appropriate Actions Taken To Resolve Delinquencies? | P | 76.6% Pass | ||
| Collections | ||||
| Collections From Contributory Employers: | ||||
| Percentage Of Tax Due Paid Timely | 96.8% | 92.0% | ||
| Turnover Ratio - Ratio Of Receivables Liquidated Or Declared Uncollectible/Doubtful To Tax Due | 2.9% | 8.1% | ||
| Percentage of Tax Due Declared Uncollectible/Doubtful | 0.5% | 1.3% | ||
| Accounts Receivable As A Percentage Of Tax Due | 1.4% | 2.2% | ||
| Collections From Reimbursing Employers: | ||||
| Percentage Of Tax Due Paid Timely | 93.0% | 80.6% | ||
| Turnover Ratio - Ratio Of Receivables Liquidated Or Declared Uncollectible/Doubtful To Tax Due | 6.2% | 19.4% | ||
| Percentage of Tax Due Declared Uncollectible/Doubtful | 0.2% | 1.2% | ||
| Accounts Receivable As A Percentage Of Tax Due | 1.1% | 4.6% | ||
| Appropriate Actions Taken To Collect Tax Due? | F | 48.9% Pass | ||
| Cashiering | ||||
| Remittances Deposited Within Three Days? | P | 92.0% Pass | ||
| Field Audit | ||||
| Percent Change In Total Wages Resulting From Audits | 4.8% | 5.0% | ||
| Percentage Of Contributory Employers Audited | 2.1% | 2.0% | ||
| Annualized Percentage Of Total Wages Audited | 1.0% | 1.8% | ||
| Audits Meet Employment Security Manual Requirements? | F | 64.6% Pass | ||
| Account Maintenance | ||||
| Accuracy In Report Processing? | P | 96.0% Pass | ||
| Accuracy In Contributory Employer Billing? | P | 84.8% Pass | ||
| Accuracy In Reimbursing Employer Billings? | P | 85.7% Pass | ||
| Accuracy In Credits/Refunds? | F | 73.9% Pass | ||
| Accuracy In Benefit Charging? | P | 89.6% Pass | ||
| Accuracy In Experience Rating? | P | 87.8% Pass | ||
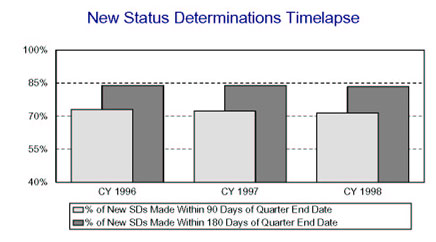
| Kansas | ||||
| REPORTED MEASURE | WORKLOAD | STATE RESULTS |
NATIONAL RESULTS |
CRITERION |
|---|---|---|---|---|
| First Payment Timeliness | ||||
| Intrastate UI, full weeks - 14/21 Days | 40,398 | 84.2% | 90.1% | 87% |
| Intrastate UI, full weeks - 35 Days | 40,398 | 96.5% | 97.2% | 93% |
| Interstate UI, full weeks - 14/21 Days | 3,692 | 74.9% | 78.4% | 70% |
| Interstate UI, full weeks - 35 Days | 3,692 | 93.1% | 92.4% | 78% |
| All First Payments - 14/21 Days | 50,783 | 83.7% | 89.2% | 90% (Fiscal Year '02) |
| All First Payments - 35 Days | 50,783 | 96.2% | 97.0% | 95% (Fiscal Year '02) |
| Nonmonetary Determinations Timeliness: Detection Date to Determination Date |
||||
| Nonseparation Determ. within 14 Days | 25,067 | 60.3% | 68.6% | 80% (Fiscal Year '02) |
| Separation Determ. within 21 Days | 31,618 | 59.9% | 73.3% | 80% (Fiscal Year '02) |
| Nonmonetary Issue Detection Timeliness: First Week Affected to Detection Date |
||||
| Nonseparation Issues within 14 Days | 25,067 | 77.3% | 63.1% | none |
| Separation Issues within 21 Days | 31,618 | 98.7% | 90.7% | none |
| Lower Authority Appeals Timeliness | ||||
| Decisions within 30 Days of Filing | 10,052 | 89.9% | 67.9% | 60% |
| Decisions within 45 Days of Filing | 10,052 | 97.7% | 85.4% | 80% |
| Decisions within 90 Days of Filing | 10,052 | 99.8% | 95.5% | 95% (Fiscal Year '02) |
| Higher Authority Appeals Timeliness | ||||
| Decisions within 45 Days of Filing | 2,342 | 94.8% | 62.7% | 50% (Fiscal Year '00) |
| Decisions within 75 Days of Filing | 2,342 | 97.7% | 85.6% | 80% (Fiscal Year '00) |
| Decisions within 150 Days of Filing | 2,342 | 99.8% | 96.3% | 95% (Fiscal Year '00) |
| Combined Wage Program Timeliness | ||||
| Wage Transfers Made within 3 Days | 7,810 | 100.0% | 69.8% | none |
| Wage Transfers Made within 14 Days | 7,810 | 100.0% | 97.3% | none |
| Billing Made within 45 Days | 195 | 100.0% | 92.6% | none |
| Reimbursements Made within 45 Days | 155 | 61.9% | 96.4% | none |
| Continued Claims Payment Timeliness | ||||
| Payments Made within 7 Days | 591,266 | 90.6% | 61.4% | none |
| Payments Made within 14 Days | 591,266 | 95.8% | 92.5% | none |
| Payments Made within 21 Days | 591,266 | 97.5% | 96.3% | none |
| Benefit Quality Measures | ||||
| Nonmon. Determin. with Scores > 80% | 232 | 53.2% | 70.9% | 75% (Fiscal Year '02) |
| LA Appeals with Scores >= 85% | 79 | 93.8% | 90.5% | 80% (Fiscal Year '00) |
| Benefit Payment Control | ||||
| Fraud Overpayment Recovery Rate | 1,124,794 | 72.5% | 50.9% | none |
| Nonfraud Overpayment Recovery Rate | 2,825,227 | 65.8% | 56.1% | none |
| Kansas | ||||
| REPORTED MEASURE | STATE RESULTS | NATIONAL RESULTS | CRITERION | |
|---|---|---|---|---|
| Cash Management | ||||
| Average time (days) funds are on deposit before being transferred to Trust Fund | 2.7 | 2.1 days | <= 2 (Fiscal Year '00) | |
| Ratio of avg daily loanable balance in Clearing Account to avg daily transfer to Tust Fund | 2.03 | 1.70 | <= 1.75 (Fiscal Year '02) | |
| Benefit Accuracy Measurement | ||||
| Total Dollars Paid in Population | $128,186,480 | $18.8 B | none | |
| Sample Size | 492 | 26,353 | none | |
| Proper Payment Rate | 88.3 +/- 2.8 | 91.5% | none | |
| Overpayment Rate | 11.7 +/- 2.8 | 8.5% | none | |
| Underpayment Rate | 0 +/- 0.1 | 0.9% | none | |
| Footnotes: | none | |||
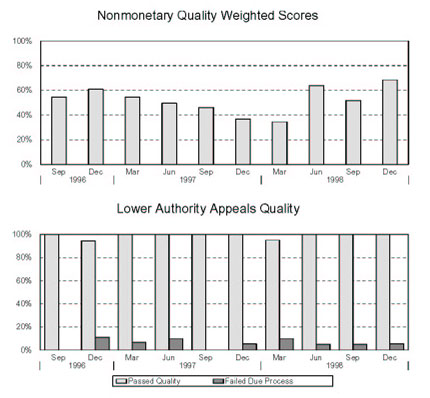
| Kansas | ||||
| REPORTED MEASURE | STATE RESULTS | NATIONAL RESULTS | ||
|---|---|---|---|---|
| Status Determinations | ||||
| New Employer Determinations: | ||||
| Percentage Made Within 90 Days (Fiscal Year '00 criterion: 60%) | 99.3% | 78.0% | ||
| Percentage Made Within 180 Days (Fiscal Year '00 criterion: 80%) | 99.4% | 89.7% | ||
| Accuracy In Determinations? (Fiscal Year '02 criterion: <= 6 failed) | P | 45.8% Pass | ||
| Accuracy In Postings? | P | 39.6% Pass | ||
| Successor Determinations: | ||||
| Percentage Made Within 90 Days | 98.7% | 67.0% | ||
| Percentage Made Within 180 Days | 99.4% | 81.5% | ||
| Accuracy In Determinations? | P | 54.2% Pass | ||
| Accuracy In Postings? | P | 45.8% Pass | ||
| Inactivations: | ||||
| Accuracy In Determinations? | P | 64.4% Pass | ||
| Accuracy In Postings? | P | 64.6% Pass | ||
| Report Delinquency | ||||
| Reports From Contributory Employers: | ||||
| Percentage Filed Timely | 89.5% | 87.4% | ||
| Percentage Secured | 97.4% | 92.5% | ||
| Percentage Resolved | 99.8% | 97.1% | ||
| Reports From Reimbursing Employers: | ||||
| Percentage Filed Timely | 96.1% | 79.8% | ||
| Percentage Secured | 99.8% | 85.9% | ||
| Percentage Resolved | 100.0% | 87.5% | ||
| Appropriate Actions Taken To Resolve Delinquencies? | P | 76.6% Pass | ||
| Collections | ||||
| Collections From Contributory Employers: | ||||
| Percentage Of Tax Due Paid Timely | 97.5% | 92.0% | ||
| Turnover Ratio - Ratio Of Receivables Liquidated Or Declared Uncollectible/Doubtful To Tax Due | 2.5% | 8.1% | ||
| Percentage of Tax Due Declared Uncollectible/Doubtful | 0.7% | 1.3% | ||
| Accounts Receivable As A Percentage Of Tax Due | 0.7% | 2.2% | ||
| Collections From Reimbursing Employers: | ||||
| Percentage Of Tax Due Paid Timely | 93.9% | 80.6% | ||
| Turnover Ratio - Ratio Of Receivables Liquidated Or Declared Uncollectible/Doubtful To Tax Due | 8.0% | 19.4% | ||
| Percentage of Tax Due Declared Uncollectible/Doubtful | 0.0% | 1.2% | ||
| Accounts Receivable As A Percentage Of Tax Due | 0.2% | 4.6% | ||
| Appropriate Actions Taken To Collect Tax Due? | P | 48.9% Pass | ||
| Cashiering | ||||
| Remittances Deposited Within Three Days? | P | 92.0% Pass | ||
| Field Audit | ||||
| Percent Change In Total Wages Resulting From Audits | 1.6% | 5.0% | ||
| Percentage Of Contributory Employers Audited | 2.1% | 2.0% | ||
| Annualized Percentage Of Total Wages Audited | 0.5% | 1.8% | ||
| Audits Meet Employment Security Manual Requirements? | P | 64.6% Pass | ||
| Account Maintenance | ||||
| Accuracy In Report Processing? | P | 96.0% Pass | ||
| Accuracy In Contributory Employer Billing? | P | 84.8% Pass | ||
| Accuracy In Reimbursing Employer Billings? | P | 85.7% Pass | ||
| Accuracy In Credits/Refunds? | P | 73.9% Pass | ||
| Accuracy In Benefit Charging? | P | 89.6% Pass | ||
| Accuracy In Experience Rating? | P | 87.8% Pass | ||

| Kentucky | ||||
| REPORTED MEASURE | WORKLOAD | STATE RESULTS |
NATIONAL RESULTS |
CRITERION |
|---|---|---|---|---|
| First Payment Timeliness | ||||
| Intrastate UI, full weeks - 14/21 Days | 69,645 | 92.8% | 90.1% | 87% |
| Intrastate UI, full weeks - 35 Days | 69,645 | 97.7% | 97.2% | 93% |
| Interstate UI, full weeks - 14/21 Days | 1,431 | 76.7% | 78.4% | 70% |
| Interstate UI, full weeks - 35 Days | 1,431 | 90.4% | 92.4% | 78% |
| All First Payments - 14/21 Days | 111,956 | 92.1% | 89.2% | 90% (Fiscal Year '02) |
| All First Payments - 35 Days | 111,956 | 97.7% | 97.0% | 95% (Fiscal Year '02) |
| Nonmonetary Determinations Timeliness: Detection Date to Determination Date |
||||
| Nonseparation Determ. within 14 Days | 7,826 | 67.8% | 68.6% | 80% (Fiscal Year '02) |
| Separation Determ. within 21 Days | 26,165 | 77.0% | 73.3% | 80% (Fiscal Year '02) |
| Nonmonetary Issue Detection Timeliness: First Week Affected to Detection Date |
||||
| Nonseparation Issues within 14 Days | 7,091 | 72.2% | 63.1% | none |
| Separation Issues within 21 Days | 26,883 | 95.2% | 90.7% | none |
| Lower Authority Appeals Timeliness | ||||
| Decisions within 30 Days of Filing | 8,104 | 68.6% | 67.9% | 60% |
| Decisions within 45 Days of Filing | 8,104 | 86.4% | 85.4% | 80% |
| Decisions within 90 Days of Filing | 8,104 | 98.0% | 95.5% | 95% (Fiscal Year '02) |
| Higher Authority Appeals Timeliness | ||||
| Decisions within 45 Days of Filing | 1,625 | 79.6% | 62.7% | 50% (Fiscal Year '00) |
| Decisions within 75 Days of Filing | 1,625 | 98.1% | 85.6% | 80% (Fiscal Year '00) |
| Decisions within 150 Days of Filing | 1,625 | 99.8% | 96.3% | 95% (Fiscal Year '00) |
| Combined Wage Program Timeliness | ||||
| Wage Transfers Made within 3 Days | 11,221 | 67.0% | 69.8% | none |
| Wage Transfers Made within 14 Days | 11,221 | 97.2% | 97.3% | none |
| Billing Made within 45 Days | 196 | 100.0% | 92.6% | none |
| Reimbursements Made within 45 Days | 190 | 100.0% | 96.4% | none |
| Continued Claims Payment Timeliness | ||||
| Payments Made within 7 Days | 1,205,320 | 44.1% | 61.4% | none |
| Payments Made within 14 Days | 1,205,320 | 90.7% | 92.5% | none |
| Payments Made within 21 Days | 1,205,320 | 96.6% | 96.3% | none |
| Benefit Quality Measures | ||||
| Nonmon. Determin. with Scores > 80% | 233 | 77.4% | 70.9% | 75% (Fiscal Year '02) |
| LA Appeals with Scores >= 85% | 76 | 100.0% | 90.5% | 80% (Fiscal Year '00) |
| Benefit Payment Control | ||||
| Fraud Overpayment Recovery Rate | 1,388,802 | 63.8% | 50.9% | none |
| Nonfraud Overpayment Recovery Rate | 1,883,857 | 67.7% | 56.1% | none |
| Kentucky | ||||
| REPORTED MEASURE | STATE RESULTS | NATIONAL RESULTS | CRITERION | |
|---|---|---|---|---|
| Cash Management | ||||
| Average time (days) funds are on deposit before being transferred to Trust Fund | 1.3 | 2.1 days | <= 2 (Fiscal Year '00) | |
| Ratio of avg daily loanable balance in Clearing Account to avg daily transfer to Tust Fund | 0.35 | 1.70 | <= 1.75 (Fiscal Year '02) | |
| Benefit Accuracy Measurement | ||||
| Total Dollars Paid in Population | $215,796,260 | $18.8 B | none | |
| Sample Size | 484 | 26,353 | none | |
| Proper Payment Rate | 95 +/- 1.9 | 91.5% | none | |
| Overpayment Rate | 5 +/- 1.9 | 8.5% | none | |
| Underpayment Rate | 0.5 +/- 0.2 | 0.9% | none | |
| Footnotes: | none | |||
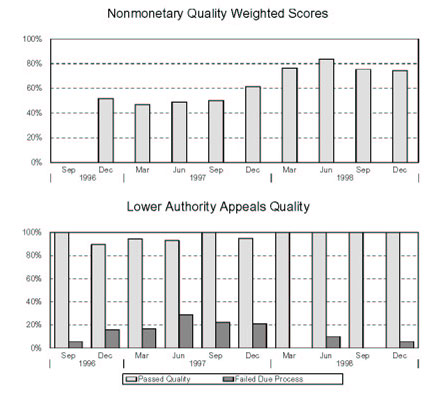
| Kentucky | ||||
| REPORTED MEASURE | STATE RESULTS | NATIONAL RESULTS | ||
|---|---|---|---|---|
| Status Determinations | ||||
| New Employer Determinations: | ||||
| Percentage Made Within 90 Days (Fiscal Year '00 criterion: 60%) | 86.3% | 78.0% | ||
| Percentage Made Within 180 Days (Fiscal Year '00 criterion: 80%) | 91.9% | 89.7% | ||
| Accuracy In Determinations? (Fiscal Year '02 criterion: <= 6 failed) | P | 45.8% Pass | ||
| Accuracy In Postings? | F | 39.6% Pass | ||
| Successor Determinations: | ||||
| Percentage Made Within 90 Days | 60.2% | 67.0% | ||
| Percentage Made Within 180 Days | 74.4% | 81.5% | ||
| Accuracy In Determinations? | P | 54.2% Pass | ||
| Accuracy In Postings? | F | 45.8% Pass | ||
| Inactivations: | ||||
| Accuracy In Determinations? | P | 64.4% Pass | ||
| Accuracy In Postings? | P | 64.6% Pass | ||
| Report Delinquency | ||||
| Reports From Contributory Employers: | ||||
| Percentage Filed Timely | 90.4% | 87.4% | ||
| Percentage Secured | 95.3% | 92.5% | ||
| Percentage Resolved | 99.4% | 97.1% | ||
| Reports From Reimbursing Employers: | ||||
| Percentage Filed Timely | 87.9% | 79.8% | ||
| Percentage Secured | 97.2% | 85.9% | ||
| Percentage Resolved | 98.5% | 87.5% | ||
| Appropriate Actions Taken To Resolve Delinquencies? | P | 76.6% Pass | ||
| Collections | ||||
| Collections From Contributory Employers: | ||||
| Percentage Of Tax Due Paid Timely | 96.4% | 92.0% | ||
| Turnover Ratio - Ratio Of Receivables Liquidated Or Declared Uncollectible/Doubtful To Tax Due | 3.6% | 8.1% | ||
| Percentage of Tax Due Declared Uncollectible/Doubtful | 0.8% | 1.3% | ||
| Accounts Receivable As A Percentage Of Tax Due | 1.6% | 2.2% | ||
| Collections From Reimbursing Employers: | ||||
| Percentage Of Tax Due Paid Timely | 84.8% | 80.6% | ||
| Turnover Ratio - Ratio Of Receivables Liquidated Or Declared Uncollectible/Doubtful To Tax Due | 12.1% | 19.4% | ||
| Percentage of Tax Due Declared Uncollectible/Doubtful | 0.1% | 1.2% | ||
| Accounts Receivable As A Percentage Of Tax Due | 3.9% | 4.6% | ||
| Appropriate Actions Taken To Collect Tax Due? | F | 48.9% Pass | ||
| Cashiering | ||||
| Remittances Deposited Within Three Days? | F | 92.0% Pass | ||
| Field Audit | ||||
| Percent Change In Total Wages Resulting From Audits | 5.5% | 5.0% | ||
| Percentage Of Contributory Employers Audited | 1.0% | 2.0% | ||
| Annualized Percentage Of Total Wages Audited | 0.3% | 1.8% | ||
| Audits Meet Employment Security Manual Requirements? | P | 64.6% Pass | ||
| Account Maintenance | ||||
| Accuracy In Report Processing? | P | 96.0% Pass | ||
| Accuracy In Contributory Employer Billing? | P | 84.8% Pass | ||
| Accuracy In Reimbursing Employer Billings? | P | 85.7% Pass | ||
| Accuracy In Credits/Refunds? | P | 73.9% Pass | ||
| Accuracy In Benefit Charging? | P | 89.6% Pass | ||
| Accuracy In Experience Rating? | P | 87.8% Pass | ||
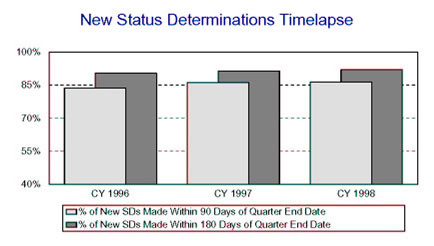
| Louisiana | ||||
| REPORTED MEASURE | WORKLOAD | STATE RESULTS |
NATIONAL RESULTS |
CRITERION |
|---|---|---|---|---|
| First Payment Timeliness | ||||
| Intrastate UI, full weeks - 14/21 Days | 54,595 | 89.3% | 90.1% | 87% |
| Intrastate UI, full weeks - 35 Days | 54,595 | 96.7% | 97.2% | 93% |
| Interstate UI, full weeks - 14/21 Days | 2,234 | 79.7% | 78.4% | 70% |
| Interstate UI, full weeks - 35 Days | 2,234 | 94.8% | 92.4% | 78% |
| All First Payments - 14/21 Days | 61,809 | 89.2% | 89.2% | 90% (Fiscal Year '02) |
| All First Payments - 35 Days | 61,809 | 96.7% | 97.0% | 95% (Fiscal Year '02) |
| Nonmonetary Determinations Timeliness: Detection Date to Determination Date |
||||
| Nonseparation Determ. within 14 Days | 36,501 | 41.3% | 68.6% | 80% (Fiscal Year '02) |
| Separation Determ. within 21 Days | 70,949 | 55.8% | 73.3% | 80% (Fiscal Year '02) |
| Nonmonetary Issue Detection Timeliness: First Week Affected to Detection Date |
||||
| Nonseparation Issues within 14 Days | 36,501 | 88.4% | 63.1% | none |
| Separation Issues within 21 Days | 70,949 | 97.1% | 90.7% | none |
| Lower Authority Appeals Timeliness | ||||
| Decisions within 30 Days of Filing | 16,611 | 75.8% | 67.9% | 60% |
| Decisions within 45 Days of Filing | 16,611 | 90.5% | 85.4% | 80% |
| Decisions within 90 Days of Filing | 16,611 | 98.7% | 95.5% | 95% (Fiscal Year '02) |
| Higher Authority Appeals Timeliness | ||||
| Decisions within 45 Days of Filing | 2,391 | 62.2% | 62.7% | 50% (Fiscal Year '00) |
| Decisions within 75 Days of Filing | 2,391 | 94.7% | 85.6% | 80% (Fiscal Year '00) |
| Decisions within 150 Days of Filing | 2,391 | 99.7% | 96.3% | 95% (Fiscal Year '00) |
| Combined Wage Program Timeliness | ||||
| Wage Transfers Made within 3 Days | 10,989 | 100.0% | 69.8% | none |
| Wage Transfers Made within 14 Days | 10,989 | 100.0% | 97.3% | none |
| Billing Made within 45 Days | 198 | 75.3% | 92.6% | none |
| Reimbursements Made within 45 Days | 175 | 100.0% | 96.4% | none |
| Continued Claims Payment Timeliness | ||||
| Payments Made within 7 Days | 920,545 | 95.1% | 61.4% | none |
| Payments Made within 14 Days | 920,545 | 97.5% | 92.5% | none |
| Payments Made within 21 Days | 920,545 | 98.2% | 96.3% | none |
| Benefit Quality Measures | ||||
| Nonmon. Determin. with Scores > 80% | 387 | 56.6% | 70.9% | 75% (Fiscal Year '02) |
| LA Appeals with Scores >= 85% | 79 | 96.3% | 90.5% | 80% (Fiscal Year '00) |
| Benefit Payment Control | ||||
| Fraud Overpayment Recovery Rate | 2,352,863 | 38.5% | 50.9% | none |
| Nonfraud Overpayment Recovery Rate | 3,422,127 | 49.7% | 56.1% | none |
| Louisiana | ||||
| REPORTED MEASURE | STATE RESULTS | NATIONAL RESULTS | CRITERION | |
|---|---|---|---|---|
| Cash Management | ||||
| Average time (days) funds are on deposit before being transferred to Trust Fund | 1.7 | 2.1 days | <= 2 (Fiscal Year '00) | |
| Ratio of avg daily loanable balance in Clearing Account to avg daily transfer to Tust Fund | 0.73 | 1.70 | <= 1.75 (Fiscal Year '02) | |
| Benefit Accuracy Measurement | ||||
| Total Dollars Paid in Population | $136,733,048 | $18.8 B | none | |
| Sample Size | 520 | 26,353 | none | |
| Proper Payment Rate | 90.3 +/- 2.6 | 91.5% | none | |
| Overpayment Rate | 9.7 +/- 2.6 | 8.5% | none | |
| Underpayment Rate | 0.6 +/- 0.3 | 0.9% | none | |
| Footnotes: | none | |||
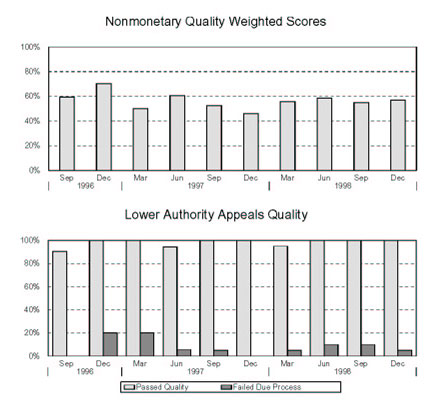
| Louisiana | ||||
| REPORTED MEASURE | STATE RESULTS | NATIONAL RESULTS | ||
|---|---|---|---|---|
| Status Determinations | ||||
| New Employer Determinations: | ||||
| Percentage Made Within 90 Days (Fiscal Year '00 criterion: 60%) | 79.5% | 78.0% | ||
| Percentage Made Within 180 Days (Fiscal Year '00 criterion: 80%) | 87.4% | 89.7% | ||
| Accuracy In Determinations? (Fiscal Year '02 criterion: <= 6 failed) | F | 45.8% Pass | ||
| Accuracy In Postings? | F | 39.6% Pass | ||
| Successor Determinations: | ||||
| Percentage Made Within 90 Days | 49.2% | 67.0% | ||
| Percentage Made Within 180 Days | 76.7% | 81.5% | ||
| Accuracy In Determinations? | F | 54.2% Pass | ||
| Accuracy In Postings? | F | 45.8% Pass | ||
| Inactivations: | ||||
| Accuracy In Determinations? | F | 64.4% Pass | ||
| Accuracy In Postings? | F | 64.6% Pass | ||
| Report Delinquency | ||||
| Reports From Contributory Employers: | ||||
| Percentage Filed Timely | 85.1% | 87.4% | ||
| Percentage Secured | 93.4% | 92.5% | ||
| Percentage Resolved | 100.7% | 97.1% | ||
| Reports From Reimbursing Employers: | ||||
| Percentage Filed Timely | 85.1% | 79.8% | ||
| Percentage Secured | 93.4% | 85.9% | ||
| Percentage Resolved | 92.6% | 87.5% | ||
| Appropriate Actions Taken To Resolve Delinquencies? | F | 76.6% Pass | ||
| Collections | ||||
| Collections From Contributory Employers: | ||||
| Percentage Of Tax Due Paid Timely | 73.7% | 92.0% | ||
| Turnover Ratio - Ratio Of Receivables Liquidated Or Declared Uncollectible/Doubtful To Tax Due | 28.8% | 8.1% | ||
| Percentage of Tax Due Declared Uncollectible/Doubtful | 6.0% | 1.3% | ||
| Accounts Receivable As A Percentage Of Tax Due | 8.9% | 2.2% | ||
| Collections From Reimbursing Employers: | ||||
| Percentage Of Tax Due Paid Timely | 94.9% | 80.6% | ||
| Turnover Ratio - Ratio Of Receivables Liquidated Or Declared Uncollectible/Doubtful To Tax Due | 7.0% | 19.4% | ||
| Percentage of Tax Due Declared Uncollectible/Doubtful | 1.5% | 1.2% | ||
| Accounts Receivable As A Percentage Of Tax Due | 1.6% | 4.6% | ||
| Appropriate Actions Taken To Collect Tax Due? | F | 48.9% Pass | ||
| Cashiering | ||||
| Remittances Deposited Within Three Days? | P | 92.0% Pass | ||
| Field Audit | ||||
| Percent Change In Total Wages Resulting From Audits | 1.5% | 5.0% | ||
| Percentage Of Contributory Employers Audited | 1.5% | 2.0% | ||
| Annualized Percentage Of Total Wages Audited | 0.8% | 1.8% | ||
| Audits Meet Employment Security Manual Requirements? | F | 64.6% Pass | ||
| Account Maintenance | ||||
| Accuracy In Report Processing? | F | 96.0% Pass | ||
| Accuracy In Contributory Employer Billing? | F | 84.8% Pass | ||
| Accuracy In Reimbursing Employer Billings? | P | 85.7% Pass | ||
| Accuracy In Credits/Refunds? | F | 73.9% Pass | ||
| Accuracy In Benefit Charging? | P | 89.6% Pass | ||
| Accuracy In Experience Rating? | F | 87.8% Pass | ||
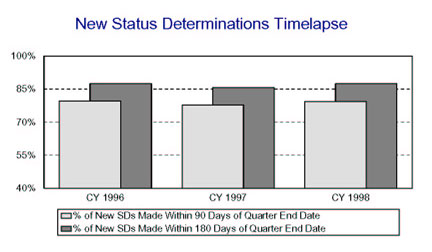
| Maine | ||||
| REPORTED MEASURE | WORKLOAD | STATE RESULTS |
NATIONAL RESULTS |
CRITERION |
|---|---|---|---|---|
| First Payment Timeliness | ||||
| Intrastate UI, full weeks - 14/21 Days | 30,222 | 86.8% | 90.1% | 87% |
| Intrastate UI, full weeks - 35 Days | 30,222 | 97.5% | 97.2% | 93% |
| Interstate UI, full weeks - 14/21 Days | 998 | 52.6% | 78.4% | 70% |
| Interstate UI, full weeks - 35 Days | 998 | 90.5% | 92.4% | 78% |
| All First Payments - 14/21 Days | 40,425 | 82.4% | 89.2% | 90% (Fiscal Year '02) |
| All First Payments - 35 Days | 40,425 | 96.9% | 97.0% | 95% (Fiscal Year '02) |
| Nonmonetary Determinations Timeliness: Detection Date to Determination Date |
||||
| Nonseparation Determ. within 14 Days | 38,402 | 41.3% | 68.6% | 80% (Fiscal Year '02) |
| Separation Determ. within 21 Days | 11,652 | 55.8% | 73.3% | 80% (Fiscal Year '02) |
| Nonmonetary Issue Detection Timeliness: First Week Affected to Detection Date |
||||
| Nonseparation Issues within 14 Days | 38,402 | 43.9% | 63.1% | none |
| Separation Issues within 21 Days | 11,652 | 74.8% | 90.7% | none |
| Lower Authority Appeals Timeliness | ||||
| Decisions within 30 Days of Filing | 6,641 | 69.5% | 67.9% | 60% |
| Decisions within 45 Days of Filing | 6,641 | 89.5% | 85.4% | 80% |
| Decisions within 90 Days of Filing | 6,641 | 98.7% | 95.5% | 95% (Fiscal Year '02) |
| Higher Authority Appeals Timeliness | ||||
| Decisions within 45 Days of Filing | 549 | 51.9% | 62.7% | 50% (Fiscal Year '00) |
| Decisions within 75 Days of Filing | 549 | 94.7% | 85.6% | 80% (Fiscal Year '00) |
| Decisions within 150 Days of Filing | 549 | 99.5% | 96.3% | 95% (Fiscal Year '00) |
| Combined Wage Program Timeliness | ||||
| Wage Transfers Made within 3 Days | 2,030 | 73.1% | 69.8% | none |
| Wage Transfers Made within 14 Days | 2,030 | 97.8% | 97.3% | none |
| Billing Made within 45 Days | 146 | 94.5% | 92.6% | none |
| Reimbursements Made within 45 Days | 181 | 94.5% | 96.4% | none |
| Continued Claims Payment Timeliness | ||||
| Payments Made within 7 Days | 610,356 | 78.3% | 61.4% | none |
| Payments Made within 14 Days | 610,356 | 92.8% | 92.5% | none |
| Payments Made within 21 Days | 610,356 | 96.8% | 96.3% | none |
| Benefit Quality Measures | ||||
| Nonmon. Determin. with Scores > 80% | 225 | 71.2% | 70.9% | 75% (Fiscal Year '02) |
| LA Appeals with Scores >= 85% | 61 | 98.4% | 90.5% | 80% (Fiscal Year '00) |
| Benefit Payment Control | ||||
| Fraud Overpayment Recovery Rate | 289,626 | 123.0% | 50.9% | none |
| Nonfraud Overpayment Recovery Rate | 1,242,724 | 81.3% | 56.1% | none |
| Maine | ||||
| REPORTED MEASURE | STATE RESULTS | NATIONAL RESULTS | CRITERION | |
|---|---|---|---|---|
| Cash Management | ||||
| Average time (days) funds are on deposit before being transferred to Trust Fund | 2.8 | 2.1 days | <= 2 (Fiscal Year '00) | |
| Ratio of avg daily loanable balance in Clearing Account to avg daily transfer to Tust Fund | 2.21 | 1.70 | <= 1.75 (Fiscal Year '02) | |
| Benefit Accuracy Measurement | ||||
| Total Dollars Paid in Population | $80,734,612 | $18.8 B | none | |
| Sample Size | 488 | 26,353 | none | |
| Proper Payment Rate | 77.9 +/- 4.2 | 91.5% | none | |
| Overpayment Rate | 22.1 +/- 4.2 | 8.5% | none | |
| Underpayment Rate | 0.6 +/- 0.6 | 0.9% | none | |
| Footnotes: | #5 | |||

| Maine | ||||
| REPORTED MEASURE | STATE RESULTS | NATIONAL RESULTS | ||
|---|---|---|---|---|
| Status Determinations | ||||
| New Employer Determinations: | ||||
| Percentage Made Within 90 Days (Fiscal Year '00 criterion: 60%) | 80.2% | 78.0% | ||
| Percentage Made Within 180 Days (Fiscal Year '00 criterion: 80%) | 89.2% | 89.7% | ||
| Accuracy In Determinations? (Fiscal Year '02 criterion: <= 6 failed) | F | 45.8% Pass | ||
| Accuracy In Postings? | F | 39.6% Pass | ||
| Successor Determinations: | ||||
| Percentage Made Within 90 Days | 71.5% | 67.0% | ||
| Percentage Made Within 180 Days | 81.1% | 81.5% | ||
| Accuracy In Determinations? | F | 54.2% Pass | ||
| Accuracy In Postings? | F | 45.8% Pass | ||
| Inactivations: | ||||
| Accuracy In Determinations? | F | 64.4% Pass | ||
| Accuracy In Postings? | F | 64.6% Pass | ||
| Report Delinquency | ||||
| Reports From Contributory Employers: | ||||
| Percentage Filed Timely | 66.3% | 87.4% | ||
| Percentage Secured | 89.7% | 92.5% | ||
| Percentage Resolved | 96.0% | 97.1% | ||
| Reports From Reimbursing Employers: | ||||
| Percentage Filed Timely | 72.2% | 79.8% | ||
| Percentage Secured | 90.3% | 85.9% | ||
| Percentage Resolved | 98.9% | 87.5% | ||
| Appropriate Actions Taken To Resolve Delinquencies? | F | 76.6% Pass | ||
| Collections | ||||
| Collections From Contributory Employers: | ||||
| Percentage Of Tax Due Paid Timely | 109.8% | 92.0% | ||
| Turnover Ratio - Ratio Of Receivables Liquidated Or Declared Uncollectible/Doubtful To Tax Due | 110.2% | 8.1% | ||
| Percentage of Tax Due Declared Uncollectible/Doubtful | 2.2% | 1.3% | ||
| Accounts Receivable As A Percentage Of Tax Due | 2.5% | 2.2% | ||
| Collections From Reimbursing Employers: | ||||
| Percentage Of Tax Due Paid Timely | 74.5% | 80.6% | ||
| Turnover Ratio - Ratio Of Receivables Liquidated Or Declared Uncollectible/Doubtful To Tax Due | 25.9% | 19.4% | ||
| Percentage of Tax Due Declared Uncollectible/Doubtful | 0.7% | 1.2% | ||
| Accounts Receivable As A Percentage Of Tax Due | 1.0% | 4.6% | ||
| Appropriate Actions Taken To Collect Tax Due? | F | 48.9% Pass | ||
| Cashiering | ||||
| Remittances Deposited Within Three Days? | P | 92.0% Pass | ||
| Field Audit | ||||
| Percent Change In Total Wages Resulting From Audits | 1.3% | 5.0% | ||
| Percentage Of Contributory Employers Audited | 2.2% | 2.0% | ||
| Annualized Percentage Of Total Wages Audited | 1.3% | 1.8% | ||
| Audits Meet Employment Security Manual Requirements? | F | 64.6% Pass | ||
| Account Maintenance | ||||
| Accuracy In Report Processing? | P | 96.0% Pass | ||
| Accuracy In Contributory Employer Billing? | F | 84.8% Pass | ||
| Accuracy In Reimbursing Employer Billings? | F | 85.7% Pass | ||
| Accuracy In Credits/Refunds? | F | 73.9% Pass | ||
| Accuracy In Benefit Charging? | P | 89.6% Pass | ||
| Accuracy In Experience Rating? | F | 87.8% Pass | ||

| Maryland | ||||
| REPORTED MEASURE | WORKLOAD | STATE RESULTS |
NATIONAL RESULTS |
CRITERION |
|---|---|---|---|---|
| First Payment Timeliness | ||||
| Intrastate UI, full weeks - 14/21 Days | 88,163 | 90.9% | 90.1% | 87% |
| Intrastate UI, full weeks - 35 Days | 88,163 | 95.2% | 97.2% | 93% |
| Interstate UI, full weeks - 14/21 Days | 5,091 | 74.5% | 78.4% | 70% |
| Interstate UI, full weeks - 35 Days | 5,091 | 87.6% | 92.4% | 78% |
| All First Payments - 14/21 Days | 100,001 | 90.1% | 89.2% | 90% (Fiscal Year '02) |
| All First Payments - 35 Days | 100,001 | 94.9% | 97.0% | 95% (Fiscal Year '02) |
| Nonmonetary Determinations Timeliness: Detection Date to Determination Date |
||||
| Nonseparation Determ. within 14 Days | 62,690 | 87.0% | 68.6% | 80% (Fiscal Year '02) |
| Separation Determ. within 21 Days | 80,977 | 88.4% | 73.3% | 80% (Fiscal Year '02) |
| Nonmonetary Issue Detection Timeliness: First Week Affected to Detection Date |
||||
| Nonseparation Issues within 14 Days | 62,738 | 66.1% | 63.1% | none |
| Separation Issues within 21 Days | 81,196 | 88.0% | 90.7% | none |
| Lower Authority Appeals Timeliness | ||||
| Decisions within 30 Days of Filing | 22,493 | 86.1% | 67.9% | 60% |
| Decisions within 45 Days of Filing | 22,493 | 95.7% | 85.4% | 80% |
| Decisions within 90 Days of Filing | 22,493 | 99.5% | 95.5% | 95% (Fiscal Year '02) |
| Higher Authority Appeals Timeliness | ||||
| Decisions within 45 Days of Filing | 3,855 | 47.9% | 62.7% | 50% (Fiscal Year '00) |
| Decisions within 75 Days of Filing | 3,855 | 83.4% | 85.6% | 80% (Fiscal Year '00) |
| Decisions within 150 Days of Filing | 3,855 | 93.8% | 96.3% | 95% (Fiscal Year '00) |
| Combined Wage Program Timeliness | ||||
| Wage Transfers Made within 3 Days | 14,587 | 78.7% | 69.8% | none |
| Wage Transfers Made within 14 Days | 14,587 | 94.5% | 97.3% | none |
| Billing Made within 45 Days | 181 | 100.0% | 92.6% | none |
| Reimbursements Made within 45 Days | 188 | 91.0% | 96.4% | none |
| Continued Claims Payment Timeliness | ||||
| Payments Made within 7 Days | 1,572,459 | 44.2% | 61.4% | none |
| Payments Made within 14 Days | 1,572,459 | 92.1% | 92.5% | none |
| Payments Made within 21 Days | 1,572,459 | 96.4% | 96.3% | none |
| Benefit Quality Measures | ||||
| Nonmon. Determin. with Scores > 80% | 389 | 76.9% | 70.9% | 75% (Fiscal Year '02) |
| LA Appeals with Scores >= 85% | 71 | 95.8% | 90.5% | 80% (Fiscal Year '00) |
| Benefit Payment Control | ||||
| Fraud Overpayment Recovery Rate | 3,093,460 | 38.1% | 50.9% | none |
| Nonfraud Overpayment Recovery Rate | 7,693,258 | 58.2% | 56.1% | none |
| Maryland | ||||
| REPORTED MEASURE | STATE RESULTS | NATIONAL RESULTS | CRITERION | |
|---|---|---|---|---|
| Cash Management | ||||
| Average time (days) funds are on deposit before being transferred to Trust Fund | 1.2 | 2.1 days | <= 2 (Fiscal Year '00) | |
| Ratio of avg daily loanable balance in Clearing Account to avg daily transfer to Tust Fund | 0.09 | 1.70 | <= 1.75 (Fiscal Year '02) | |
| Benefit Accuracy Measurement | ||||
| Total Dollars Paid in Population | $287,364,595 | $18.8 B | none | |
| Sample Size | 485 | 26,353 | none | |
| Proper Payment Rate | 77.3 +/- 3.8 | 91.5% | none | |
| Overpayment Rate | 22.7 +/- 3.8 | 8.5% | none | |
| Underpayment Rate | 0.4 +/- 0.2 | 0.9% | none | |
| Footnotes: | none | |||
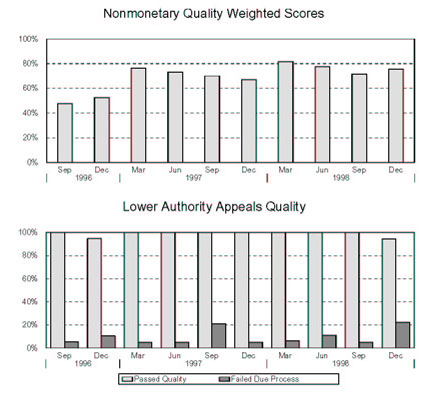
| Maryland | ||||
| REPORTED MEASURE | STATE RESULTS | NATIONAL RESULTS | ||
|---|---|---|---|---|
| Status Determinations | ||||
| New Employer Determinations: | ||||
| Percentage Made Within 90 Days (Fiscal Year '00 criterion: 60%) | 83.6% | 78.0% | ||
| Percentage Made Within 180 Days (Fiscal Year '00 criterion: 80%) | 89.4% | 89.7% | ||
| Accuracy In Determinations? (Fiscal Year '02 criterion: <= 6 failed) | P | 45.8% Pass | ||
| Accuracy In Postings? | P | 39.6% Pass | ||
| Successor Determinations: | ||||
| Percentage Made Within 90 Days | 86.2% | 67.0% | ||
| Percentage Made Within 180 Days | 92.5% | 81.5% | ||
| Accuracy In Determinations? | P | 54.2% Pass | ||
| Accuracy In Postings? | F | 45.8% Pass | ||
| Inactivations: | ||||
| Accuracy In Determinations? | P | 64.4% Pass | ||
| Accuracy In Postings? | P | 64.6% Pass | ||
| Report Delinquency | ||||
| Reports From Contributory Employers: | ||||
| Percentage Filed Timely | 82.8% | 87.4% | ||
| Percentage Secured | 92.1% | 92.5% | ||
| Percentage Resolved | 99.3% | 97.1% | ||
| Reports From Reimbursing Employers: | ||||
| Percentage Filed Timely | 77.9% | 79.8% | ||
| Percentage Secured | 98.2% | 85.9% | ||
| Percentage Resolved | 99.5% | 87.5% | ||
| Appropriate Actions Taken To Resolve Delinquencies? | F | 76.6% Pass | ||
| Collections | ||||
| Collections From Contributory Employers: | ||||
| Percentage Of Tax Due Paid Timely | 85.5% | 92.0% | ||
| Turnover Ratio - Ratio Of Receivables Liquidated Or Declared Uncollectible/Doubtful To Tax Due | 14.3% | 8.1% | ||
| Percentage of Tax Due Declared Uncollectible/Doubtful | 1.6% | 1.3% | ||
| Accounts Receivable As A Percentage Of Tax Due | 4.6% | 2.2% | ||
| Collections From Reimbursing Employers: | ||||
| Percentage Of Tax Due Paid Timely | 77.0% | 80.6% | ||
| Turnover Ratio - Ratio Of Receivables Liquidated Or Declared Uncollectible/Doubtful To Tax Due | 22.0% | 19.4% | ||
| Percentage of Tax Due Declared Uncollectible/Doubtful | 0.0% | 1.2% | ||
| Accounts Receivable As A Percentage Of Tax Due | 1.5% | 4.6% | ||
| Appropriate Actions Taken To Collect Tax Due? | F | 48.9% Pass | ||
| Cashiering | ||||
| Remittances Deposited Within Three Days? | F | 92.0% Pass | ||
| Field Audit | ||||
| Percent Change In Total Wages Resulting From Audits | 2.8% | 5.0% | ||
| Percentage Of Contributory Employers Audited | 2.2% | 2.0% | ||
| Annualized Percentage Of Total Wages Audited | 1.7% | 1.8% | ||
| Audits Meet Employment Security Manual Requirements? | F | 64.6% Pass | ||
| Account Maintenance | ||||
| Accuracy In Report Processing? | P | 96.0% Pass | ||
| Accuracy In Contributory Employer Billing? | F | 84.8% Pass | ||
| Accuracy In Reimbursing Employer Billings? | P | 85.7% Pass | ||
| Accuracy In Credits/Refunds? | P | 73.9% Pass | ||
| Accuracy In Benefit Charging? | P | 89.6% Pass | ||
| Accuracy In Experience Rating? | P | 87.8% Pass | ||
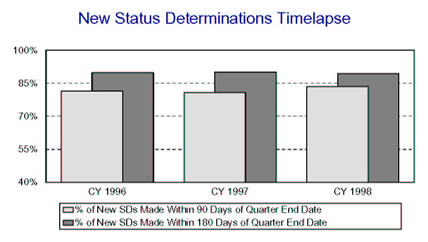
| Massachusetts | ||||
| REPORTED MEASURE | WORKLOAD | STATE RESULTS |
NATIONAL RESULTS |
CRITERION |
|---|---|---|---|---|
| First Payment Timeliness | ||||
| Intrastate UI, full weeks - 14/21 Days | 152,641 | 89.5% | 90.1% | 87% |
| Intrastate UI, full weeks - 35 Days | 152,641 | 96.9% | 97.2% | 93% |
| Interstate UI, full weeks - 14/21 Days | 4,498 | 78.3% | 78.4% | 70% |
| Interstate UI, full weeks - 35 Days | 4,498 | 92.3% | 92.4% | 78% |
| All First Payments - 14/21 Days | 173,333 | 88.6% | 89.2% | 90% (Fiscal Year '02) |
| All First Payments - 35 Days | 173,333 | 96.7% | 97.0% | 95% (Fiscal Year '02) |
| Nonmonetary Determinations Timeliness: Detection Date to Determination Date |
||||
| Nonseparation Determ. within 14 Days | 101,544 | 49.4% | 68.6% | 80% (Fiscal Year '02) |
| Separation Determ. within 21 Days | 64,630 | 58.5% | 73.3% | 80% (Fiscal Year '02) |
| Nonmonetary Issue Detection Timeliness: First Week Affected to Detection Date |
||||
| Nonseparation Issues within 14 Days | 101,544 | 68.8% | 63.1% | none |
| Separation Issues within 21 Days | 64,630 | 94.3% | 90.7% | none |
| Lower Authority Appeals Timeliness | ||||
| Decisions within 30 Days of Filing | 19,441 | 81.5% | 67.9% | 60% |
| Decisions within 45 Days of Filing | 19,441 | 94.6% | 85.4% | 80% |
| Decisions within 90 Days of Filing | 19,441 | 99.2% | 95.5% | 95% (Fiscal Year '02) |
| Higher Authority Appeals Timeliness | ||||
| Decisions within 45 Days of Filing | 3,071 | 89.6% | 62.7% | 50% (Fiscal Year '00) |
| Decisions within 75 Days of Filing | 3,071 | 94.2% | 85.6% | 80% (Fiscal Year '00) |
| Decisions within 150 Days of Filing | 3,071 | 98.2% | 96.3% | 95% (Fiscal Year '00) |
| Combined Wage Program Timeliness | ||||
| Wage Transfers Made within 3 Days | 8,097 | 78.5% | 69.8% | none |
| Wage Transfers Made within 14 Days | 8,097 | 93.3% | 97.3% | none |
| Billing Made within 45 Days | 208 | 100.0% | 92.6% | none |
| Reimbursements Made within 45 Days | 200 | 100.0% | 96.4% | none |
| Continued Claims Payment Timeliness | ||||
| Payments Made within 7 Days | 2,836,430 | 43.6% | 61.4% | none |
| Payments Made within 14 Days | 2,836,430 | 91.1% | 92.5% | none |
| Payments Made within 21 Days | 2,836,430 | 95.9% | 96.3% | none |
| Benefit Quality Measures | ||||
| Nonmon. Determin. with Scores > 80% | 394 | 80.8% | 70.9% | 75% (Fiscal Year '02) |
| LA Appeals with Scores >= 85% | 75 | 96.0% | 90.5% | 80% (Fiscal Year '00) |
| Benefit Payment Control | ||||
| Fraud Overpayment Recovery Rate | 5,579,459 | 73.5% | 50.9% | none |
| Nonfraud Overpayment Recovery Rate | 3,722,545 | 66.3% | 56.1% | none |
| Massachusetts | ||||
| REPORTED MEASURE | STATE RESULTS | NATIONAL RESULTS | CRITERION | |
|---|---|---|---|---|
| Cash Management | ||||
| Average time (days) funds are on deposit before being transferred to Trust Fund | 1.4 | 2.1 days | <= 2 (Fiscal Year '00) | |
| Ratio of avg daily loanable balance in Clearing Account to avg daily transfer to Tust Fund | 0.09 | 1.70 | <= 1.75 (Fiscal Year '02) | |
| Benefit Accuracy Measurement | ||||
| Total Dollars Paid in Population | $720,327,922 | $18.8 B | none | |
| Sample Size | 579 | 26,353 | none | |
| Proper Payment Rate | 95.7 +/- 1.6 | 91.5% | none | |
| Overpayment Rate | 4.3 +/- 1.6 | 8.5% | none | |
| Underpayment Rate | 1.6 +/- 0.7 | 0.9% | none | |
| Footnotes: | none | |||
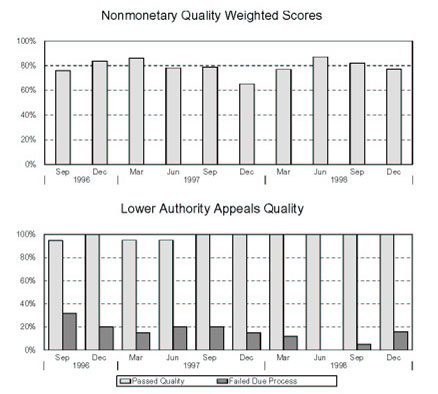
| Massachusetts | ||||
| REPORTED MEASURE | STATE RESULTS | NATIONAL RESULTS | ||
|---|---|---|---|---|
| Status Determinations | ||||
| New Employer Determinations: | ||||
| Percentage Made Within 90 Days (Fiscal Year '00 criterion: 60%) | 74.3% | 78.0% | ||
| Percentage Made Within 180 Days (Fiscal Year '00 criterion: 80%) | 88.8% | 89.7% | ||
| Accuracy In Determinations? (Fiscal Year '02 criterion: <= 6 failed) | P | 45.8% Pass | ||
| Accuracy In Postings? | P | 39.6% Pass | ||
| Successor Determinations: | ||||
| Percentage Made Within 90 Days | 74.2% | 67.0% | ||
| Percentage Made Within 180 Days | 87.0% | 81.5% | ||
| Accuracy In Determinations? | P | 54.2% Pass | ||
| Accuracy In Postings? | P | 45.8% Pass | ||
| Inactivations: | ||||
| Accuracy In Determinations? | P | 64.4% Pass | ||
| Accuracy In Postings? | P | 64.6% Pass | ||
| Report Delinquency | ||||
| Reports From Contributory Employers: | ||||
| Percentage Filed Timely | 89.6% | 87.4% | ||
| Percentage Secured | 96.8% | 92.5% | ||
| Percentage Resolved | 100.0% | 97.1% | ||
| Reports From Reimbursing Employers: | ||||
| Percentage Filed Timely | 0.0% | 79.8% | ||
| Percentage Secured | 0.0% | 85.9% | ||
| Percentage Resolved | 0.0% | 87.5% | ||
| Appropriate Actions Taken To Resolve Delinquencies? | F | 76.6% Pass | ||
| Collections | ||||
| Collections From Contributory Employers: | ||||
| Percentage Of Tax Due Paid Timely | 97.3% | 92.0% | ||
| Turnover Ratio - Ratio Of Receivables Liquidated Or Declared Uncollectible/Doubtful To Tax Due | 3.1% | 8.1% | ||
| Percentage of Tax Due Declared Uncollectible/Doubtful | 0.3% | 1.3% | ||
| Accounts Receivable As A Percentage Of Tax Due | 1.0% | 2.2% | ||
| Collections From Reimbursing Employers: | ||||
| Percentage Of Tax Due Paid Timely | 80.7% | 80.6% | ||
| Turnover Ratio - Ratio Of Receivables Liquidated Or Declared Uncollectible/Doubtful To Tax Due | 27.3% | 19.4% | ||
| Percentage of Tax Due Declared Uncollectible/Doubtful | 9.2% | 1.2% | ||
| Accounts Receivable As A Percentage Of Tax Due | 2.1% | 4.6% | ||
| Appropriate Actions Taken To Collect Tax Due? | F | 48.9% Pass | ||
| Cashiering | ||||
| Remittances Deposited Within Three Days? | P | 92.0% Pass | ||
| Field Audit | ||||
| Percent Change In Total Wages Resulting From Audits | 2.3% | 5.0% | ||
| Percentage Of Contributory Employers Audited | 2.2% | 2.0% | ||
| Annualized Percentage Of Total Wages Audited | 1.7% | 1.8% | ||
| Audits Meet Employment Security Manual Requirements? | P | 64.6% Pass | ||
| Account Maintenance | ||||
| Accuracy In Report Processing? | P | 96.0% Pass | ||
| Accuracy In Contributory Employer Billing? | P | 84.8% Pass | ||
| Accuracy In Reimbursing Employer Billings? | P | 85.7% Pass | ||
| Accuracy In Credits/Refunds? | P | 73.9% Pass | ||
| Accuracy In Benefit Charging? | P | 89.6% Pass | ||
| Accuracy In Experience Rating? | P | 87.8% Pass | ||

| Michigan | ||||
| REPORTED MEASURE | WORKLOAD | STATE RESULTS |
NATIONAL RESULTS |
CRITERION |
|---|---|---|---|---|
| First Payment Timeliness | ||||
| Intrastate UI, full weeks - 14/21 Days | 357,122 | 85.9% | 90.1% | 87% |
| Intrastate UI, full weeks - 35 Days | 357,122 | 97.5% | 97.2% | 93% |
| Interstate UI, full weeks - 14/21 Days | 5,170 | 38.2% | 78.4% | 70% |
| Interstate UI, full weeks - 35 Days | 5,170 | 74.3% | 92.4% | 78% |
| All First Payments - 14/21 Days | 411,276 | 85.1% | 89.2% | 90% (Fiscal Year '02) |
| All First Payments - 35 Days | 411,276 | 97.0% | 97.0% | 95% (Fiscal Year '02) |
| Nonmonetary Determinations Timeliness: Detection Date to Determination Date |
||||
| Nonseparation Determ. within 14 Days | 111,048 | 55.9% | 68.6% | 80% (Fiscal Year '02) |
| Separation Determ. within 21 Days | 121,772 | 41.3% | 73.3% | 80% (Fiscal Year '02) |
| Nonmonetary Issue Detection Timeliness: First Week Affected to Detection Date |
||||
| Nonseparation Issues within 14 Days | 111,048 | 34.4% | 63.1% | none |
| Separation Issues within 21 Days | 121,772 | 78.1% | 90.7% | none |
| Lower Authority Appeals Timeliness | ||||
| Decisions within 30 Days of Filing | 14,567 | 78.8% | 67.9% | 60% |
| Decisions within 45 Days of Filing | 14,567 | 91.4% | 85.4% | 80% |
| Decisions within 90 Days of Filing | 14,567 | 97.2% | 95.5% | 95% (Fiscal Year '02) |
| Higher Authority Appeals Timeliness | ||||
| Decisions within 45 Days of Filing | 5,028 | 29.2% | 62.7% | 50% (Fiscal Year '00) |
| Decisions within 75 Days of Filing | 5,028 | 60.1% | 85.6% | 80% (Fiscal Year '00) |
| Decisions within 150 Days of Filing | 5,028 | 77.9% | 96.3% | 95% (Fiscal Year '00) |
| Combined Wage Program Timeliness | ||||
| Wage Transfers Made within 3 Days | 8,742 | 0.1% | 69.8% | none |
| Wage Transfers Made within 14 Days | 8,742 | 99.6% | 97.3% | none |
| Billing Made within 45 Days | 0 | 0.0% | 92.6% | none |
| Reimbursements Made within 45 Days | 201 | 100.0% | 96.4% | none |
| Continued Claims Payment Timeliness | ||||
| Payments Made within 7 Days | 2,218,209 | 82.7% | 61.4% | none |
| Payments Made within 14 Days | 2,218,209 | 95.5% | 92.5% | none |
| Payments Made within 21 Days | 2,218,209 | 96.7% | 96.3% | none |
| Benefit Quality Measures | ||||
| Nonmon. Determin. with Scores > 80% | 377 | 83.5% | 70.9% | 75% (Fiscal Year '02) |
| LA Appeals with Scores >= 85% | 76 | 88.8% | 90.5% | 80% (Fiscal Year '00) |
| Benefit Payment Control | ||||
| Fraud Overpayment Recovery Rate | 9,421,371 | 18.1% | 50.9% | none |
| Nonfraud Overpayment Recovery Rate | 15,755,592 | 39.3% | 56.1% | none |
| Michigan | ||||
| REPORTED MEASURE | STATE RESULTS | NATIONAL RESULTS | CRITERION | |
|---|---|---|---|---|
| Cash Management | ||||
| Average time (days) funds are on deposit before being transferred to Trust Fund | 7.0 | 2.1 days | <= 2 (Fiscal Year '00) | |
| Ratio of avg daily loanable balance in Clearing Account to avg daily transfer to Tust Fund | 8.27 | 1.70 | <= 1.75 (Fiscal Year '02) | |
| Benefit Accuracy Measurement | ||||
| Total Dollars Paid in Population | $924,304,867 | $18.8 B | none | |
| Sample Size | 480 | 26,353 | none | |
| Proper Payment Rate | 86.7 +/- 3.2 | 91.5% | none | |
| Overpayment Rate | 13.3 +/- 3.2 | 8.5% | none | |
| Underpayment Rate | 2 +/- 0.6 | 0.9% | none | |
| Footnotes: | none | |||
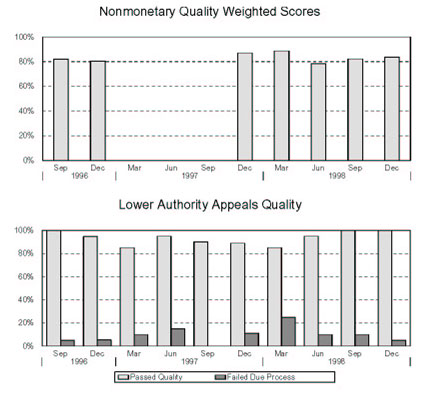
| Michigan | ||||
| REPORTED MEASURE | STATE RESULTS | NATIONAL RESULTS | ||
|---|---|---|---|---|
| Status Determinations | ||||
| New Employer Determinations: | ||||
| Percentage Made Within 90 Days (Fiscal Year '00 criterion: 60%) | 78.6% | 78.0% | ||
| Percentage Made Within 180 Days (Fiscal Year '00 criterion: 80%) | 88.9% | 89.7% | ||
| Accuracy In Determinations? (Fiscal Year '02 criterion: <= 6 failed) | P | 45.8% Pass | ||
| Accuracy In Postings? | F | 39.6% Pass | ||
| Successor Determinations: | ||||
| Percentage Made Within 90 Days | 59.0% | 67.0% | ||
| Percentage Made Within 180 Days | 76.2% | 81.5% | ||
| Accuracy In Determinations? | F | 54.2% Pass | ||
| Accuracy In Postings? | F | 45.8% Pass | ||
| Inactivations: | ||||
| Accuracy In Determinations? | P | 64.4% Pass | ||
| Accuracy In Postings? | F | 64.6% Pass | ||
| Report Delinquency | ||||
| Reports From Contributory Employers: | ||||
| Percentage Filed Timely | 80.9% | 87.4% | ||
| Percentage Secured | 90.0% | 92.5% | ||
| Percentage Resolved | 90.7% | 97.1% | ||
| Reports From Reimbursing Employers: | ||||
| Percentage Filed Timely | 0.0% | 79.8% | ||
| Percentage Secured | 0.0% | 85.9% | ||
| Percentage Resolved | 0.0% | 87.5% | ||
| Appropriate Actions Taken To Resolve Delinquencies? | F | 76.6% Pass | ||
| Collections | ||||
| Collections From Contributory Employers: | ||||
| Percentage Of Tax Due Paid Timely | 91.5% | 92.0% | ||
| Turnover Ratio - Ratio Of Receivables Liquidated Or Declared Uncollectible/Doubtful To Tax Due | 9.3% | 8.1% | ||
| Percentage of Tax Due Declared Uncollectible/Doubtful | 1.2% | 1.3% | ||
| Accounts Receivable As A Percentage Of Tax Due | 1.9% | 2.2% | ||
| Collections From Reimbursing Employers: | ||||
| Percentage Of Tax Due Paid Timely | 73.7% | 80.6% | ||
| Turnover Ratio - Ratio Of Receivables Liquidated Or Declared Uncollectible/Doubtful To Tax Due | 27.3% | 19.4% | ||
| Percentage of Tax Due Declared Uncollectible/Doubtful | 0.8% | 1.2% | ||
| Accounts Receivable As A Percentage Of Tax Due | 5.3% | 4.6% | ||
| Appropriate Actions Taken To Collect Tax Due? | P | 48.9% Pass | ||
| Cashiering | ||||
| Remittances Deposited Within Three Days? | P | 92.0% Pass | ||
| Field Audit | ||||
| Percent Change In Total Wages Resulting From Audits | 1.4% | 5.0% | ||
| Percentage Of Contributory Employers Audited | 1.5% | 2.0% | ||
| Annualized Percentage Of Total Wages Audited | 2.9% | 1.8% | ||
| Audits Meet Employment Security Manual Requirements? | F | 64.6% Pass | ||
| Account Maintenance | ||||
| Accuracy In Report Processing? | F | 96.0% Pass | ||
| Accuracy In Contributory Employer Billing? | ** | 84.8% Pass | ||
| Accuracy In Reimbursing Employer Billings? | P | 85.7% Pass | ||
| Accuracy In Credits/Refunds? | P | 73.9% Pass | ||
| Accuracy In Benefit Charging? | P | 89.6% Pass | ||
| Accuracy In Experience Rating? | P | 87.8% Pass | ||
** State had a problem in establishing the sample universe.
| Minnesota | ||||
| REPORTED MEASURE | WORKLOAD | STATE RESULTS |
NATIONAL RESULTS |
CRITERION |
|---|---|---|---|---|
| First Payment Timeliness | ||||
| Intrastate UI, full weeks - 14/21 Days | 95,177 | 89.7% | 90.1% | 87% |
| Intrastate UI, full weeks - 35 Days | 95,177 | 98.5% | 97.2% | 93% |
| Interstate UI, full weeks - 14/21 Days | 4,175 | 79.7% | 78.4% | 70% |
| Interstate UI, full weeks - 35 Days | 4,175 | 96.2% | 92.4% | 78% |
| All First Payments - 14/21 Days | 108,601 | 89.1% | 89.2% | 90% (Fiscal Year '02) |
| All First Payments - 35 Days | 108,601 | 98.4% | 97.0% | 95% (Fiscal Year '02) |
| Nonmonetary Determinations Timeliness: Detection Date to Determination Date |
||||
| Nonseparation Determ. within 14 Days | 34,011 | 82.8% | 68.6% | 80% (Fiscal Year '02) |
| Separation Determ. within 21 Days | 31,786 | 81.3% | 73.3% | 80% (Fiscal Year '02) |
| Nonmonetary Issue Detection Timeliness: First Week Affected to Detection Date |
||||
| Nonseparation Issues within 14 Days | 34,011 | 75.9% | 63.1% | none |
| Separation Issues within 21 Days | 31,786 | 59.7% | 90.7% | none |
| Lower Authority Appeals Timeliness | ||||
| Decisions within 30 Days of Filing | 9,202 | 74.7% | 67.9% | 60% |
| Decisions within 45 Days of Filing | 9,202 | 90.9% | 85.4% | 80% |
| Decisions within 90 Days of Filing | 9,202 | 98.2% | 95.5% | 95% (Fiscal Year '02) |
| Higher Authority Appeals Timeliness | ||||
| Decisions within 45 Days of Filing | 1,887 | 97.4% | 62.7% | 50% (Fiscal Year '00) |
| Decisions within 75 Days of Filing | 1,887 | 98.3% | 85.6% | 80% (Fiscal Year '00) |
| Decisions within 150 Days of Filing | 1,887 | 99.2% | 96.3% | 95% (Fiscal Year '00) |
| Combined Wage Program Timeliness | ||||
| Wage Transfers Made within 3 Days | 7,776 | 87.1% | 69.8% | none |
| Wage Transfers Made within 14 Days | 7,776 | 97.3% | 97.3% | none |
| Billing Made within 45 Days | 0 | 0.0% | 92.6% | none |
| Reimbursements Made within 45 Days | 0 | 0.0% | 96.4% | none |
| Continued Claims Payment Timeliness | ||||
| Payments Made within 7 Days | 1,354,106 | 45.2% | 61.4% | none |
| Payments Made within 14 Days | 1,354,106 | 94.4% | 92.5% | none |
| Payments Made within 21 Days | 1,354,106 | 98.0% | 96.3% | none |
| Benefit Quality Measures | ||||
| Nonmon. Determin. with Scores > 80% | 341 | 72.0% | 70.9% | 75% (Fiscal Year '02) |
| LA Appeals with Scores >= 85% | 84 | 100.0% | 90.5% | 80% (Fiscal Year '00) |
| Benefit Payment Control | ||||
| Fraud Overpayment Recovery Rate | 3,272,144 | 75.0% | 50.9% | none |
| Nonfraud Overpayment Recovery Rate | 4,567,791 | 95.8% | 56.1% | none |
| Minnesota | ||||
| REPORTED MEASURE | STATE RESULTS | NATIONAL RESULTS | CRITERION | |
|---|---|---|---|---|
| Cash Management | ||||
| Average time (days) funds are on deposit before being transferred to Trust Fund | 6.6 | 2.1 days | <= 2 (Fiscal Year '00) | |
| Ratio of avg daily loanable balance in Clearing Account to avg daily transfer to Tust Fund | 8.52 | 1.70 | <= 1.75 (Fiscal Year '02) | |
| Benefit Accuracy Measurement | ||||
| Total Dollars Paid in Population | $335,386,885 | $18.8 B | none | |
| Sample Size | 480 | 26,353 | none | |
| Proper Payment Rate | 90.9 +/- 2.7 | 91.5% | none | |
| Overpayment Rate | 9.1 +/- 2.7 | 8.5% | none | |
| Underpayment Rate | 0.3 +/- 0.2 | 0.9% | none | |
| Footnotes: | #1 | |||
| Minnesota | ||||
| REPORTED MEASURE | STATE RESULTS | NATIONAL RESULTS | ||
|---|---|---|---|---|
| Status Determinations | ||||
| New Employer Determinations: | ||||
| Percentage Made Within 90 Days (Fiscal Year '00 criterion: 60%) | 80.3% | 78.0% | ||
| Percentage Made Within 180 Days (Fiscal Year '00 criterion: 80%) | 86.9% | 89.7% | ||
| Accuracy In Determinations? (Fiscal Year '02 criterion: <= 6 failed) | F | 45.8% Pass | ||
| Accuracy In Postings? | F | 39.6% Pass | ||
| Successor Determinations: | ||||
| Percentage Made Within 90 Days | 76.2% | 67.0% | ||
| Percentage Made Within 180 Days | 91.6% | 81.5% | ||
| Accuracy In Determinations? | F | 54.2% Pass | ||
| Accuracy In Postings? | F | 45.8% Pass | ||
| Inactivations: | ||||
| Accuracy In Determinations? | P | 64.4% Pass | ||
| Accuracy In Postings? | P | 64.6% Pass | ||
| Report Delinquency | ||||
| Reports From Contributory Employers: | ||||
| Percentage Filed Timely | 89.3% | 87.4% | ||
| Percentage Secured | 95.1% | 92.5% | ||
| Percentage Resolved | 100.3% | 97.1% | ||
| Reports From Reimbursing Employers: | ||||
| Percentage Filed Timely | 58.3% | 79.8% | ||
| Percentage Secured | 93.2% | 85.9% | ||
| Percentage Resolved | 97.5% | 87.5% | ||
| Appropriate Actions Taken To Resolve Delinquencies? | P | 76.6% Pass | ||
| Collections | ||||
| Collections From Contributory Employers: | ||||
| Percentage Of Tax Due Paid Timely | 93.9% | 92.0% | ||
| Turnover Ratio - Ratio Of Receivables Liquidated Or Declared Uncollectible/Doubtful To Tax Due | 6.3% | 8.1% | ||
| Percentage of Tax Due Declared Uncollectible/Doubtful | 1.7% | 1.3% | ||
| Accounts Receivable As A Percentage Of Tax Due | 4.0% | 2.2% | ||
| Collections From Reimbursing Employers: | ||||
| Percentage Of Tax Due Paid Timely | 77.0% | 80.6% | ||
| Turnover Ratio - Ratio Of Receivables Liquidated Or Declared Uncollectible/Doubtful To Tax Due | 22.8% | 19.4% | ||
| Percentage of Tax Due Declared Uncollectible/Doubtful | 0.3% | 1.2% | ||
| Accounts Receivable As A Percentage Of Tax Due | 3.4% | 4.6% | ||
| Appropriate Actions Taken To Collect Tax Due? | F | 48.9% Pass | ||
| Cashiering | ||||
| Remittances Deposited Within Three Days? | P | 92.0% Pass | ||
| Field Audit | ||||
| Percent Change In Total Wages Resulting From Audits | 1.8% | 5.0% | ||
| Percentage Of Contributory Employers Audited | 2.2% | 2.0% | ||
| Annualized Percentage Of Total Wages Audited | 4.1% | 1.8% | ||
| Audits Meet Employment Security Manual Requirements? | P | 64.6% Pass | ||
| Account Maintenance | ||||
| Accuracy In Report Processing? | P | 96.0% Pass | ||
| Accuracy In Contributory Employer Billing? | P | 84.8% Pass | ||
| Accuracy In Reimbursing Employer Billings? | P | 85.7% Pass | ||
| Accuracy In Credits/Refunds? | P | 73.9% Pass | ||
| Accuracy In Benefit Charging? | P | 89.6% Pass | ||
| Accuracy In Experience Rating? | P | 87.8% Pass | ||
| Mississippi | ||||
| REPORTED MEASURE | WORKLOAD | STATE RESULTS |
NATIONAL RESULTS |
CRITERION |
|---|---|---|---|---|
| First Payment Timeliness | ||||
| Intrastate UI, full weeks - 14/21 Days | 49,980 | 94.8% | 90.1% | 87% |
| Intrastate UI, full weeks - 35 Days | 49,980 | 97.9% | 97.2% | 93% |
| Interstate UI, full weeks - 14/21 Days | 1,625 | 78.8% | 78.4% | 70% |
| Interstate UI, full weeks - 35 Days | 1,625 | 94.4% | 92.4% | 78% |
| All First Payments - 14/21 Days | 61,141 | 94.4% | 89.2% | 90% (Fiscal Year '02) |
| All First Payments - 35 Days | 61,141 | 98.0% | 97.0% | 95% (Fiscal Year '02) |
| Nonmonetary Determinations Timeliness: Detection Date to Determination Date |
||||
| Nonseparation Determ. within 14 Days | 30,341 | 76.0% | 68.6% | 80% (Fiscal Year '02) |
| Separation Determ. within 21 Days | 38,179 | 85.8% | 73.3% | 80% (Fiscal Year '02) |
| Nonmonetary Issue Detection Timeliness: First Week Affected to Detection Date |
||||
| Nonseparation Issues within 14 Days | 30,341 | 83.8% | 63.1% | none |
| Separation Issues within 21 Days | 38,179 | 97.1% | 90.7% | none |
| Lower Authority Appeals Timeliness | ||||
| Decisions within 30 Days of Filing | 11,549 | 84.2% | 67.9% | 60% |
| Decisions within 45 Days of Filing | 11,549 | 95.3% | 85.4% | 80% |
| Decisions within 90 Days of Filing | 11,549 | 100.0% | 95.5% | 95% (Fiscal Year '02) |
| Higher Authority Appeals Timeliness | ||||
| Decisions within 45 Days of Filing | 2,048 | 96.9% | 62.7% | 50% (Fiscal Year '00) |
| Decisions within 75 Days of Filing | 2,048 | 99.4% | 85.6% | 80% (Fiscal Year '00) |
| Decisions within 150 Days of Filing | 2,048 | 100.0% | 96.3% | 95% (Fiscal Year '00) |
| Combined Wage Program Timeliness | ||||
| Wage Transfers Made within 3 Days | 8,367 | 87.6% | 69.8% | none |
| Wage Transfers Made within 14 Days | 8,367 | 94.3% | 97.3% | none |
| Billing Made within 45 Days | 194 | 100.0% | 92.6% | none |
| Reimbursements Made within 45 Days | 184 | 100.0% | 96.4% | none |
| Continued Claims Payment Timeliness | ||||
| Payments Made within 7 Days | 716,417 | 94.0% | 61.4% | none |
| Payments Made within 14 Days | 716,417 | 98.1% | 92.5% | none |
| Payments Made within 21 Days | 716,417 | 99.0% | 96.3% | none |
| Benefit Quality Measures | ||||
| Nonmon. Determin. with Scores > 80% | 206 | 88.6% | 70.9% | 75% (Fiscal Year '02) |
| LA Appeals with Scores >= 85% | 84 | 100.0% | 90.5% | 80% (Fiscal Year '00) |
| Benefit Payment Control | ||||
| Fraud Overpayment Recovery Rate | 2,108,994 | 44.3% | 50.9% | none |
| Nonfraud Overpayment Recovery Rate | 1,406,726 | 40.9% | 56.1% | none |
| Mississippi | ||||
| REPORTED MEASURE | STATE RESULTS | NATIONAL RESULTS | CRITERION | |
|---|---|---|---|---|
| Cash Management | ||||
| Average time (days) funds are on deposit before being transferred to Trust Fund | 2.0 | 2.1 days | <= 2 (Fiscal Year '00) | |
| Ratio of avg daily loanable balance in Clearing Account to avg daily transfer to Tust Fund | 0.87 | 1.70 | <= 1.75 (Fiscal Year '02) | |
| Benefit Accuracy Measurement | ||||
| Total Dollars Paid in Population | $104,986,236 | $18.8 B | none | |
| Sample Size | 480 | 26,353 | none | |
| Proper Payment Rate | 91.3 +/- 2.6 | 91.5% | none | |
| Overpayment Rate | 8.7 +/- 2.6 | 8.5% | none | |
| Underpayment Rate | 0.3 +/- 0.2 | 0.9% | none | |
| Footnotes: | none | |||
| Mississippi | ||||
| REPORTED MEASURE | STATE RESULTS | NATIONAL RESULTS | ||
|---|---|---|---|---|
| Status Determinations | ||||
| New Employer Determinations: | ||||
| Percentage Made Within 90 Days (Fiscal Year '00 criterion: 60%) | 67.4% | 78.0% | ||
| Percentage Made Within 180 Days (Fiscal Year '00 criterion: 80%) | 80.2% | 89.7% | ||
| Accuracy In Determinations? (Fiscal Year '02 criterion: <= 6 failed) | P | 45.8% Pass | ||
| Accuracy In Postings? | P | 39.6% Pass | ||
| Successor Determinations: | ||||
| Percentage Made Within 90 Days | 83.1% | 67.0% | ||
| Percentage Made Within 180 Days | 91.8% | 81.5% | ||
| Accuracy In Determinations? | P | 54.2% Pass | ||
| Accuracy In Postings? | P | 45.8% Pass | ||
| Inactivations: | ||||
| Accuracy In Determinations? | P | 64.4% Pass | ||
| Accuracy In Postings? | P | 64.6% Pass | ||
| Report Delinquency | ||||
| Reports From Contributory Employers: | ||||
| Percentage Filed Timely | 88.8% | 87.4% | ||
| Percentage Secured | 94.7% | 92.5% | ||
| Percentage Resolved | 99.4% | 97.1% | ||
| Reports From Reimbursing Employers: | ||||
| Percentage Filed Timely | 88.9% | 79.8% | ||
| Percentage Secured | 97.3% | 85.9% | ||
| Percentage Resolved | 98.5% | 87.5% | ||
| Appropriate Actions Taken To Resolve Delinquencies? | P | 76.6% Pass | ||
| Collections | ||||
| Collections From Contributory Employers: | ||||
| Percentage Of Tax Due Paid Timely | 96.0% | 92.0% | ||
| Turnover Ratio - Ratio Of Receivables Liquidated Or Declared Uncollectible/Doubtful To Tax Due | 4.1% | 8.1% | ||
| Percentage of Tax Due Declared Uncollectible/Doubtful | 0.8% | 1.3% | ||
| Accounts Receivable As A Percentage Of Tax Due | 2.7% | 2.2% | ||
| Collections From Reimbursing Employers: | ||||
| Percentage Of Tax Due Paid Timely | 70.5% | 80.6% | ||
| Turnover Ratio - Ratio Of Receivables Liquidated Or Declared Uncollectible/Doubtful To Tax Due | 29.0% | 19.4% | ||
| Percentage of Tax Due Declared Uncollectible/Doubtful | 0.0% | 1.2% | ||
| Accounts Receivable As A Percentage Of Tax Due | 0.9% | 4.6% | ||
| Appropriate Actions Taken To Collect Tax Due? | F | 48.9% Pass | ||
| Cashiering | ||||
| Remittances Deposited Within Three Days? | P | 92.0% Pass | ||
| Field Audit | ||||
| Percent Change In Total Wages Resulting From Audits | 0.7% | 5.0% | ||
| Percentage Of Contributory Employers Audited | 1.9% | 2.0% | ||
| Annualized Percentage Of Total Wages Audited | 1.0% | 1.8% | ||
| Audits Meet Employment Security Manual Requirements? | P | 64.6% Pass | ||
| Account Maintenance | ||||
| Accuracy In Report Processing? | P | 96.0% Pass | ||
| Accuracy In Contributory Employer Billing? | P | 84.8% Pass | ||
| Accuracy In Reimbursing Employer Billings? | P | 85.7% Pass | ||
| Accuracy In Credits/Refunds? | P | 73.9% Pass | ||
| Accuracy In Benefit Charging? | P | 89.6% Pass | ||
| Accuracy In Experience Rating? | P | 87.8% Pass | ||
| Missouri | ||||
| REPORTED MEASURE | WORKLOAD | STATE RESULTS |
NATIONAL RESULTS |
CRITERION |
|---|---|---|---|---|
| First Payment Timeliness | ||||
| Intrastate UI, full weeks - 14/21 Days | 124,660 | 89.1% | 90.1% | 87% |
| Intrastate UI, full weeks - 35 Days | 124,660 | 97.6% | 97.2% | 93% |
| Interstate UI, full weeks - 14/21 Days | 2,867 | 80.9% | 78.4% | 70% |
| Interstate UI, full weeks - 35 Days | 2,867 | 94.7% | 92.4% | 78% |
| All First Payments - 14/21 Days | 144,578 | 88.7% | 89.2% | 90% (Fiscal Year '02) |
| All First Payments - 35 Days | 144,578 | 97.6% | 97.0% | 95% (Fiscal Year '02) |
| Nonmonetary Determinations Timeliness: Detection Date to Determination Date |
||||
| Nonseparation Determ. within 14 Days | 97,376 | 89.2% | 68.6% | 80% (Fiscal Year '02) |
| Separation Determ. within 21 Days | 106,546 | 70.9% | 73.3% | 80% (Fiscal Year '02) |
| Nonmonetary Issue Detection Timeliness: First Week Affected to Detection Date |
||||
| Nonseparation Issues within 14 Days | 97,376 | 91.9% | 63.1% | none |
| Separation Issues within 21 Days | 106,546 | 95.0% | 90.7% | none |
| Lower Authority Appeals Timeliness | ||||
| Decisions within 30 Days of Filing | 25,021 | 67.6% | 67.9% | 60% |
| Decisions within 45 Days of Filing | 25,021 | 91.5% | 85.4% | 80% |
| Decisions within 90 Days of Filing | 25,021 | 99.2% | 95.5% | 95% (Fiscal Year '02) |
| Higher Authority Appeals Timeliness | ||||
| Decisions within 45 Days of Filing | 2,580 | 35.2% | 62.7% | 50% (Fiscal Year '00) |
| Decisions within 75 Days of Filing | 2,580 | 91.5% | 85.6% | 80% (Fiscal Year '00) |
| Decisions within 150 Days of Filing | 2,580 | 98.7% | 96.3% | 95% (Fiscal Year '00) |
| Combined Wage Program Timeliness | ||||
| Wage Transfers Made within 3 Days | 16,074 | 87.5% | 69.8% | none |
| Wage Transfers Made within 14 Days | 16,074 | 99.2% | 97.3% | none |
| Billing Made within 45 Days | 196 | 100.0% | 92.6% | none |
| Reimbursements Made within 45 Days | 196 | 91.8% | 96.4% | none |
| Continued Claims Payment Timeliness | ||||
| Payments Made within 7 Days | 1,578,597 | 89.2% | 61.4% | none |
| Payments Made within 14 Days | 1,578,597 | 96.5% | 92.5% | none |
| Payments Made within 21 Days | 1,578,597 | 98.1% | 96.3% | none |
| Benefit Quality Measures | ||||
| Nonmon. Determin. with Scores > 80% | 397 | 74.8% | 70.9% | 75% (Fiscal Year '02) |
| LA Appeals with Scores >= 85% | 80 | 96.3% | 90.5% | 80% (Fiscal Year '00) |
| Benefit Payment Control | ||||
| Fraud Overpayment Recovery Rate | 6,205,987 | 44.4% | 50.9% | none |
| Nonfraud Overpayment Recovery Rate | 2,447,125 | 45.7% | 56.1% | none |
| Missouri | ||||
| REPORTED MEASURE | STATE RESULTS | NATIONAL RESULTS | CRITERION | |
|---|---|---|---|---|
| Cash Management | ||||
| Average time (days) funds are on deposit before being transferred to Trust Fund | 1.5 | 2.1 days | <= 2 (Fiscal Year '00) | |
| Ratio of avg daily loanable balance in Clearing Account to avg daily transfer to Tust Fund | 0.57 | 1.70 | <= 1.75 (Fiscal Year '02) | |
| Benefit Accuracy Measurement | ||||
| Total Dollars Paid in Population | $249,792,048 | $18.8 B | none | |
| Sample Size | 480 | 26,353 | none | |
| Proper Payment Rate | 94.1 +/- 2 | 91.5% | none | |
| Overpayment Rate | 5.9 +/- 2 | 8.5% | none | |
| Underpayment Rate | 0.3 +/- 0.2 | 0.9% | none | |
| Footnotes: | none | |||

| Missouri | ||||
| REPORTED MEASURE | STATE RESULTS | NATIONAL RESULTS | ||
|---|---|---|---|---|
| Status Determinations | ||||
| New Employer Determinations: | ||||
| Percentage Made Within 90 Days (Fiscal Year '00 criterion: 60%) | 70.0% | 78.0% | ||
| Percentage Made Within 180 Days (Fiscal Year '00 criterion: 80%) | 83.2% | 89.7% | ||
| Accuracy In Determinations? (Fiscal Year '02 criterion: <= 6 failed) | F | 45.8% Pass | ||
| Accuracy In Postings? | F | 39.6% Pass | ||
| Successor Determinations: | ||||
| Percentage Made Within 90 Days | 67.7% | 67.0% | ||
| Percentage Made Within 180 Days | 84.4% | 81.5% | ||
| Accuracy In Determinations? | F | 54.2% Pass | ||
| Accuracy In Postings? | F | 45.8% Pass | ||
| Inactivations: | ||||
| Accuracy In Determinations? | F | 64.4% Pass | ||
| Accuracy In Postings? | F | 64.6% Pass | ||
| Report Delinquency | ||||
| Reports From Contributory Employers: | ||||
| Percentage Filed Timely | 82.0% | 87.4% | ||
| Percentage Secured | 96.7% | 92.5% | ||
| Percentage Resolved | 103.2% | 97.1% | ||
| Reports From Reimbursing Employers: | ||||
| Percentage Filed Timely | 70.0% | 79.8% | ||
| Percentage Secured | 99.6% | 85.9% | ||
| Percentage Resolved | 101.4% | 87.5% | ||
| Appropriate Actions Taken To Resolve Delinquencies? | F | 76.6% Pass | ||
| Collections | ||||
| Collections From Contributory Employers: | ||||
| Percentage Of Tax Due Paid Timely | 95.9% | 92.0% | ||
| Turnover Ratio - Ratio Of Receivables Liquidated Or Declared Uncollectible/Doubtful To Tax Due | 4.1% | 8.1% | ||
| Percentage of Tax Due Declared Uncollectible/Doubtful | 1.2% | 1.3% | ||
| Accounts Receivable As A Percentage Of Tax Due | 2.3% | 2.2% | ||
| Collections From Reimbursing Employers: | ||||
| Percentage Of Tax Due Paid Timely | 57.0% | 80.6% | ||
| Turnover Ratio - Ratio Of Receivables Liquidated Or Declared Uncollectible/Doubtful To Tax Due | 42.9% | 19.4% | ||
| Percentage of Tax Due Declared Uncollectible/Doubtful | 0.3% | 1.2% | ||
| Accounts Receivable As A Percentage Of Tax Due | 5.2% | 4.6% | ||
| Appropriate Actions Taken To Collect Tax Due? | F | 48.9% Pass | ||
| Cashiering | ||||
| Remittances Deposited Within Three Days? | P | 92.0% Pass | ||
| Field Audit | ||||
| Percent Change In Total Wages Resulting From Audits | 1.3% | 5.0% | ||
| Percentage Of Contributory Employers Audited | 2.0% | 2.0% | ||
| Annualized Percentage Of Total Wages Audited | 1.4% | 1.8% | ||
| Audits Meet Employment Security Manual Requirements? | F | 64.6% Pass | ||
| Account Maintenance | ||||
| Accuracy In Report Processing? | P | 96.0% Pass | ||
| Accuracy In Contributory Employer Billing? | F | 84.8% Pass | ||
| Accuracy In Reimbursing Employer Billings? | P | 85.7% Pass | ||
| Accuracy In Credits/Refunds? | F | 73.9% Pass | ||
| Accuracy In Benefit Charging? | P | 89.6% Pass | ||
| Accuracy In Experience Rating? | P | 87.8% Pass | ||
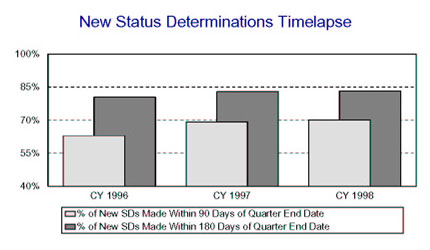
| Montana | ||||
| REPORTED MEASURE | WORKLOAD | STATE RESULTS |
NATIONAL RESULTS |
CRITERION |
|---|---|---|---|---|
| First Payment Timeliness | ||||
| Intrastate UI, full weeks - 14/21 Days | 20,171 | 89.1% | 90.1% | 87% |
| Intrastate UI, full weeks - 35 Days | 20,171 | 96.9% | 97.2% | 93% |
| Interstate UI, full weeks - 14/21 Days | 585 | 74.9% | 78.4% | 70% |
| Interstate UI, full weeks - 35 Days | 585 | 92.3% | 92.4% | 78% |
| All First Payments - 14/21 Days | 27,526 | 89.4% | 89.2% | 90% (Fiscal Year '02) |
| All First Payments - 35 Days | 27,526 | 97.0% | 97.0% | 95% (Fiscal Year '02) |
| Nonmonetary Determinations Timeliness: Detection Date to Determination Date |
||||
| Nonseparation Determ. within 14 Days | 9,370 | 57.3% | 68.6% | 80% (Fiscal Year '02) |
| Separation Determ. within 21 Days | 10,046 | 41.1% | 73.3% | 80% (Fiscal Year '02) |
| Nonmonetary Issue Detection Timeliness: First Week Affected to Detection Date |
||||
| Nonseparation Issues within 14 Days | 9,370 | 80.4% | 63.1% | none |
| Separation Issues within 21 Days | 10,046 | 95.5% | 90.7% | none |
| Lower Authority Appeals Timeliness | ||||
| Decisions within 30 Days of Filing | 1,071 | 78.1% | 67.9% | 60% |
| Decisions within 45 Days of Filing | 1,071 | 94.0% | 85.4% | 80% |
| Decisions within 90 Days of Filing | 1,071 | 99.4% | 95.5% | 95% (Fiscal Year '02) |
| Higher Authority Appeals Timeliness | ||||
| Decisions within 45 Days of Filing | 286 | 52.1% | 62.7% | 50% (Fiscal Year '00) |
| Decisions within 75 Days of Filing | 286 | 90.2% | 85.6% | 80% (Fiscal Year '00) |
| Decisions within 150 Days of Filing | 286 | 99.0% | 96.3% | 95% (Fiscal Year '00) |
| Combined Wage Program Timeliness | ||||
| Wage Transfers Made within 3 Days | 2,881 | 64.6% | 69.8% | none |
| Wage Transfers Made within 14 Days | 2,881 | 100.0% | 97.3% | none |
| Billing Made within 45 Days | 0 | 0.0% | 92.6% | none |
| Reimbursements Made within 45 Days | 0 | 0.0% | 96.4% | none |
| Continued Claims Payment Timeliness | ||||
| Payments Made within 7 Days | 325,539 | 45.6% | 61.4% | none |
| Payments Made within 14 Days | 325,539 | 95.1% | 92.5% | none |
| Payments Made within 21 Days | 325,539 | 98.0% | 96.3% | none |
| Benefit Quality Measures | ||||
| Nonmon. Determin. with Scores > 80% | 240 | 80.1% | 70.9% | 75% (Fiscal Year '02) |
| LA Appeals with Scores >= 85% | 75 | 92.2% | 90.5% | 80% (Fiscal Year '00) |
| Benefit Payment Control | ||||
| Fraud Overpayment Recovery Rate | 249,474 | 47.8% | 50.9% | none |
| Nonfraud Overpayment Recovery Rate | 522,032 | 78.2% | 56.1% | none |
| Montana | ||||
| REPORTED MEASURE | STATE RESULTS | NATIONAL RESULTS | CRITERION | |
|---|---|---|---|---|
| Cash Management | ||||
| Average time (days) funds are on deposit before being transferred to Trust Fund | 2.3 | 2.1 days | <= 2 (Fiscal Year '00) | |
| Ratio of avg daily loanable balance in Clearing Account to avg daily transfer to Tust Fund | 1.44 | 1.70 | <= 1.75 (Fiscal Year '02) | |
| Benefit Accuracy Measurement | ||||
| Total Dollars Paid in Population | $53,106,870 | $18.8 B | none | |
| Sample Size | 360 | 26,353 | none | |
| Proper Payment Rate | 83.2 +/- 4 | 91.5% | none | |
| Overpayment Rate | 16.8 +/- 4 | 8.5% | none | |
| Underpayment Rate | 1.3 +/- 0.7 | 0.9% | none | |
| Footnotes: | none | |||
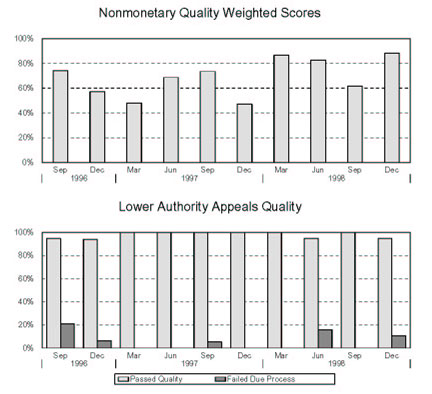
| Montana | ||||
| REPORTED MEASURE | STATE RESULTS | NATIONAL RESULTS | ||
|---|---|---|---|---|
| Status Determinations | ||||
| New Employer Determinations: | ||||
| Percentage Made Within 90 Days (Fiscal Year '00 criterion: 60%) | 88.6% | 78.0% | ||
| Percentage Made Within 180 Days (Fiscal Year '00 criterion: 80%) | 93.8% | 89.7% | ||
| Accuracy In Determinations? (Fiscal Year '02 criterion: <= 6 failed) | P | 45.8% Pass | ||
| Accuracy In Postings? | F | 39.6% Pass | ||
| Successor Determinations: | ||||
| Percentage Made Within 90 Days | 91.7% | 67.0% | ||
| Percentage Made Within 180 Days | 96.2% | 81.5% | ||
| Accuracy In Determinations? | P | 54.2% Pass | ||
| Accuracy In Postings? | F | 45.8% Pass | ||
| Inactivations: | ||||
| Accuracy In Determinations? | P | 64.4% Pass | ||
| Accuracy In Postings? | F | 64.6% Pass | ||
| Report Delinquency | ||||
| Reports From Contributory Employers: | ||||
| Percentage Filed Timely | 94.5% | 87.4% | ||
| Percentage Secured | 101.0% | 92.5% | ||
| Percentage Resolved | 102.0% | 97.1% | ||
| Reports From Reimbursing Employers: | ||||
| Percentage Filed Timely | 98.8% | 79.8% | ||
| Percentage Secured | 101.8% | 85.9% | ||
| Percentage Resolved | 102.9% | 87.5% | ||
| Appropriate Actions Taken To Resolve Delinquencies? | P | 76.6% Pass | ||
| Collections | ||||
| Collections From Contributory Employers: | ||||
| Percentage Of Tax Due Paid Timely | 94.7% | 92.0% | ||
| Turnover Ratio - Ratio Of Receivables Liquidated Or Declared Uncollectible/Doubtful To Tax Due | 5.2% | 8.1% | ||
| Percentage of Tax Due Declared Uncollectible/Doubtful | 0.4% | 1.3% | ||
| Accounts Receivable As A Percentage Of Tax Due | 1.1% | 2.2% | ||
| Collections From Reimbursing Employers: | ||||
| Percentage Of Tax Due Paid Timely | 97.1% | 80.6% | ||
| Turnover Ratio - Ratio Of Receivables Liquidated Or Declared Uncollectible/Doubtful To Tax Due | 3.2% | 19.4% | ||
| Percentage of Tax Due Declared Uncollectible/Doubtful | 0.0% | 1.2% | ||
| Accounts Receivable As A Percentage Of Tax Due | 0.0% | 4.6% | ||
| Appropriate Actions Taken To Collect Tax Due? | F | 48.9% Pass | ||
| Cashiering | ||||
| Remittances Deposited Within Three Days? | P | 92.0% Pass | ||
| Field Audit | ||||
| Percent Change In Total Wages Resulting From Audits | 4.0% | 5.0% | ||
| Percentage Of Contributory Employers Audited | 2.3% | 2.0% | ||
| Annualized Percentage Of Total Wages Audited | 1.3% | 1.8% | ||
| Audits Meet Employment Security Manual Requirements? | F | 64.6% Pass | ||
| Account Maintenance | ||||
| Accuracy In Report Processing? | P | 96.0% Pass | ||
| Accuracy In Contributory Employer Billing? | P | 84.8% Pass | ||
| Accuracy In Reimbursing Employer Billings? | ** | 85.7% Pass | ||
| Accuracy In Credits/Refunds? | P | 73.9% Pass | ||
| Accuracy In Benefit Charging? | P | 89.6% Pass | ||
| Accuracy In Experience Rating? | P | 87.8% Pass | ||
** State had a problem in establishing the sample universe.'
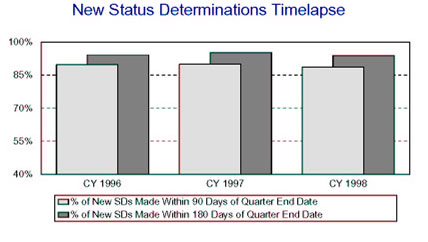
| Nebraska | ||||
| REPORTED MEASURE | WORKLOAD | STATE RESULTS |
NATIONAL RESULTS |
CRITERION |
|---|---|---|---|---|
| First Payment Timeliness | ||||
| Intrastate UI, full weeks - 14/21 Days | 24,676 | 97.1% | 90.1% | 87% |
| Intrastate UI, full weeks - 35 Days | 24,676 | 99.4% | 97.2% | 93% |
| Interstate UI, full weeks - 14/21 Days | 1,665 | 83.8% | 78.4% | 70% |
| Interstate UI, full weeks - 35 Days | 1,665 | 97.4% | 92.4% | 78% |
| All First Payments - 14/21 Days | 27,661 | 96.3% | 89.2% | 90% (Fiscal Year '02) |
| All First Payments - 35 Days | 27,661 | 99.2% | 97.0% | 95% (Fiscal Year '02) |
| Nonmonetary Determinations Timeliness: Detection Date to Determination Date |
||||
| Nonseparation Determ. within 14 Days | 18,365 | 81.0% | 68.6% | 80% (Fiscal Year '02) |
| Separation Determ. within 21 Days | 50,253 | 76.7% | 73.3% | 80% (Fiscal Year '02) |
| Nonmonetary Issue Detection Timeliness: First Week Affected to Detection Date |
||||
| Nonseparation Issues within 14 Days | 18,365 | 86.7% | 63.1% | none |
| Separation Issues within 21 Days | 50,253 | 97.5% | 90.7% | none |
| Lower Authority Appeals Timeliness | ||||
| Decisions within 30 Days of Filing | 2,196 | 98.4% | 67.9% | 60% |
| Decisions within 45 Days of Filing | 2,196 | 99.0% | 85.4% | 80% |
| Decisions within 90 Days of Filing | 2,196 | 99.7% | 95.5% | 95% (Fiscal Year '02) |
| Higher Authority Appeals Timeliness | ||||
| Decisions within 45 Days of Filing | + | + | 62.7% | 50% (Fiscal Year '00) |
| Decisions within 75 Days of Filing | + | + | 85.6% | 80% (Fiscal Year '00) |
| Decisions within 150 Days of Filing | + | + | 96.3% | 95% (Fiscal Year '00) |
| Combined Wage Program Timeliness | ||||
| Wage Transfers Made within 3 Days | 4,793 | 100.0% | 69.8% | none |
| Wage Transfers Made within 14 Days | 4,793 | 100.0% | 97.3% | none |
| Billing Made within 45 Days | 154 | 100.0% | 92.6% | none |
| Reimbursements Made within 45 Days | 195 | 91.8% | 96.4% | none |
| Continued Claims Payment Timeliness | ||||
| Payments Made within 7 Days | 268,305 | 94.9% | 61.4% | none |
| Payments Made within 14 Days | 268,305 | 98.6% | 92.5% | none |
| Payments Made within 21 Days | 268,305 | 99.3% | 96.3% | none |
| Benefit Quality Measures | ||||
| Nonmon. Determin. with Scores > 80% | 218 | 69.6% | 70.9% | 75% (Fiscal Year '02) |
| LA Appeals with Scores >= 85% | 80 | 98.8% | 90.5% | 80% (Fiscal Year '00) |
| Benefit Payment Control | ||||
| Fraud Overpayment Recovery Rate | 593,296 | 69.2% | 50.9% | none |
| Nonfraud Overpayment Recovery Rate | 657,656 | 94.8% | 56.1% | none |
| Nebraska | ||||
| REPORTED MEASURE | STATE RESULTS | NATIONAL RESULTS | CRITERION | |
|---|---|---|---|---|
| Cash Management | ||||
| Average time (days) funds are on deposit before being transferred to Trust Fund | 2.2 | 2.1 days | <= 2 (Fiscal Year '00) | |
| Ratio of avg daily loanable balance in Clearing Account to avg daily transfer to Tust Fund | 1.80 | 1.70 | <= 1.75 (Fiscal Year '02) | |
| Benefit Accuracy Measurement | ||||
| Total Dollars Paid in Population | $42,044,418 | $18.8 B | none | |
| Sample Size | 363 | 26,353 | none | |
| Proper Payment Rate | 93.2 +/- 2.6 | 91.5% | none | |
| Overpayment Rate | 7 +/- 2.6 | 8.5% | none | |
| Underpayment Rate | 0.6 +/- 0.6 | 0.9% | none | |
| Footnotes: | #1 | |||
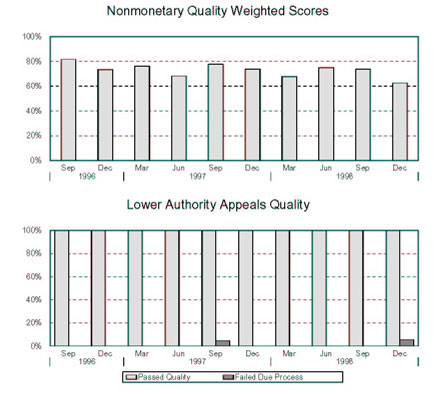
| Nebraska | ||||
| REPORTED MEASURE | STATE RESULTS | NATIONAL RESULTS | ||
|---|---|---|---|---|
| Status Determinations | ||||
| New Employer Determinations: | ||||
| Percentage Made Within 90 Days (Fiscal Year '00 criterion: 60%) | 84.0% | 78.0% | ||
| Percentage Made Within 180 Days (Fiscal Year '00 criterion: 80%) | 96.1% | 89.7% | ||
| Accuracy In Determinations? (Fiscal Year '02 criterion: <= 6 failed) | P | 45.8% Pass | ||
| Accuracy In Postings? | F | 39.6% Pass | ||
| Successor Determinations: | ||||
| Percentage Made Within 90 Days | 87.9% | 67.0% | ||
| Percentage Made Within 180 Days | 96.9% | 81.5% | ||
| Accuracy In Determinations? | P | 54.2% Pass | ||
| Accuracy In Postings? | F | 45.8% Pass | ||
| Inactivations: | ||||
| Accuracy In Determinations? | P | 64.4% Pass | ||
| Accuracy In Postings? | P | 64.6% Pass | ||
| Report Delinquency | ||||
| Reports From Contributory Employers: | ||||
| Percentage Filed Timely | 93.6% | 87.4% | ||
| Percentage Secured | 99.1% | 92.5% | ||
| Percentage Resolved | 100.9% | 97.1% | ||
| Reports From Reimbursing Employers: | ||||
| Percentage Filed Timely | 95.5% | 79.8% | ||
| Percentage Secured | 98.9% | 85.9% | ||
| Percentage Resolved | 99.8% | 87.5% | ||
| Appropriate Actions Taken To Resolve Delinquencies? | P | 76.6% Pass | ||
| Collections | ||||
| Collections From Contributory Employers: | ||||
| Percentage Of Tax Due Paid Timely | 93.4% | 92.0% | ||
| Turnover Ratio - Ratio Of Receivables Liquidated Or Declared Uncollectible/Doubtful To Tax Due | 7.1% | 8.1% | ||
| Percentage of Tax Due Declared Uncollectible/Doubtful | 1.6% | 1.3% | ||
| Accounts Receivable As A Percentage Of Tax Due | 1.8% | 2.2% | ||
| Collections From Reimbursing Employers: | ||||
| Percentage Of Tax Due Paid Timely | 92.0% | 80.6% | ||
| Turnover Ratio - Ratio Of Receivables Liquidated Or Declared Uncollectible/Doubtful To Tax Due | 7.4% | 19.4% | ||
| Percentage of Tax Due Declared Uncollectible/Doubtful | 0.0% | 1.2% | ||
| Accounts Receivable As A Percentage Of Tax Due | 0.7% | 4.6% | ||
| Appropriate Actions Taken To Collect Tax Due? | P | 48.9% Pass | ||
| Cashiering | ||||
| Remittances Deposited Within Three Days? | P | 92.0% Pass | ||
| Field Audit | ||||
| Percent Change In Total Wages Resulting From Audits | 1.9% | 5.0% | ||
| Percentage Of Contributory Employers Audited | 2.4% | 2.0% | ||
| Annualized Percentage Of Total Wages Audited | 1.0% | 1.8% | ||
| Audits Meet Employment Security Manual Requirements? | P | 64.6% Pass | ||
| Account Maintenance | ||||
| Accuracy In Report Processing? | P | 96.0% Pass | ||
| Accuracy In Contributory Employer Billing? | P | 84.8% Pass | ||
| Accuracy In Reimbursing Employer Billings? | P | 85.7% Pass | ||
| Accuracy In Credits/Refunds? | P | 73.9% Pass | ||
| Accuracy In Benefit Charging? | P | 89.6% Pass | ||
| Accuracy In Experience Rating? | P | 87.8% Pass | ||
| Nevada | ||||
| REPORTED MEASURE | WORKLOAD | STATE RESULTS |
NATIONAL RESULTS |
CRITERION |
|---|---|---|---|---|
| First Payment Timeliness | ||||
| Intrastate UI, full weeks - 14/21 Days | 47,390 | 90.7% | 90.1% | 87% |
| Intrastate UI, full weeks - 35 Days | 47,390 | 96.6% | 97.2% | 93% |
| Interstate UI, full weeks - 14/21 Days | 5,040 | 71.3% | 78.4% | 70% |
| Interstate UI, full weeks - 35 Days | 5,040 | 90.1% | 92.4% | 78% |
| All First Payments - 14/21 Days | 61,350 | 88.6% | 89.2% | 90% (Fiscal Year '02) |
| All First Payments - 35 Days | 61,350 | 96.0% | 97.0% | 95% (Fiscal Year '02) |
| Nonmonetary Determinations Timeliness: Detection Date to Determination Date |
||||
| Nonseparation Determ. within 14 Days | 17,233 | 43.0% | 68.6% | 80% (Fiscal Year '02) |
| Separation Determ. within 21 Days | 42,821 | 79.0% | 73.3% | 80% (Fiscal Year '02) |
| Nonmonetary Issue Detection Timeliness: First Week Affected to Detection Date |
||||
| Nonseparation Issues within 14 Days | 17,233 | 89.5% | 63.1% | none |
| Separation Issues within 21 Days | 42,821 | 98.4% | 90.7% | none |
| Lower Authority Appeals Timeliness | ||||
| Decisions within 30 Days of Filing | 9,046 | 83.1% | 67.9% | 60% |
| Decisions within 45 Days of Filing | 9,046 | 95.2% | 85.4% | 80% |
| Decisions within 90 Days of Filing | 9,046 | 99.7% | 95.5% | 95% (Fiscal Year '02) |
| Higher Authority Appeals Timeliness | ||||
| Decisions within 45 Days of Filing | 1,625 | 59.0% | 62.7% | 50% (Fiscal Year '00) |
| Decisions within 75 Days of Filing | 1,625 | 89.8% | 85.6% | 80% (Fiscal Year '00) |
| Decisions within 150 Days of Filing | 1,625 | 99.8% | 96.3% | 95% (Fiscal Year '00) |
| Combined Wage Program Timeliness | ||||
| Wage Transfers Made within 3 Days | 8,199 | 82.0% | 69.8% | none |
| Wage Transfers Made within 14 Days | 8,199 | 94.8% | 97.3% | none |
| Billing Made within 45 Days | 101 | 95.0% | 92.6% | none |
| Reimbursements Made within 45 Days | 150 | 100.0% | 96.4% | none |
| Continued Claims Payment Timeliness | ||||
| Payments Made within 7 Days | 842,731 | 45.7% | 61.4% | none |
| Payments Made within 14 Days | 842,731 | 87.6% | 92.5% | none |
| Payments Made within 21 Days | 842,731 | 95.0% | 96.3% | none |
| Benefit Quality Measures | ||||
| Nonmon. Determin. with Scores > 80% | 235 | 70.9% | 70.9% | 75% (Fiscal Year '02) |
| LA Appeals with Scores >= 85% | 76 | 98.7% | 90.5% | 80% (Fiscal Year '00) |
| Benefit Payment Control | ||||
| Fraud Overpayment Recovery Rate | 948,506 | 69.2% | 50.9% | none |
| Nonfraud Overpayment Recovery Rate | 1,436,108 | 94.8% | 56.1% | none |
| Nebvada | ||||
| REPORTED MEASURE | STATE RESULTS | NATIONAL RESULTS | CRITERION | |
|---|---|---|---|---|
| Cash Management | ||||
| Average time (days) funds are on deposit before being transferred to Trust Fund | 2.8 | 2.1 days | <= 2 (Fiscal Year '00) | |
| Ratio of avg daily loanable balance in Clearing Account to avg daily transfer to Tust Fund | 1.21 | 1.70 | <= 1.75 (Fiscal Year '02) | |
| Benefit Accuracy Measurement | ||||
| Total Dollars Paid in Population | $154,654,167 | $18.8 B | none | |
| Sample Size | 480 | 26,353 | none | |
| Proper Payment Rate | 86.9 +/- 3.2 | 91.5% | none | |
| Overpayment Rate | 13.1 +/- 3.2 | 8.5% | none | |
| Underpayment Rate | 0.6 +/- 0.4 | 0.9% | none | |
| Footnotes: | #1 | |||
| Nevada | ||||
| REPORTED MEASURE | STATE RESULTS | NATIONAL RESULTS | ||
|---|---|---|---|---|
| Status Determinations | ||||
| New Employer Determinations: | ||||
| Percentage Made Within 90 Days (Fiscal Year '00 criterion: 60%) | 86.7% | 78.0% | ||
| Percentage Made Within 180 Days (Fiscal Year '00 criterion: 80%) | 92.1% | 89.7% | ||
| Accuracy In Determinations? (Fiscal Year '02 criterion: <= 6 failed) | F | 45.8% Pass | ||
| Accuracy In Postings? | F | 39.6% Pass | ||
| Successor Determinations: | ||||
| Percentage Made Within 90 Days | 71.5% | 67.0% | ||
| Percentage Made Within 180 Days | 84.5% | 81.5% | ||
| Accuracy In Determinations? | F | 54.2% Pass | ||
| Accuracy In Postings? | F | 45.8% Pass | ||
| Inactivations: | ||||
| Accuracy In Determinations? | F | 64.4% Pass | ||
| Accuracy In Postings? | F | 64.6% Pass | ||
| Report Delinquency | ||||
| Reports From Contributory Employers: | ||||
| Percentage Filed Timely | 91.2% | 87.4% | ||
| Percentage Secured | 97.6% | 92.5% | ||
| Percentage Resolved | 100.3% | 97.1% | ||
| Reports From Reimbursing Employers: | ||||
| Percentage Filed Timely | 91.4% | 79.8% | ||
| Percentage Secured | 97.7% | 85.9% | ||
| Percentage Resolved | 100.3% | 87.5% | ||
| Appropriate Actions Taken To Resolve Delinquencies? | ** | 76.6% Pass | ||
| Collections | ||||
| Collections From Contributory Employers: | ||||
| Percentage Of Tax Due Paid Timely | 96.5% | 92.0% | ||
| Turnover Ratio - Ratio Of Receivables Liquidated Or Declared Uncollectible/Doubtful To Tax Due | 3.5% | 8.1% | ||
| Percentage of Tax Due Declared Uncollectible/Doubtful | 0.8% | 1.3% | ||
| Accounts Receivable As A Percentage Of Tax Due | 1.8% | 2.2% | ||
| Collections From Reimbursing Employers: | ||||
| Percentage Of Tax Due Paid Timely | 80.8% | 80.6% | ||
| Turnover Ratio - Ratio Of Receivables Liquidated Or Declared Uncollectible/Doubtful To Tax Due | 17.5% | 19.4% | ||
| Percentage of Tax Due Declared Uncollectible/Doubtful | 0.2% | 1.2% | ||
| Accounts Receivable As A Percentage Of Tax Due | 3.8% | 4.6% | ||
| Appropriate Actions Taken To Collect Tax Due? | ** | 48.9% Pass | ||
| Cashiering | ||||
| Remittances Deposited Within Three Days? | P | 92.0% Pass | ||
| Field Audit | ||||
| Percent Change In Total Wages Resulting From Audits | 3.2% | 5.0% | ||
| Percentage Of Contributory Employers Audited | 2.0% | 2.0% | ||
| Annualized Percentage Of Total Wages Audited | 1.9% | 1.8% | ||
| Audits Meet Employment Security Manual Requirements? | P | 64.6% Pass | ||
| Account Maintenance | ||||
| Accuracy In Report Processing? | P | 96.0% Pass | ||
| Accuracy In Contributory Employer Billing? | P | 84.8% Pass | ||
| Accuracy In Reimbursing Employer Billings? | F | 85.7% Pass | ||
| Accuracy In Credits/Refunds? | P | 73.9% Pass | ||
| Accuracy In Benefit Charging? | ** | 89.6% Pass | ||
| Accuracy In Experience Rating? | P | 87.8% Pass | ||
** State had a problem in establishing the sample universe.
| New Hampshire | ||||
| REPORTED MEASURE | WORKLOAD | STATE RESULTS |
NATIONAL RESULTS |
CRITERION |
|---|---|---|---|---|
| First Payment Timeliness | ||||
| Intrastate UI, full weeks - 14/21 Days | 11,906 | 89.2% | 90.1% | 87% |
| Intrastate UI, full weeks - 35 Days | 11,906 | 96.8% | 97.2% | 93% |
| Interstate UI, full weeks - 14/21 Days | 421 | 72.2% | 78.4% | 70% |
| Interstate UI, full weeks - 35 Days | 421 | 90.3% | 92.4% | 78% |
| All First Payments - 14/21 Days | 15,602 | 87.9% | 89.2% | 90% (Fiscal Year '02) |
| All First Payments - 35 Days | 15,602 | 96.2% | 97.0% | 95% (Fiscal Year '02) |
| Nonmonetary Determinations Timeliness: Detection Date to Determination Date |
||||
| Nonseparation Determ. within 14 Days | 15,234 | 47.1% | 68.6% | 80% (Fiscal Year '02) |
| Separation Determ. within 21 Days | 7,929 | 58.5% | 73.3% | 80% (Fiscal Year '02) |
| Nonmonetary Issue Detection Timeliness: First Week Affected to Detection Date |
||||
| Nonseparation Issues within 14 Days | 15,234 | 78.8% | 63.1% | none |
| Separation Issues within 21 Days | 7,929 | 96.6% | 90.7% | none |
| Lower Authority Appeals Timeliness | ||||
| Decisions within 30 Days of Filing | 1,777 | 75.4% | 67.9% | 60% |
| Decisions within 45 Days of Filing | 1,777 | 90.6% | 85.4% | 80% |
| Decisions within 90 Days of Filing | 1,777 | 97.7% | 95.5% | 95% (Fiscal Year '02) |
| Higher Authority Appeals Timeliness | ||||
| Decisions within 45 Days of Filing | 248 | 79.0% | 62.7% | 50% (Fiscal Year '00) |
| Decisions within 75 Days of Filing | 248 | 87.9% | 85.6% | 80% (Fiscal Year '00) |
| Decisions within 150 Days of Filing | 248 | 99.6% | 96.3% | 95% (Fiscal Year '00) |
| Combined Wage Program Timeliness | ||||
| Wage Transfers Made within 3 Days | 2,644 | 95.7% | 69.8% | none |
| Wage Transfers Made within 14 Days | 2,644 | 99.5% | 97.3% | none |
| Billing Made within 45 Days | 151 | 29.1% | 92.6% | none |
| Reimbursements Made within 45 Days | 210 | 61.9% | 96.4% | none |
| Continued Claims Payment Timeliness | ||||
| Payments Made within 7 Days | 134,727 | 37.3% | 61.4% | none |
| Payments Made within 14 Days | 134,727 | 82.7% | 92.5% | none |
| Payments Made within 21 Days | 134,727 | 93.4% | 96.3% | none |
| Benefit Quality Measures | ||||
| Nonmon. Determin. with Scores > 80% | 213 | 59.7% | 70.9% | 75% (Fiscal Year '02) |
| LA Appeals with Scores >= 85% | 77 | 94.9% | 90.5% | 80% (Fiscal Year '00) |
| Benefit Payment Control | ||||
| Fraud Overpayment Recovery Rate | 238,725 | 42.5% | 50.9% | none |
| Nonfraud Overpayment Recovery Rate | 341,631 | 71.4% | 56.1% | none |
| New Hampshire | ||||
| REPORTED MEASURE | STATE RESULTS | NATIONAL RESULTS | CRITERION | |
|---|---|---|---|---|
| Cash Management | ||||
| Average time (days) funds are on deposit before being transferred to Trust Fund | 3.4 | 2.1 days | <= 2 (Fiscal Year '00) | |
| Ratio of avg daily loanable balance in Clearing Account to avg daily transfer to Tust Fund | 4.24 | 1.70 | <= 1.75 (Fiscal Year '02) | |
| Benefit Accuracy Measurement | ||||
| Total Dollars Paid in Population | $21,998,177 | $18.8 B | none | |
| Sample Size | 382 | 26,353 | none | |
| Proper Payment Rate | 93.1 +/- 2.7 | 91.5% | none | |
| Overpayment Rate | 6.9 +/- 2.7 | 8.5% | none | |
| Underpayment Rate | 1.1 +/- 0.7 | 0.9% | none | |
| Footnotes: | none | |||
| New Hampshire | ||||
| REPORTED MEASURE | STATE RESULTS | NATIONAL RESULTS | ||
|---|---|---|---|---|
| Status Determinations | ||||
| New Employer Determinations: | ||||
| Percentage Made Within 90 Days (Fiscal Year '00 criterion: 60%) | 85.8% | 78.0% | ||
| Percentage Made Within 180 Days (Fiscal Year '00 criterion: 80%) | 91.1% | 89.7% | ||
| Accuracy In Determinations? (Fiscal Year '02 criterion: <= 6 failed) | P | 45.8% Pass | ||
| Accuracy In Postings? | P | 39.6% Pass | ||
| Successor Determinations: | ||||
| Percentage Made Within 90 Days | 89.0% | 67.0% | ||
| Percentage Made Within 180 Days | 95.4% | 81.5% | ||
| Accuracy In Determinations? | P | 54.2% Pass | ||
| Accuracy In Postings? | P | 45.8% Pass | ||
| Inactivations: | ||||
| Accuracy In Determinations? | P | 64.4% Pass | ||
| Accuracy In Postings? | P | 64.6% Pass | ||
| Report Delinquency | ||||
| Reports From Contributory Employers: | ||||
| Percentage Filed Timely | 93.6% | 87.4% | ||
| Percentage Secured | 98.9% | 92.5% | ||
| Percentage Resolved | 99.8% | 97.1% | ||
| Reports From Reimbursing Employers: | ||||
| Percentage Filed Timely | 97.2% | 79.8% | ||
| Percentage Secured | 99.3% | 85.9% | ||
| Percentage Resolved | 99.7% | 87.5% | ||
| Appropriate Actions Taken To Resolve Delinquencies? | P | 76.6% Pass | ||
| Collections | ||||
| Collections From Contributory Employers: | ||||
| Percentage Of Tax Due Paid Timely | 93.4% | 92.0% | ||
| Turnover Ratio - Ratio Of Receivables Liquidated Or Declared Uncollectible/Doubtful To Tax Due | 6.5% | 8.1% | ||
| Percentage of Tax Due Declared Uncollectible/Doubtful | 0.6% | 1.3% | ||
| Accounts Receivable As A Percentage Of Tax Due | 0.9% | 2.2% | ||
| Collections From Reimbursing Employers: | ||||
| Percentage Of Tax Due Paid Timely | 91.5% | 80.6% | ||
| Turnover Ratio - Ratio Of Receivables Liquidated Or Declared Uncollectible/Doubtful To Tax Due | 11.0% | 19.4% | ||
| Percentage of Tax Due Declared Uncollectible/Doubtful | 0.9% | 1.2% | ||
| Accounts Receivable As A Percentage Of Tax Due | 1.8% | 4.6% | ||
| Appropriate Actions Taken To Collect Tax Due? | P | 48.9% Pass | ||
| Cashiering | ||||
| Remittances Deposited Within Three Days? | P | 92.0% Pass | ||
| Field Audit | ||||
| Percent Change In Total Wages Resulting From Audits | 7.8% | 5.0% | ||
| Percentage Of Contributory Employers Audited | 2.2% | 2.0% | ||
| Annualized Percentage Of Total Wages Audited | 1.6% | 1.8% | ||
| Audits Meet Employment Security Manual Requirements? | P | 64.6% Pass | ||
| Account Maintenance | ||||
| Accuracy In Report Processing? | P | 96.0% Pass | ||
| Accuracy In Contributory Employer Billing? | P | 84.8% Pass | ||
| Accuracy In Reimbursing Employer Billings? | P | 85.7% Pass | ||
| Accuracy In Credits/Refunds? | P | 73.9% Pass | ||
| Accuracy In Benefit Charging? | P | 89.6% Pass | ||
| Accuracy In Experience Rating? | P | 87.8% Pass | ||
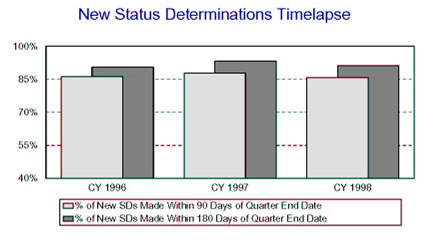
| New Jersey | ||||
| REPORTED MEASURE | WORKLOAD | STATE RESULTS |
NATIONAL RESULTS |
CRITERION |
|---|---|---|---|---|
| First Payment Timeliness | ||||
| Intrastate UI, full weeks - 14/21 Days | 235,904 | 93.0% | 90.1% | 87% |
| Intrastate UI, full weeks - 35 Days | 235,904 | 98.3% | 97.2% | 93% |
| Interstate UI, full weeks - 14/21 Days | 10,082 | 76.2% | 78.4% | 70% |
| Interstate UI, full weeks - 35 Days | 10,082 | 91.8% | 92.4% | 78% |
| All First Payments - 14/21 Days | 267,656 | 91.5% | 89.2% | 90% (Fiscal Year '02) |
| All First Payments - 35 Days | 267,656 | 98.0% | 97.0% | 95% (Fiscal Year '02) |
| Nonmonetary Determinations Timeliness: Detection Date to Determination Date |
||||
| Nonseparation Determ. within 14 Days | 92,282 | 66.2% | 68.6% | 80% (Fiscal Year '02) |
| Separation Determ. within 21 Days | 85,445 | 80.8% | 73.3% | 80% (Fiscal Year '02) |
| Nonmonetary Issue Detection Timeliness: First Week Affected to Detection Date |
||||
| Nonseparation Issues within 14 Days | 92,282 | 79.3% | 63.1% | none |
| Separation Issues within 21 Days | 85,445 | 68.4% | 90.7% | none |
| Lower Authority Appeals Timeliness | ||||
| Decisions within 30 Days of Filing | 31,308 | 72.7% | 67.9% | 60% |
| Decisions within 45 Days of Filing | 31,308 | 84.5% | 85.4% | 80% |
| Decisions within 90 Days of Filing | 31,308 | 95.4% | 95.5% | 95% (Fiscal Year '02) |
| Higher Authority Appeals Timeliness | ||||
| Decisions within 45 Days of Filing | 5,568 | 85.1% | 62.7% | 50% (Fiscal Year '00) |
| Decisions within 75 Days of Filing | 5,568 | 96.8% | 85.6% | 80% (Fiscal Year '00) |
| Decisions within 150 Days of Filing | 5,568 | 99.6% | 96.3% | 95% (Fiscal Year '00) |
| Combined Wage Program Timeliness | ||||
| Wage Transfers Made within 3 Days | 14,339 | 76.5% | 69.8% | none |
| Wage Transfers Made within 14 Days | 14,339 | 99.0% | 97.3% | none |
| Billing Made within 45 Days | 156 | 100.0% | 92.6% | none |
| Reimbursements Made within 45 Days | 145 | 97.2% | 96.4% | none |
| Continued Claims Payment Timeliness | ||||
| Payments Made within 7 Days | 3,914,767 | 47.5% | 61.4% | none |
| Payments Made within 14 Days | 3,914,767 | 93.6% | 92.5% | none |
| Payments Made within 21 Days | 3,914,767 | 97.2% | 96.3% | none |
| Benefit Quality Measures | ||||
| Nonmon. Determin. with Scores > 80% | 360 | 58.7% | 70.9% | 75% (Fiscal Year '02) |
| LA Appeals with Scores >= 85% | 72 | 70.5% | 90.5% | 80% (Fiscal Year '00) |
| Benefit Payment Control | ||||
| Fraud Overpayment Recovery Rate | 9,785,283 | 56.6% | 50.9% | none |
| Nonfraud Overpayment Recovery Rate | 18,390,468 | 71.4% | 56.1% | none |
| New Jersey | ||||
| REPORTED MEASURE | STATE RESULTS | NATIONAL RESULTS | CRITERION | |
|---|---|---|---|---|
| Cash Management | ||||
| Average time (days) funds are on deposit before being transferred to Trust Fund | 0.7 | 2.1 days | <= 2 (Fiscal Year '00) | |
| Ratio of avg daily loanable balance in Clearing Account to avg daily transfer to Tust Fund | 0.05 | 1.70 | <= 1.75 (Fiscal Year '02) | |
| Benefit Accuracy Measurement | ||||
| Total Dollars Paid in Population | $1,043,505,060 | $18.8 B | none | |
| Sample Size | 471 | 26,353 | none | |
| Proper Payment Rate | 94 +/- 1.9 | 91.5% | none | |
| Overpayment Rate | 6 +/- 1.9 | 8.5% | none | |
| Underpayment Rate | 1.2 +/- 0.4 | 0.9% | none | |
| Footnotes: | none | |||

| New Jersey | ||||
| REPORTED MEASURE | STATE RESULTS | NATIONAL RESULTS | ||
|---|---|---|---|---|
| Status Determinations | ||||
| New Employer Determinations: | ||||
| Percentage Made Within 90 Days (Fiscal Year '00 criterion: 60%) | 54.3% | 78.0% | ||
| Percentage Made Within 180 Days (Fiscal Year '00 criterion: 80%) | 85.3% | 89.7% | ||
| Accuracy In Determinations? (Fiscal Year '02 criterion: <= 6 failed) | F | 45.8% Pass | ||
| Accuracy In Postings? | F | 39.6% Pass | ||
| Successor Determinations: | ||||
| Percentage Made Within 90 Days | 66.6% | 67.0% | ||
| Percentage Made Within 180 Days | 77.0% | 81.5% | ||
| Accuracy In Determinations? | F | 54.2% Pass | ||
| Accuracy In Postings? | F | 45.8% Pass | ||
| Inactivations: | ||||
| Accuracy In Determinations? | F | 64.4% Pass | ||
| Accuracy In Postings? | F | 64.6% Pass | ||
| Report Delinquency | ||||
| Reports From Contributory Employers: | ||||
| Percentage Filed Timely | 65.9% | 87.4% | ||
| Percentage Secured | 69.7% | 92.5% | ||
| Percentage Resolved | 71.0% | 97.1% | ||
| Reports From Reimbursing Employers: | ||||
| Percentage Filed Timely | 40.4% | 79.8% | ||
| Percentage Secured | 42.3% | 85.9% | ||
| Percentage Resolved | 44.4% | 87.5% | ||
| Appropriate Actions Taken To Resolve Delinquencies? | P | 76.6% Pass | ||
| Collections | ||||
| Collections From Contributory Employers: | ||||
| Percentage Of Tax Due Paid Timely | 0.0% | 92.0% | ||
| Turnover Ratio - Ratio Of Receivables Liquidated Or Declared Uncollectible/Doubtful To Tax Due | 0.0% | 8.1% | ||
| Percentage of Tax Due Declared Uncollectible/Doubtful | 0.0% | 1.3% | ||
| Accounts Receivable As A Percentage Of Tax Due | 0.0% | 2.2% | ||
| Collections From Reimbursing Employers: | ||||
| Percentage Of Tax Due Paid Timely | 0.0% | 80.6% | ||
| Turnover Ratio - Ratio Of Receivables Liquidated Or Declared Uncollectible/Doubtful To Tax Due | 0.0% | 19.4% | ||
| Percentage of Tax Due Declared Uncollectible/Doubtful | 0.0% | 1.2% | ||
| Accounts Receivable As A Percentage Of Tax Due | 0.0% | 4.6% | ||
| Appropriate Actions Taken To Collect Tax Due? | F | 48.9% Pass | ||
| Cashiering | ||||
| Remittances Deposited Within Three Days? | P | 92.0% Pass | ||
| Field Audit | ||||
| Percent Change In Total Wages Resulting From Audits | 3.8% | 5.0% | ||
| Percentage Of Contributory Employers Audited | 2.4% | 2.0% | ||
| Annualized Percentage Of Total Wages Audited | 2.1% | 1.8% | ||
| Audits Meet Employment Security Manual Requirements? | P | 64.6% Pass | ||
| Account Maintenance | ||||
| Accuracy In Report Processing? | P | 96.0% Pass | ||
| Accuracy In Contributory Employer Billing? | P | 84.8% Pass | ||
| Accuracy In Reimbursing Employer Billings? | P | 85.7% Pass | ||
| Accuracy In Credits/Refunds? | ** | 73.9% Pass | ||
| Accuracy In Benefit Charging? | P | 89.6% Pass | ||
| Accuracy In Experience Rating? | F | 87.8% Pass | ||
** State had a problem in establishing the sample universe.
| New Mexico | ||||
| REPORTED MEASURE | WORKLOAD | STATE RESULTS |
NATIONAL RESULTS |
CRITERION |
|---|---|---|---|---|
| First Payment Timeliness | ||||
| Intrastate UI, full weeks - 14/21 Days | 29,844 | 86.9% | 90.1% | 87% |
| Intrastate UI, full weeks - 35 Days | 29,844 | 95.8% | 97.2% | 93% |
| Interstate UI, full weeks - 14/21 Days | 1,341 | 77.1% | 78.4% | 70% |
| Interstate UI, full weeks - 35 Days | 1,341 | 94.0% | 92.4% | 78% |
| All First Payments - 14/21 Days | 33,001 | 86.3% | 89.2% | 90% (Fiscal Year '02) |
| All First Payments - 35 Days | 33,001 | 95.7% | 97.0% | 95% (Fiscal Year '02) |
| Nonmonetary Determinations Timeliness: Detection Date to Determination Date |
||||
| Nonseparation Determ. within 14 Days | 9,544 | 31.3% | 68.6% | 80% (Fiscal Year '02) |
| Separation Determ. within 21 Days | 14,184 | 53.5% | 73.3% | 80% (Fiscal Year '02) |
| Nonmonetary Issue Detection Timeliness: First Week Affected to Detection Date |
||||
| Nonseparation Issues within 14 Days | 9,543 | 36.1% | 63.1% | none |
| Separation Issues within 21 Days | 14,184 | 71.2% | 90.7% | none |
| Lower Authority Appeals Timeliness | ||||
| Decisions within 30 Days of Filing | 6,412 | 83.2% | 67.9% | 60% |
| Decisions within 45 Days of Filing | 6,412 | 92.6% | 85.4% | 80% |
| Decisions within 90 Days of Filing | 6,412 | 98.6% | 95.5% | 95% (Fiscal Year '02) |
| Higher Authority Appeals Timeliness | ||||
| Decisions within 45 Days of Filing | 960 | 87.8% | 62.7% | 50% (Fiscal Year '00) |
| Decisions within 75 Days of Filing | 960 | 98.4% | 85.6% | 80% (Fiscal Year '00) |
| Decisions within 150 Days of Filing | 960 | 100.0% | 96.3% | 95% (Fiscal Year '00) |
| Combined Wage Program Timeliness | ||||
| Wage Transfers Made within 3 Days | 4,784 | 93.2% | 69.8% | none |
| Wage Transfers Made within 14 Days | 4,784 | 100.0% | 97.3% | none |
| Billing Made within 45 Days | 182 | 100.0% | 92.6% | none |
| Reimbursements Made within 45 Days | 187 | 100.0% | 96.4% | none |
| Continued Claims Payment Timeliness | ||||
| Payments Made within 7 Days | 590,790 | 44.8% | 61.4% | none |
| Payments Made within 14 Days | 590,790 | 91.1% | 92.5% | none |
| Payments Made within 21 Days | 590,790 | 95.9% | 96.3% | none |
| Benefit Quality Measures | ||||
| Nonmon. Determin. with Scores > 80% | 210 | 58.7% | 70.9% | 75% (Fiscal Year '02) |
| LA Appeals with Scores >= 85% | 73 | 85.0% | 90.5% | 80% (Fiscal Year '00) |
| Benefit Payment Control | ||||
| Fraud Overpayment Recovery Rate | 827,112 | 77.8% | 50.9% | none |
| Nonfraud Overpayment Recovery Rate | 1,021,734 | 71.4% | 56.1% | none |
| New Mexico | ||||
| REPORTED MEASURE | STATE RESULTS | NATIONAL RESULTS | CRITERION | |
|---|---|---|---|---|
| Cash Management | ||||
| Average time (days) funds are on deposit before being transferred to Trust Fund | 0.9 | 2.1 days | <= 2 (Fiscal Year '00) | |
| Ratio of avg daily loanable balance in Clearing Account to avg daily transfer to Tust Fund | -0.44 | 1.70 | <= 1.75 (Fiscal Year '02) | |
| Benefit Accuracy Measurement | ||||
| Total Dollars Paid in Population | $78,495,179 | $18.8 B | none | |
| Sample Size | 480 | 26,353 | none | |
| Proper Payment Rate | 94.1 +/- 2.3 | 91.5% | none | |
| Overpayment Rate | 5.9 +/- 2.3 | 8.5% | none | |
| Underpayment Rate | 0.1 +/- 0.1 | 0.9% | none | |
| Footnotes: | #1 | |||
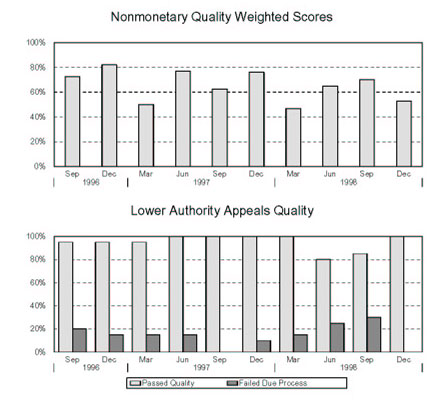
| New Mexico | ||||
| REPORTED MEASURE | STATE RESULTS | NATIONAL RESULTS | ||
|---|---|---|---|---|
| Status Determinations | ||||
| New Employer Determinations: | ||||
| Percentage Made Within 90 Days (Fiscal Year '00 criterion: 60%) | 82.3% | 78.0% | ||
| Percentage Made Within 180 Days (Fiscal Year '00 criterion: 80%) | 90.8% | 89.7% | ||
| Accuracy In Determinations? (Fiscal Year '02 criterion: <= 6 failed) | F | 45.8% Pass | ||
| Accuracy In Postings? | F | 39.6% Pass | ||
| Successor Determinations: | ||||
| Percentage Made Within 90 Days | 75.9% | 67.0% | ||
| Percentage Made Within 180 Days | 87.3% | 81.5% | ||
| Accuracy In Determinations? | F | 54.2% Pass | ||
| Accuracy In Postings? | F | 45.8% Pass | ||
| Inactivations: | ||||
| Accuracy In Determinations? | F | 64.4% Pass | ||
| Accuracy In Postings? | F | 64.6% Pass | ||
| Report Delinquency | ||||
| Reports From Contributory Employers: | ||||
| Percentage Filed Timely | 89.1% | 87.4% | ||
| Percentage Secured | 92.4% | 92.5% | ||
| Percentage Resolved | 94.5% | 97.1% | ||
| Reports From Reimbursing Employers: | ||||
| Percentage Filed Timely | 94.9% | 79.8% | ||
| Percentage Secured | 98.3% | 85.9% | ||
| Percentage Resolved | 99.5% | 87.5% | ||
| Appropriate Actions Taken To Resolve Delinquencies? | F | 76.6% Pass | ||
| Collections | ||||
| Collections From Contributory Employers: | ||||
| Percentage Of Tax Due Paid Timely | 97.2% | 92.0% | ||
| Turnover Ratio - Ratio Of Receivables Liquidated Or Declared Uncollectible/Doubtful To Tax Due | 3.1% | 8.1% | ||
| Percentage of Tax Due Declared Uncollectible/Doubtful | 0.9% | 1.3% | ||
| Accounts Receivable As A Percentage Of Tax Due | 2.7% | 2.2% | ||
| Collections From Reimbursing Employers: | ||||
| Percentage Of Tax Due Paid Timely | 96.0% | 80.6% | ||
| Turnover Ratio - Ratio Of Receivables Liquidated Or Declared Uncollectible/Doubtful To Tax Due | 4.5% | 19.4% | ||
| Percentage of Tax Due Declared Uncollectible/Doubtful | 0.0% | 1.2% | ||
| Accounts Receivable As A Percentage Of Tax Due | 0.4% | 4.6% | ||
| Appropriate Actions Taken To Collect Tax Due? | F | 48.9% Pass | ||
| Cashiering | ||||
| Remittances Deposited Within Three Days? | P | 92.0% Pass | ||
| Field Audit | ||||
| Percent Change In Total Wages Resulting From Audits | 0.6% | 5.0% | ||
| Percentage Of Contributory Employers Audited | 2.1% | 2.0% | ||
| Annualized Percentage Of Total Wages Audited | 1.4% | 1.8% | ||
| Audits Meet Employment Security Manual Requirements? | F | 64.6% Pass | ||
| Account Maintenance | ||||
| Accuracy In Report Processing? | P | 96.0% Pass | ||
| Accuracy In Contributory Employer Billing? | F | 84.8% Pass | ||
| Accuracy In Reimbursing Employer Billings? | ** | 85.7% Pass | ||
| Accuracy In Credits/Refunds? | F | 73.9% Pass | ||
| Accuracy In Benefit Charging? | F | 89.6% Pass | ||
| Accuracy In Experience Rating? | F | 87.8% Pass | ||
** State had a problem in establishing the sample universe.

| New York | ||||
| REPORTED MEASURE | WORKLOAD | STATE RESULTS |
NATIONAL RESULTS |
CRITERION |
|---|---|---|---|---|
| First Payment Timeliness | ||||
| Intrastate UI, full weeks - 14/21 Days | 386,577 | 85.9% | 90.1% | 87% |
| Intrastate UI, full weeks - 35 Days | 386,577 | 95.9% | 97.2% | 93% |
| Interstate UI, full weeks - 14/21 Days | 10,379 | 73.8% | 78.4% | 70% |
| Interstate UI, full weeks - 35 Days | 10,379 | 89.5% | 92.4% | 78% |
| All First Payments - 14/21 Days | 476,942 | 84.8% | 89.2% | 90% (Fiscal Year '02) |
| All First Payments - 35 Days | 476,942 | 95.4% | 97.0% | 95% (Fiscal Year '02) |
| Nonmonetary Determinations Timeliness: Detection Date to Determination Date |
||||
| Nonseparation Determ. within 14 Days | 184,134 | 54.6% | 68.6% | 80% (Fiscal Year '02) |
| Separation Determ. within 21 Days | 116,521 | 51.9% | 73.3% | 80% (Fiscal Year '02) |
| Nonmonetary Issue Detection Timeliness: First Week Affected to Detection Date |
||||
| Nonseparation Issues within 14 Days | 184,134 | 56.7% | 63.1% | none |
| Separation Issues within 21 Days | 116,521 | 90.6% | 90.7% | none |
| Lower Authority Appeals Timeliness | ||||
| Decisions within 30 Days of Filing | 42,813 | 79.0% | 67.9% | 60% |
| Decisions within 45 Days of Filing | 42,813 | 89.0% | 85.4% | 80% |
| Decisions within 90 Days of Filing | 42,813 | 97.1% | 95.5% | 95% (Fiscal Year '02) |
| Higher Authority Appeals Timeliness | ||||
| Decisions within 45 Days of Filing | 7,492 | 54.2% | 62.7% | 50% (Fiscal Year '00) |
| Decisions within 75 Days of Filing | 7,492 | 85.2% | 85.6% | 80% (Fiscal Year '00) |
| Decisions within 150 Days of Filing | 7,492 | 93.4% | 96.3% | 95% (Fiscal Year '00) |
| Combined Wage Program Timeliness | ||||
| Wage Transfers Made within 3 Days | 10,820 | 0.2% | 69.8% | none |
| Wage Transfers Made within 14 Days | 10,820 | 96.3% | 97.3% | none |
| Billing Made within 45 Days | 208 | 100.0% | 92.6% | none |
| Reimbursements Made within 45 Days | 201 | 100.0% | 96.4% | none |
| Continued Claims Payment Timeliness | ||||
| Payments Made within 7 Days | 7,737,990 | 44.8% | 61.4% | none |
| Payments Made within 14 Days | 7,737,990 | 91.1% | 92.5% | none |
| Payments Made within 21 Days | 7,737,990 | 95.5% | 96.3% | none |
| Benefit Quality Measures | ||||
| Nonmon. Determin. with Scores > 80% | 329 | 52.6% | 70.9% | 75% (Fiscal Year '02) |
| LA Appeals with Scores >= 85% | 141 | 87.7% | 90.5% | 80% (Fiscal Year '00) |
| Benefit Payment Control | ||||
| Fraud Overpayment Recovery Rate | 27,408,878 | 53.9% | 50.9% | none |
| Nonfraud Overpayment Recovery Rate | 13,943,377 | 64.0% | 56.1% | none |
| New York | ||||
| REPORTED MEASURE | STATE RESULTS | NATIONAL RESULTS | CRITERION | |
|---|---|---|---|---|
| Cash Management | ||||
| Average time (days) funds are on deposit before being transferred to Trust Fund | 1.8 | 2.1 days | <= 2 (Fiscal Year '00) | |
| Ratio of avg daily loanable balance in Clearing Account to avg daily transfer to Tust Fund | 1.06 | 1.70 | <= 1.75 (Fiscal Year '02) | |
| Benefit Accuracy Measurement | ||||
| Total Dollars Paid in Population | $1,592,763,127 | $18.8 B | none | |
| Sample Size | 492 | 26,353 | none | |
| Proper Payment Rate | 95.4 +/- 2 | 91.5% | none | |
| Overpayment Rate | 4.6 +/- 2 | 8.5% | none | |
| Underpayment Rate | 2 +/- 0.6 | 0.9% | none | |
| Footnotes: | none | |||

| New York | ||||
| REPORTED MEASURE | STATE RESULTS | NATIONAL RESULTS | ||
|---|---|---|---|---|
| Status Determinations | ||||
| New Employer Determinations: | ||||
| Percentage Made Within 90 Days (Fiscal Year '00 criterion: 60%) | 88.5% | 78.0% | ||
| Percentage Made Within 180 Days (Fiscal Year '00 criterion: 80%) | 94.4% | 89.7% | ||
| Accuracy In Determinations? (Fiscal Year '02 criterion: <= 6 failed) | P | 45.8% Pass | ||
| Accuracy In Postings? | P | 39.6% Pass | ||
| Successor Determinations: | ||||
| Percentage Made Within 90 Days | 76.7% | 67.0% | ||
| Percentage Made Within 180 Days | 88.9% | 81.5% | ||
| Accuracy In Determinations? | P | 54.2% Pass | ||
| Accuracy In Postings? | P | 45.8% Pass | ||
| Inactivations: | ||||
| Accuracy In Determinations? | P | 64.4% Pass | ||
| Accuracy In Postings? | P | 64.6% Pass | ||
| Report Delinquency | ||||
| Reports From Contributory Employers: | ||||
| Percentage Filed Timely | 92.5% | 87.4% | ||
| Percentage Secured | 97.4% | 92.5% | ||
| Percentage Resolved | 99.0% | 97.1% | ||
| Reports From Reimbursing Employers: | ||||
| Percentage Filed Timely | 68.9% | 79.8% | ||
| Percentage Secured | 79.4% | 85.9% | ||
| Percentage Resolved | 81.1% | 87.5% | ||
| Appropriate Actions Taken To Resolve Delinquencies? | P | 76.6% Pass | ||
| Collections | ||||
| Collections From Contributory Employers: | ||||
| Percentage Of Tax Due Paid Timely | 81.5% | 92.0% | ||
| Turnover Ratio - Ratio Of Receivables Liquidated Or Declared Uncollectible/Doubtful To Tax Due | 19.2% | 8.1% | ||
| Percentage of Tax Due Declared Uncollectible/Doubtful | 2.4% | 1.3% | ||
| Accounts Receivable As A Percentage Of Tax Due | 3.2% | 2.2% | ||
| Collections From Reimbursing Employers: | ||||
| Percentage Of Tax Due Paid Timely | 96.7% | 80.6% | ||
| Turnover Ratio - Ratio Of Receivables Liquidated Or Declared Uncollectible/Doubtful To Tax Due | 2.6% | 19.4% | ||
| Percentage of Tax Due Declared Uncollectible/Doubtful | 0.2% | 1.2% | ||
| Accounts Receivable As A Percentage Of Tax Due | 2.0% | 4.6% | ||
| Appropriate Actions Taken To Collect Tax Due? | P | 48.9% Pass | ||
| Cashiering | ||||
| Remittances Deposited Within Three Days? | P | 92.0% Pass | ||
| Field Audit | ||||
| Percent Change In Total Wages Resulting From Audits | 6.7% | 5.0% | ||
| Percentage Of Contributory Employers Audited | 2.5% | 2.0% | ||
| Annualized Percentage Of Total Wages Audited | 4.6% | 1.8% | ||
| Audits Meet Employment Security Manual Requirements? | P | 64.6% Pass | ||
| Account Maintenance | ||||
| Accuracy In Report Processing? | P | 96.0% Pass | ||
| Accuracy In Contributory Employer Billing? | P | 84.8% Pass | ||
| Accuracy In Reimbursing Employer Billings? | P | 85.7% Pass | ||
| Accuracy In Credits/Refunds? | P | 73.9% Pass | ||
| Accuracy In Benefit Charging? | P | 89.6% Pass | ||
| Accuracy In Experience Rating? | P | 87.8% Pass | ||
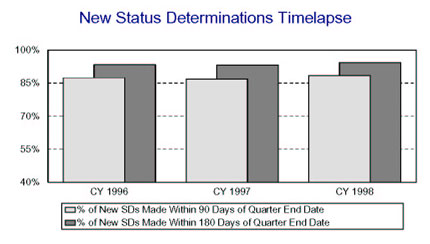
| North Carolina | ||||
| REPORTED MEASURE | WORKLOAD | STATE RESULTS |
NATIONAL RESULTS |
CRITERION |
|---|---|---|---|---|
| First Payment Timeliness | ||||
| Intrastate UI, full weeks - 14/21 Days | 148,573 | 89.0% | 90.1% | 87% |
| Intrastate UI, full weeks - 35 Days | 148,573 | 96.8% | 97.2% | 93% |
| Interstate UI, full weeks - 14/21 Days | 3,856 | 72.8% | 78.4% | 70% |
| Interstate UI, full weeks - 35 Days | 3,856 | 89.5% | 92.4% | 78% |
| All First Payments - 14/21 Days | 224,726 | 87.9% | 89.2% | 90% (Fiscal Year '02) |
| All First Payments - 35 Days | 224,726 | 96.9% | 97.0% | 95% (Fiscal Year '02) |
| Nonmonetary Determinations Timeliness: Detection Date to Determination Date |
||||
| Nonseparation Determ. within 14 Days | 80,019 | 57.4% | 68.6% | 80% (Fiscal Year '02) |
| Separation Determ. within 21 Days | 94,282 | 35.0% | 73.3% | 80% (Fiscal Year '02) |
| Nonmonetary Issue Detection Timeliness: First Week Affected to Detection Date |
||||
| Nonseparation Issues within 14 Days | 80,019 | 69.1% | 63.1% | none |
| Separation Issues within 21 Days | 94,282 | 99.1% | 90.7% | none |
| Lower Authority Appeals Timeliness | ||||
| Decisions within 30 Days of Filing | 26,981 | 73.9% | 67.9% | 60% |
| Decisions within 45 Days of Filing | 26,981 | 90.0% | 85.4% | 80% |
| Decisions within 90 Days of Filing | 26,981 | 98.8% | 95.5% | 95% (Fiscal Year '02) |
| Higher Authority Appeals Timeliness | ||||
| Decisions within 45 Days of Filing | 4,966 | 87.8% | 62.7% | 50% (Fiscal Year '00) |
| Decisions within 75 Days of Filing | 4,966 | 96.7% | 85.6% | 80% (Fiscal Year '00) |
| Decisions within 150 Days of Filing | 4,966 | 99.6% | 96.3% | 95% (Fiscal Year '00) |
| Combined Wage Program Timeliness | ||||
| Wage Transfers Made within 3 Days | 12,519 | 93.2% | 69.8% | none |
| Wage Transfers Made within 14 Days | 12,519 | 98.1% | 97.3% | none |
| Billing Made within 45 Days | 207 | 100.0% | 92.6% | none |
| Reimbursements Made within 45 Days | 198 | 99.5% | 96.4% | none |
| Continued Claims Payment Timeliness | ||||
| Payments Made within 7 Days | 1,887,890 | 89.3% | 61.4% | none |
| Payments Made within 14 Days | 1,887,890 | 96.3% | 92.5% | none |
| Payments Made within 21 Days | 1,887,890 | 97.9% | 96.3% | none |
| Benefit Quality Measures | ||||
| Nonmon. Determin. with Scores > 80% | 280 | 34.1% | 70.9% | 75% (Fiscal Year '02) |
| LA Appeals with Scores >= 85% | 79 | 100.0% | 90.5% | 80% (Fiscal Year '00) |
| Benefit Payment Control | ||||
| Fraud Overpayment Recovery Rate | 4,091,502 | 53.9% | 50.9% | none |
| Nonfraud Overpayment Recovery Rate | 5,844,124 | 64.0% | 56.1% | none |
| North Carolina | ||||
| REPORTED MEASURE | STATE RESULTS | NATIONAL RESULTS | CRITERION | |
|---|---|---|---|---|
| Cash Management | ||||
| Average time (days) funds are on deposit before being transferred to Trust Fund | 2.0 | 2.1 days | <= 2 (Fiscal Year '00) | |
| Ratio of avg daily loanable balance in Clearing Account to avg daily transfer to Tust Fund | 0.67 | 1.70 | <= 1.75 (Fiscal Year '02) | |
| Benefit Accuracy Measurement | ||||
| Total Dollars Paid in Population | $391,673,341 | $18.8 B | none | |
| Sample Size | 768 | 26,353 | none | |
| Proper Payment Rate | 90.2 +/- 2.2 | 91.5% | none | |
| Overpayment Rate | 9.8 +/- 2.2 | 8.5% | none | |
| Underpayment Rate | 0.7 +/- 0.3 | 0.9% | none | |
| Footnotes: | none | |||
| North Carolina | ||||
| REPORTED MEASURE | STATE RESULTS | NATIONAL RESULTS | ||
|---|---|---|---|---|
| Status Determinations | ||||
| New Employer Determinations: | ||||
| Percentage Made Within 90 Days (Fiscal Year '00 criterion: 60%) | 77.1% | 78.0% | ||
| Percentage Made Within 180 Days (Fiscal Year '00 criterion: 80%) | 89.7% | 89.7% | ||
| Accuracy In Determinations? (Fiscal Year '02 criterion: <= 6 failed) | P | 45.8% Pass | ||
| Accuracy In Postings? | P | 39.6% Pass | ||
| Successor Determinations: | ||||
| Percentage Made Within 90 Days | 63.7% | 67.0% | ||
| Percentage Made Within 180 Days | 80.8% | 81.5% | ||
| Accuracy In Determinations? | P | 54.2% Pass | ||
| Accuracy In Postings? | P | 45.8% Pass | ||
| Inactivations: | ||||
| Accuracy In Determinations? | F | 64.4% Pass | ||
| Accuracy In Postings? | P | 64.6% Pass | ||
| Report Delinquency | ||||
| Reports From Contributory Employers: | ||||
| Percentage Filed Timely | 90.5% | 87.4% | ||
| Percentage Secured | 98.0% | 92.5% | ||
| Percentage Resolved | 102.5% | 97.1% | ||
| Reports From Reimbursing Employers: | ||||
| Percentage Filed Timely | 94.7% | 79.8% | ||
| Percentage Secured | 98.9% | 85.9% | ||
| Percentage Resolved | 99.5% | 87.5% | ||
| Appropriate Actions Taken To Resolve Delinquencies? | P | 76.6% Pass | ||
| Collections | ||||
| Collections From Contributory Employers: | ||||
| Percentage Of Tax Due Paid Timely | 94.5% | 92.0% | ||
| Turnover Ratio - Ratio Of Receivables Liquidated Or Declared Uncollectible/Doubtful To Tax Due | 5.0% | 8.1% | ||
| Percentage of Tax Due Declared Uncollectible/Doubtful | 0.2% | 1.3% | ||
| Accounts Receivable As A Percentage Of Tax Due | 1.0% | 2.2% | ||
| Collections From Reimbursing Employers: | ||||
| Percentage Of Tax Due Paid Timely | 85.4% | 80.6% | ||
| Turnover Ratio - Ratio Of Receivables Liquidated Or Declared Uncollectible/Doubtful To Tax Due | 15.0% | 19.4% | ||
| Percentage of Tax Due Declared Uncollectible/Doubtful | 0.1% | 1.2% | ||
| Accounts Receivable As A Percentage Of Tax Due | 0.1% | 4.6% | ||
| Appropriate Actions Taken To Collect Tax Due? | P | 48.9% Pass | ||
| Cashiering | ||||
| Remittances Deposited Within Three Days? | P | 92.0% Pass | ||
| Field Audit | ||||
| Percent Change In Total Wages Resulting From Audits | 3.8% | 5.0% | ||
| Percentage Of Contributory Employers Audited | 2.1% | 2.0% | ||
| Annualized Percentage Of Total Wages Audited | 0.5% | 1.8% | ||
| Audits Meet Employment Security Manual Requirements? | P | 64.6% Pass | ||
| Account Maintenance | ||||
| Accuracy In Report Processing? | P | 96.0% Pass | ||
| Accuracy In Contributory Employer Billing? | P | 84.8% Pass | ||
| Accuracy In Reimbursing Employer Billings? | P | 85.7% Pass | ||
| Accuracy In Credits/Refunds? | P | 73.9% Pass | ||
| Accuracy In Benefit Charging? | P | 89.6% Pass | ||
| Accuracy In Experience Rating? | P | 87.8% Pass | ||

| North Dakota | ||||
| REPORTED MEASURE | WORKLOAD | STATE RESULTS |
NATIONAL RESULTS |
CRITERION |
|---|---|---|---|---|
| First Payment Timeliness | ||||
| Intrastate UI, full weeks - 14/21 Days | 10,922 | 97.2% | 90.1% | 87% |
| Intrastate UI, full weeks - 35 Days | 10,922 | 99.6% | 97.2% | 93% |
| Interstate UI, full weeks - 14/21 Days | 628 | 84.2% | 78.4% | 70% |
| Interstate UI, full weeks - 35 Days | 628 | 96.5% | 92.4% | 78% |
| All First Payments - 14/21 Days | 12,572 | 87.8% | 89.2% | 90% (Fiscal Year '02) |
| All First Payments - 35 Days | 12,572 | 96.9% | 97.0% | 95% (Fiscal Year '02) |
| Nonmonetary Determinations Timeliness: Detection Date to Determination Date |
||||
| Nonseparation Determ. within 14 Days | 6,678 | 87.8% | 68.6% | 80% (Fiscal Year '02) |
| Separation Determ. within 21 Days | 5,303 | 45.2% | 73.3% | 80% (Fiscal Year '02) |
| Nonmonetary Issue Detection Timeliness: First Week Affected to Detection Date |
||||
| Nonseparation Issues within 14 Days | 6,678 | 87.4% | 63.1% | none |
| Separation Issues within 21 Days | 5,303 | 93.7% | 90.7% | none |
| Lower Authority Appeals Timeliness | ||||
| Decisions within 30 Days of Filing | 1,384 | 87.8% | 67.9% | 60% |
| Decisions within 45 Days of Filing | 1,384 | 96.0% | 85.4% | 80% |
| Decisions within 90 Days of Filing | 1,384 | 99.3% | 95.5% | 95% (Fiscal Year '02) |
| Higher Authority Appeals Timeliness | ||||
| Decisions within 45 Days of Filing | 296 | 96.6% | 62.7% | 50% (Fiscal Year '00) |
| Decisions within 75 Days of Filing | 296 | 99.3% | 85.6% | 80% (Fiscal Year '00) |
| Decisions within 150 Days of Filing | 296 | 99.3% | 96.3% | 95% (Fiscal Year '00) |
| Combined Wage Program Timeliness | ||||
| Wage Transfers Made within 3 Days | 4,111 | 98.4% | 69.8% | none |
| Wage Transfers Made within 14 Days | 4,111 | 100.0% | 97.3% | none |
| Billing Made within 45 Days | 152 | 100.0% | 92.6% | none |
| Reimbursements Made within 45 Days | 176 | 98.9% | 96.4% | none |
| Continued Claims Payment Timeliness | ||||
| Payments Made within 7 Days | 156,266 | 79.9% | 61.4% | none |
| Payments Made within 14 Days | 156,266 | 95.7% | 92.5% | none |
| Payments Made within 21 Days | 156,266 | 98.2% | 96.3% | none |
| Benefit Quality Measures | ||||
| Nonmon. Determin. with Scores > 80% | 233 | 61.1% | 70.9% | 75% (Fiscal Year '02) |
| LA Appeals with Scores >= 85% | 75 | 88.6% | 90.5% | 80% (Fiscal Year '00) |
| Benefit Payment Control | ||||
| Fraud Overpayment Recovery Rate | 103,424 | 42.0% | 50.9% | none |
| Nonfraud Overpayment Recovery Rate | 523,180 | 86.1% | 56.1% | none |
| North Dakota | ||||
| REPORTED MEASURE | STATE RESULTS | NATIONAL RESULTS | CRITERION | |
|---|---|---|---|---|
| Cash Management | ||||
| Average time (days) funds are on deposit before being transferred to Trust Fund | 1.1 | 2.1 days | <= 2 (Fiscal Year '00) | |
| Ratio of avg daily loanable balance in Clearing Account to avg daily transfer to Tust Fund | 1.06 | 1.70 | <= 1.75 (Fiscal Year '02) | |
| Benefit Accuracy Measurement | ||||
| Total Dollars Paid in Population | $27,951,262 | $18.8 B | none | |
| Sample Size | 364 | 26,353 | none | |
| Proper Payment Rate | 97.7 +/- 1.6 | 91.5% | none | |
| Overpayment Rate | 2.3 +/- 1.6 | 8.5% | none | |
| Underpayment Rate | 0.2 +/- 0.2 | 0.9% | none | |
| Footnotes: | none | |||
| North Dakota | ||||
| REPORTED MEASURE | STATE RESULTS | NATIONAL RESULTS | ||
|---|---|---|---|---|
| Status Determinations | ||||
| New Employer Determinations: | ||||
| Percentage Made Within 90 Days (Fiscal Year '00 criterion: 60%) | 76.9% | 78.0% | ||
| Percentage Made Within 180 Days (Fiscal Year '00 criterion: 80%) | 88.9% | 89.7% | ||
| Accuracy In Determinations? (Fiscal Year '02 criterion: <= 6 failed) | F | 45.8% Pass | ||
| Accuracy In Postings? | F | 39.6% Pass | ||
| Successor Determinations: | ||||
| Percentage Made Within 90 Days | 85.3% | 67.0% | ||
| Percentage Made Within 180 Days | 95.6% | 81.5% | ||
| Accuracy In Determinations? | F | 54.2% Pass | ||
| Accuracy In Postings? | F | 45.8% Pass | ||
| Inactivations: | ||||
| Accuracy In Determinations? | P | 64.4% Pass | ||
| Accuracy In Postings? | P | 64.6% Pass | ||
| Report Delinquency | ||||
| Reports From Contributory Employers: | ||||
| Percentage Filed Timely | 98.3% | 87.4% | ||
| Percentage Secured | 104.3% | 92.5% | ||
| Percentage Resolved | 105.7% | 97.1% | ||
| Reports From Reimbursing Employers: | ||||
| Percentage Filed Timely | 97.5% | 79.8% | ||
| Percentage Secured | 100.8% | 85.9% | ||
| Percentage Resolved | 100.9% | 87.5% | ||
| Appropriate Actions Taken To Resolve Delinquencies? | P | 76.6% Pass | ||
| Collections | ||||
| Collections From Contributory Employers: | ||||
| Percentage Of Tax Due Paid Timely | 95.4% | 92.0% | ||
| Turnover Ratio - Ratio Of Receivables Liquidated Or Declared Uncollectible/Doubtful To Tax Due | 4.0% | 8.1% | ||
| Percentage of Tax Due Declared Uncollectible/Doubtful | 0.3% | 1.3% | ||
| Accounts Receivable As A Percentage Of Tax Due | 1.3% | 2.2% | ||
| Collections From Reimbursing Employers: | ||||
| Percentage Of Tax Due Paid Timely | 97.1% | 80.6% | ||
| Turnover Ratio - Ratio Of Receivables Liquidated Or Declared Uncollectible/Doubtful To Tax Due | 3.1% | 19.4% | ||
| Percentage of Tax Due Declared Uncollectible/Doubtful | 0.1% | 1.2% | ||
| Accounts Receivable As A Percentage Of Tax Due | 2.0% | 4.6% | ||
| Appropriate Actions Taken To Collect Tax Due? | P | 48.9% Pass | ||
| Cashiering | ||||
| Remittances Deposited Within Three Days? | P | 92.0% Pass | ||
| Field Audit | ||||
| Percent Change In Total Wages Resulting From Audits | 0.7% | 5.0% | ||
| Percentage Of Contributory Employers Audited | 2.8% | 2.0% | ||
| Annualized Percentage Of Total Wages Audited | 2.7% | 1.8% | ||
| Audits Meet Employment Security Manual Requirements? | P | 64.6% Pass | ||
| Account Maintenance | ||||
| Accuracy In Report Processing? | P | 96.0% Pass | ||
| Accuracy In Contributory Employer Billing? | P | 84.8% Pass | ||
| Accuracy In Reimbursing Employer Billings? | P | 85.7% Pass | ||
| Accuracy In Credits/Refunds? | F | 73.9% Pass | ||
| Accuracy In Benefit Charging? | F | 89.6% Pass | ||
| Accuracy In Experience Rating? | P | 87.8% Pass | ||
| Ohio | ||||
| REPORTED MEASURE | WORKLOAD | STATE RESULTS |
NATIONAL RESULTS |
CRITERION |
|---|---|---|---|---|
| First Payment Timeliness | ||||
| Intrastate UI, full weeks - 14/21 Days | 220,042 | 86.3% | 90.1% | 87% |
| Intrastate UI, full weeks - 35 Days | 220,042 | 93.5% | 97.2% | 93% |
| Interstate UI, full weeks - 14/21 Days | 5,569 | 80.0% | 78.4% | 70% |
| Interstate UI, full weeks - 35 Days | 5,569 | 94.5% | 92.4% | 78% |
| All First Payments - 14/21 Days | 246,435 | 86.1% | 89.2% | 90% (Fiscal Year '02) |
| All First Payments - 35 Days | 246,435 | 93.8% | 97.0% | 95% (Fiscal Year '02) |
| Nonmonetary Determinations Timeliness: Detection Date to Determination Date |
||||
| Nonseparation Determ. within 14 Days | 110,138 | 54.9% | 68.6% | 80% (Fiscal Year '02) |
| Separation Determ. within 21 Days | 79,805 | 42.4% | 73.3% | 80% (Fiscal Year '02) |
| Nonmonetary Issue Detection Timeliness: First Week Affected to Detection Date |
||||
| Nonseparation Issues within 14 Days | 110,138 | 68.9% | 63.1% | none |
| Separation Issues within 21 Days | 79,805 | 96.9% | 90.7% | none |
| Lower Authority Appeals Timeliness | ||||
| Decisions within 30 Days of Filing | 12,757 | 54.0% | 67.9% | 60% |
| Decisions within 45 Days of Filing | 12,757 | 67.1% | 85.4% | 80% |
| Decisions within 90 Days of Filing | 12,757 | 88.8% | 95.5% | 95% (Fiscal Year '02) |
| Higher Authority Appeals Timeliness | ||||
| Decisions within 45 Days of Filing | 3,058 | 79.4% | 62.7% | 50% (Fiscal Year '00) |
| Decisions within 75 Days of Filing | 3,058 | 67.1% | 85.6% | 80% (Fiscal Year '00) |
| Decisions within 150 Days of Filing | 3,058 | 95.7% | 96.3% | 95% (Fiscal Year '00) |
| Combined Wage Program Timeliness | ||||
| Wage Transfers Made within 3 Days | 14,141 | 0.0% | 69.8% | none |
| Wage Transfers Made within 14 Days | 14,141 | 99.7% | 97.3% | none |
| Billing Made within 45 Days | 205 | 100.0% | 92.6% | none |
| Reimbursements Made within 45 Days | 192 | 99.5% | 96.4% | none |
| Continued Claims Payment Timeliness | ||||
| Payments Made within 7 Days | 2,774,053 | 45.5% | 61.4% | none |
| Payments Made within 14 Days | 2,774,053 | 92.3% | 92.5% | none |
| Payments Made within 21 Days | 2,774,053 | 96.5% | 96.3% | none |
| Benefit Quality Measures | ||||
| Nonmon. Determin. with Scores > 80% | 367 | 64.8% | 70.9% | 75% (Fiscal Year '02) |
| LA Appeals with Scores >= 85% | 75 | 87.5% | 90.5% | 80% (Fiscal Year '00) |
| Benefit Payment Control | ||||
| Fraud Overpayment Recovery Rate | 7,649,983 | 42.0% | 50.9% | none |
| Nonfraud Overpayment Recovery Rate | 13,070,985 | 86.1% | 56.1% | none |
| Ohio | ||||
| REPORTED MEASURE | STATE RESULTS | NATIONAL RESULTS | CRITERION | |
|---|---|---|---|---|
| Cash Management | ||||
| Average time (days) funds are on deposit before being transferred to Trust Fund | 1.8 | 2.1 days | <= 2 (Fiscal Year '00) | |
| Ratio of avg daily loanable balance in Clearing Account to avg daily transfer to Tust Fund | 1.34 | 1.70 | <= 1.75 (Fiscal Year '02) | |
| Benefit Accuracy Measurement | ||||
| Total Dollars Paid in Population | $637,280,212 | $18.8 B | none | |
| Sample Size | 485 | 26,353 | none | |
| Proper Payment Rate | 82.5 +/- 3.5 | 91.5% | none | |
| Overpayment Rate | 17.5 +/- 3.5 | 8.5% | none | |
| Underpayment Rate | 1 +/- 0.3 | 0.9% | none | |
| Footnotes: | none | |||
| Ohio | ||||
| REPORTED MEASURE | STATE RESULTS | NATIONAL RESULTS | ||
|---|---|---|---|---|
| Status Determinations | ||||
| New Employer Determinations: | ||||
| Percentage Made Within 90 Days (Fiscal Year '00 criterion: 60%) | 87.4% | 78.0% | ||
| Percentage Made Within 180 Days (Fiscal Year '00 criterion: 80%) | 93.1% | 89.7% | ||
| Accuracy In Determinations? (Fiscal Year '02 criterion: <= 6 failed) | P | 45.8% Pass | ||
| Accuracy In Postings? | P | 39.6% Pass | ||
| Successor Determinations: | ||||
| Percentage Made Within 90 Days | 58.2% | 67.0% | ||
| Percentage Made Within 180 Days | 75.1% | 81.5% | ||
| Accuracy In Determinations? | P | 54.2% Pass | ||
| Accuracy In Postings? | P | 45.8% Pass | ||
| Inactivations: | ||||
| Accuracy In Determinations? | P | 64.4% Pass | ||
| Accuracy In Postings? | P | 64.6% Pass | ||
| Report Delinquency | ||||
| Reports From Contributory Employers: | ||||
| Percentage Filed Timely | 91.8% | 87.4% | ||
| Percentage Secured | 96.8% | 92.5% | ||
| Percentage Resolved | 98.2% | 97.1% | ||
| Reports From Reimbursing Employers: | ||||
| Percentage Filed Timely | 90.2% | 79.8% | ||
| Percentage Secured | 92.9% | 85.9% | ||
| Percentage Resolved | 93.8% | 87.5% | ||
| Appropriate Actions Taken To Resolve Delinquencies? | P | 76.6% Pass | ||
| Collections | ||||
| Collections From Contributory Employers: | ||||
| Percentage Of Tax Due Paid Timely | 95.6% | 92.0% | ||
| Turnover Ratio - Ratio Of Receivables Liquidated Or Declared Uncollectible/Doubtful To Tax Due | 5.3% | 8.1% | ||
| Percentage of Tax Due Declared Uncollectible/Doubtful | 0.2% | 1.3% | ||
| Accounts Receivable As A Percentage Of Tax Due | 2.2% | 2.2% | ||
| Collections From Reimbursing Employers: | ||||
| Percentage Of Tax Due Paid Timely | 102.5% | 80.6% | ||
| Turnover Ratio - Ratio Of Receivables Liquidated Or Declared Uncollectible/Doubtful To Tax Due | 102.8% | 19.4% | ||
| Percentage of Tax Due Declared Uncollectible/Doubtful | 0.0% | 1.2% | ||
| Accounts Receivable As A Percentage Of Tax Due | 13.6% | 4.6% | ||
| Appropriate Actions Taken To Collect Tax Due? | P | 48.9% Pass | ||
| Cashiering | ||||
| Remittances Deposited Within Three Days? | P | 92.0% Pass | ||
| Field Audit | ||||
| Percent Change In Total Wages Resulting From Audits | 2.1% | 5.0% | ||
| Percentage Of Contributory Employers Audited | 3.5% | 2.0% | ||
| Annualized Percentage Of Total Wages Audited | 1.8% | 1.8% | ||
| Audits Meet Employment Security Manual Requirements? | P | 64.6% Pass | ||
| Account Maintenance | ||||
| Accuracy In Report Processing? | P | 96.0% Pass | ||
| Accuracy In Contributory Employer Billing? | P | 84.8% Pass | ||
| Accuracy In Reimbursing Employer Billings? | P | 85.7% Pass | ||
| Accuracy In Credits/Refunds? | P | 73.9% Pass | ||
| Accuracy In Benefit Charging? | P | 89.6% Pass | ||
| Accuracy In Experience Rating? | P | 87.8% Pass | ||

| Oklahoma | ||||
| REPORTED MEASURE | WORKLOAD | STATE RESULTS |
NATIONAL RESULTS |
CRITERION |
|---|---|---|---|---|
| First Payment Timeliness | ||||
| Intrastate UI, full weeks - 14/21 Days | 37,756 | 93.8% | 90.1% | 87% |
| Intrastate UI, full weeks - 35 Days | 37,756 | 98.0% | 97.2% | 93% |
| Interstate UI, full weeks - 14/21 Days | 986 | 76.3% | 78.4% | 70% |
| Interstate UI, full weeks - 35 Days | 986 | 92.0% | 92.4% | 78% |
| All First Payments - 14/21 Days | 43,433 | 92.8% | 89.2% | 90% (Fiscal Year '02) |
| All First Payments - 35 Days | 43,433 | 97.9% | 97.0% | 95% (Fiscal Year '02) |
| Nonmonetary Determinations Timeliness: Detection Date to Determination Date |
||||
| Nonseparation Determ. within 14 Days | 18,881 | 86.8% | 68.6% | 80% (Fiscal Year '02) |
| Separation Determ. within 21 Days | 29,009 | 86.2% | 73.3% | 80% (Fiscal Year '02) |
| Nonmonetary Issue Detection Timeliness: First Week Affected to Detection Date |
||||
| Nonseparation Issues within 14 Days | 18,881 | 68.9% | 63.1% | none |
| Separation Issues within 21 Days | 29,009 | 98.0% | 90.7% | none |
| Lower Authority Appeals Timeliness | ||||
| Decisions within 30 Days of Filing | 6,831 | 95.8% | 67.9% | 60% |
| Decisions within 45 Days of Filing | 6,831 | 99.1% | 85.4% | 80% |
| Decisions within 90 Days of Filing | 6,831 | 99.9% | 95.5% | 95% (Fiscal Year '02) |
| Higher Authority Appeals Timeliness | ||||
| Decisions within 45 Days of Filing | 1,371 | 90.2% | 62.7% | 50% (Fiscal Year '00) |
| Decisions within 75 Days of Filing | 1,371 | 97.7% | 85.6% | 80% (Fiscal Year '00) |
| Decisions within 150 Days of Filing | 1,371 | 99.3% | 96.3% | 95% (Fiscal Year '00) |
| Combined Wage Program Timeliness | ||||
| Wage Transfers Made within 3 Days | 5,068 | 96.3% | 69.8% | none |
| Wage Transfers Made within 14 Days | 5,068 | 100.0% | 97.3% | none |
| Billing Made within 45 Days | 198 | 100.0% | 92.6% | none |
| Reimbursements Made within 45 Days | 182 | 96.7% | 96.4% | none |
| Continued Claims Payment Timeliness | ||||
| Payments Made within 7 Days | 507,555 | 94.4% | 61.4% | none |
| Payments Made within 14 Days | 507,555 | 98.1% | 92.5% | none |
| Payments Made within 21 Days | 507,555 | 99.0% | 96.3% | none |
| Benefit Quality Measures | ||||
| Nonmon. Determin. with Scores > 80% | 226 | 81.0% | 70.9% | 75% (Fiscal Year '02) |
| LA Appeals with Scores >= 85% | 80 | 91.3% | 90.5% | 80% (Fiscal Year '00) |
| Benefit Payment Control | ||||
| Fraud Overpayment Recovery Rate | 654,958 | 42.0% | 50.9% | none |
| Nonfraud Overpayment Recovery Rate | 1,955,556 | 86.1% | 56.1% | none |
| Oklahoma | ||||
| REPORTED MEASURE | STATE RESULTS | NATIONAL RESULTS | CRITERION | |
|---|---|---|---|---|
| Cash Management | ||||
| Average time (days) funds are on deposit before being transferred to Trust Fund | 0.5 | 2.1 days | <= 2 (Fiscal Year '00) | |
| Ratio of avg daily loanable balance in Clearing Account to avg daily transfer to Tust Fund | 1.02 | 1.70 | <= 1.75 (Fiscal Year '02) | |
| Benefit Accuracy Measurement | ||||
| Total Dollars Paid in Population | $94,784,979 | $18.8 B | none | |
| Sample Size | 480 | 26,353 | none | |
| Proper Payment Rate | 96.2 +/- 1.7 | 91.5% | none | |
| Overpayment Rate | 3.8 +/- 1.7 | 8.5% | none | |
| Underpayment Rate | 0.3 +/- 0.2 | 0.9% | none | |
| Footnotes: | none | |||
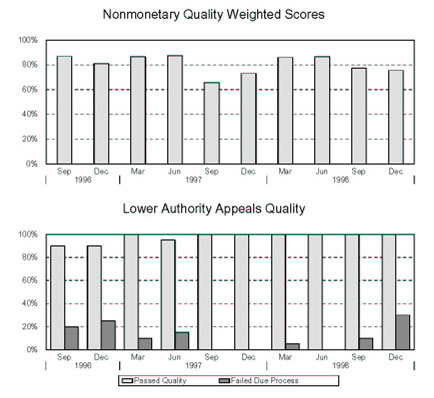
| Oklahoma | ||||
| REPORTED MEASURE | STATE RESULTS | NATIONAL RESULTS | ||
|---|---|---|---|---|
| Status Determinations | ||||
| New Employer Determinations: | ||||
| Percentage Made Within 90 Days (Fiscal Year '00 criterion: 60%) | 75.2% | 78.0% | ||
| Percentage Made Within 180 Days (Fiscal Year '00 criterion: 80%) | 87.3% | 89.7% | ||
| Accuracy In Determinations? (Fiscal Year '02 criterion: <= 6 failed) | F | 45.8% Pass | ||
| Accuracy In Postings? | F | 39.6% Pass | ||
| Successor Determinations: | ||||
| Percentage Made Within 90 Days | 62.6% | 67.0% | ||
| Percentage Made Within 180 Days | 84.6% | 81.5% | ||
| Accuracy In Determinations? | P | 54.2% Pass | ||
| Accuracy In Postings? | P | 45.8% Pass | ||
| Inactivations: | ||||
| Accuracy In Determinations? | P | 64.4% Pass | ||
| Accuracy In Postings? | P | 64.6% Pass | ||
| Report Delinquency | ||||
| Reports From Contributory Employers: | ||||
| Percentage Filed Timely | 90.0% | 87.4% | ||
| Percentage Secured | 98.5% | 92.5% | ||
| Percentage Resolved | 103.2% | 97.1% | ||
| Reports From Reimbursing Employers: | ||||
| Percentage Filed Timely | 97.7% | 79.8% | ||
| Percentage Secured | 99.4% | 85.9% | ||
| Percentage Resolved | 101.9% | 87.5% | ||
| Appropriate Actions Taken To Resolve Delinquencies? | P | 76.6% Pass | ||
| Collections | ||||
| Collections From Contributory Employers: | ||||
| Percentage Of Tax Due Paid Timely | 85.5% | 92.0% | ||
| Turnover Ratio - Ratio Of Receivables Liquidated Or Declared Uncollectible/Doubtful To Tax Due | 15.9% | 8.1% | ||
| Percentage of Tax Due Declared Uncollectible/Doubtful | 5.7% | 1.3% | ||
| Accounts Receivable As A Percentage Of Tax Due | 2.0% | 2.2% | ||
| Collections From Reimbursing Employers: | ||||
| Percentage Of Tax Due Paid Timely | 86.5% | 80.6% | ||
| Turnover Ratio - Ratio Of Receivables Liquidated Or Declared Uncollectible/Doubtful To Tax Due | 13.0% | 19.4% | ||
| Percentage of Tax Due Declared Uncollectible/Doubtful | 0.4% | 1.2% | ||
| Accounts Receivable As A Percentage Of Tax Due | 2.5% | 4.6% | ||
| Appropriate Actions Taken To Collect Tax Due? | P | 48.9% Pass | ||
| Cashiering | ||||
| Remittances Deposited Within Three Days? | P | 92.0% Pass | ||
| Field Audit | ||||
| Percent Change In Total Wages Resulting From Audits | 1.8% | 5.0% | ||
| Percentage Of Contributory Employers Audited | 2.0% | 2.0% | ||
| Annualized Percentage Of Total Wages Audited | 1.4% | 1.8% | ||
| Audits Meet Employment Security Manual Requirements? | F | 64.6% Pass | ||
| Account Maintenance | ||||
| Accuracy In Report Processing? | P | 96.0% Pass | ||
| Accuracy In Contributory Employer Billing? | P | 84.8% Pass | ||
| Accuracy In Reimbursing Employer Billings? | P | 85.7% Pass | ||
| Accuracy In Credits/Refunds? | P | 73.9% Pass | ||
| Accuracy In Benefit Charging? | P | 89.6% Pass | ||
| Accuracy In Experience Rating? | P | 87.8% Pass | ||
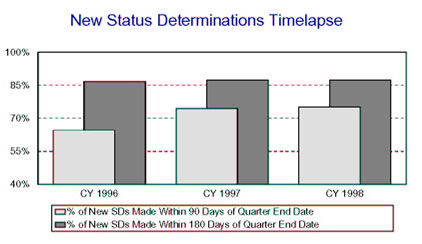
| Oregon | ||||
| REPORTED MEASURE | WORKLOAD | STATE RESULTS |
NATIONAL RESULTS |
CRITERION |
|---|---|---|---|---|
| First Payment Timeliness | ||||
| Intrastate UI, full weeks - 14/21 Days | 111,716 | 94.9% | 90.1% | 87% |
| Intrastate UI, full weeks - 35 Days | 111,716 | 98.4% | 97.2% | 93% |
| Interstate UI, full weeks - 14/21 Days | 6,069 | 88.9% | 78.4% | 70% |
| Interstate UI, full weeks - 35 Days | 6,069 | 96.6% | 92.4% | 78% |
| All First Payments - 14/21 Days | 139,207 | 94.5% | 89.2% | 90% (Fiscal Year '02) |
| All First Payments - 35 Days | 139,207 | 98.3% | 97.0% | 95% (Fiscal Year '02) |
| Nonmonetary Determinations Timeliness: Detection Date to Determination Date |
||||
| Nonseparation Determ. within 14 Days | 70,202 | 72.4% | 68.6% | 80% (Fiscal Year '02) |
| Separation Determ. within 21 Days | 74,118 | 85.5% | 73.3% | 80% (Fiscal Year '02) |
| Nonmonetary Issue Detection Timeliness: First Week Affected to Detection Date |
||||
| Nonseparation Issues within 14 Days | 70,202 | 75.1% | 63.1% | none |
| Separation Issues within 21 Days | 74,118 | 69.9% | 90.7% | none |
| Lower Authority Appeals Timeliness | ||||
| Decisions within 30 Days of Filing | 15,462 | 72.4% | 67.9% | 60% |
| Decisions within 45 Days of Filing | 15,462 | 85.6% | 85.4% | 80% |
| Decisions within 90 Days of Filing | 15,462 | 96.8% | 95.5% | 95% (Fiscal Year '02) |
| Higher Authority Appeals Timeliness | ||||
| Decisions within 45 Days of Filing | 2,497 | 90.5% | 62.7% | 50% (Fiscal Year '00) |
| Decisions within 75 Days of Filing | 2,497 | 95.7% | 85.6% | 80% (Fiscal Year '00) |
| Decisions within 150 Days of Filing | 2,497 | 99.6% | 96.3% | 95% (Fiscal Year '00) |
| Combined Wage Program Timeliness | ||||
| Wage Transfers Made within 3 Days | 16,451 | 100.0% | 69.8% | none |
| Wage Transfers Made within 14 Days | 16,451 | 100.0% | 97.3% | none |
| Billing Made within 45 Days | 0 | 0.0% | 92.6% | none |
| Reimbursements Made within 45 Days | 0 | 0.0% | 96.4% | none |
| Continued Claims Payment Timeliness | ||||
| Payments Made within 7 Days | 1,834,381 | 95.6% | 61.4% | none |
| Payments Made within 14 Days | 1,834,381 | 98.3% | 92.5% | none |
| Payments Made within 21 Days | 1,834,381 | 99.0% | 96.3% | none |
| Benefit Quality Measures | ||||
| Nonmon. Determin. with Scores > 80% | 376 | 66.5% | 70.9% | 75% (Fiscal Year '02) |
| LA Appeals with Scores >= 85% | 78 | 95.0% | 90.5% | 80% (Fiscal Year '00) |
| Benefit Payment Control | ||||
| Fraud Overpayment Recovery Rate | 5,923,579 | 58.0% | 50.9% | none |
| Nonfraud Overpayment Recovery Rate | 4,076,019 | 37.2% | 56.1% | none |
| Oregon | ||||
| REPORTED MEASURE | STATE RESULTS | NATIONAL RESULTS | CRITERION | |
|---|---|---|---|---|
| Cash Management | ||||
| Average time (days) funds are on deposit before being transferred to Trust Fund | 2.8 | 2.1 days | <= 2 (Fiscal Year '00) | |
| Ratio of avg daily loanable balance in Clearing Account to avg daily transfer to Tust Fund | 4.16 | 1.70 | <= 1.75 (Fiscal Year '02) | |
| Benefit Accuracy Measurement | ||||
| Total Dollars Paid in Population | $386,119,791 | $18.8 B | none | |
| Sample Size | 504 | 26,353 | none | |
| Proper Payment Rate | 92.9 +/- 2.1 | 91.5% | none | |
| Overpayment Rate | 7.1 +/- 2.1 | 8.5% | none | |
| Underpayment Rate | 0.8 +/- 0.4 | 0.9% | none | |
| Footnotes: | none | |||
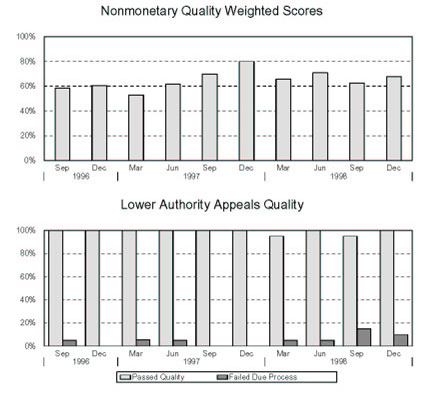
| Oregon | ||||
| REPORTED MEASURE | STATE RESULTS | NATIONAL RESULTS | ||
|---|---|---|---|---|
| Status Determinations | ||||
| New Employer Determinations: | ||||
| Percentage Made Within 90 Days (Fiscal Year '00 criterion: 60%) | 84.8% | 78.0% | ||
| Percentage Made Within 180 Days (Fiscal Year '00 criterion: 80%) | 90.6% | 89.7% | ||
| Accuracy In Determinations? (Fiscal Year '02 criterion: <= 6 failed) | F | 45.8% Pass | ||
| Accuracy In Postings? | F | 39.6% Pass | ||
| Successor Determinations: | ||||
| Percentage Made Within 90 Days | 87.6% | 67.0% | ||
| Percentage Made Within 180 Days | 93.4% | 81.5% | ||
| Accuracy In Determinations? | P | 54.2% Pass | ||
| Accuracy In Postings? | P | 45.8% Pass | ||
| Inactivations: | ||||
| Accuracy In Determinations? | F | 64.4% Pass | ||
| Accuracy In Postings? | F | 64.6% Pass | ||
| Report Delinquency | ||||
| Reports From Contributory Employers: | ||||
| Percentage Filed Timely | 89.4% | 87.4% | ||
| Percentage Secured | 94.9% | 92.5% | ||
| Percentage Resolved | 102.3% | 97.1% | ||
| Reports From Reimbursing Employers: | ||||
| Percentage Filed Timely | 88.6% | 79.8% | ||
| Percentage Secured | 92.2% | 85.9% | ||
| Percentage Resolved | 95.5% | 87.5% | ||
| Appropriate Actions Taken To Resolve Delinquencies? | P | 76.6% Pass | ||
| Collections | ||||
| Collections From Contributory Employers: | ||||
| Percentage Of Tax Due Paid Timely | 92.0% | 92.0% | ||
| Turnover Ratio - Ratio Of Receivables Liquidated Or Declared Uncollectible/Doubtful To Tax Due | 8.3% | 8.1% | ||
| Percentage of Tax Due Declared Uncollectible/Doubtful | 0.9% | 1.3% | ||
| Accounts Receivable As A Percentage Of Tax Due | 1.6% | 2.2% | ||
| Collections From Reimbursing Employers: | ||||
| Percentage Of Tax Due Paid Timely | 91.5% | 80.6% | ||
| Turnover Ratio - Ratio Of Receivables Liquidated Or Declared Uncollectible/Doubtful To Tax Due | 8.1% | 19.4% | ||
| Percentage of Tax Due Declared Uncollectible/Doubtful | 0.7% | 1.2% | ||
| Accounts Receivable As A Percentage Of Tax Due | 3.8% | 4.6% | ||
| Appropriate Actions Taken To Collect Tax Due? | F | 48.9% Pass | ||
| Cashiering | ||||
| Remittances Deposited Within Three Days? | P | 92.0% Pass | ||
| Field Audit | ||||
| Percent Change In Total Wages Resulting From Audits | 3.1% | 5.0% | ||
| Percentage Of Contributory Employers Audited | 2.1% | 2.0% | ||
| Annualized Percentage Of Total Wages Audited | 1.8% | 1.8% | ||
| Audits Meet Employment Security Manual Requirements? | F | 64.6% Pass | ||
| Account Maintenance | ||||
| Accuracy In Report Processing? | P | 96.0% Pass | ||
| Accuracy In Contributory Employer Billing? | P | 84.8% Pass | ||
| Accuracy In Reimbursing Employer Billings? | P | 85.7% Pass | ||
| Accuracy In Credits/Refunds? | P | 73.9% Pass | ||
| Accuracy In Benefit Charging? | P | 89.6% Pass | ||
| Accuracy In Experience Rating? | P | 87.8% Pass | ||
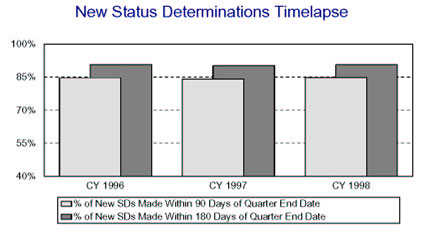
| Pennsylvania | ||||
| REPORTED MEASURE | WORKLOAD | STATE RESULTS |
NATIONAL RESULTS |
CRITERION |
|---|---|---|---|---|
| First Payment Timeliness | ||||
| Intrastate UI, full weeks - 14/21 Days | 341,735 | 92.6% | 90.1% | 87% |
| Intrastate UI, full weeks - 35 Days | 341,735 | 98.0% | 97.2% | 93% |
| Interstate UI, full weeks - 14/21 Days | 8,751 | 84.3% | 78.4% | 70% |
| Interstate UI, full weeks - 35 Days | 8,751 | 94.3% | 92.4% | 78% |
| All First Payments - 14/21 Days | 424,189 | 90.9% | 89.2% | 90% (Fiscal Year '02) |
| All First Payments - 35 Days | 424,189 | 98.0% | 97.0% | 95% (Fiscal Year '02) |
| Nonmonetary Determinations Timeliness: Detection Date to Determination Date |
||||
| Nonseparation Determ. within 14 Days | 410,039 | 49.7% | 68.6% | 80% (Fiscal Year '02) |
| Separation Determ. within 21 Days | 142,148 | 74.2% | 73.3% | 80% (Fiscal Year '02) |
| Nonmonetary Issue Detection Timeliness: First Week Affected to Detection Date |
||||
| Nonseparation Issues within 14 Days | 410,039 | 51.9% | 63.1% | none |
| Separation Issues within 21 Days | 142,148 | 94.1% | 90.7% | none |
| Lower Authority Appeals Timeliness | ||||
| Decisions within 30 Days of Filing | 45,236 | 81.0% | 67.9% | 60% |
| Decisions within 45 Days of Filing | 45,236 | 92.3% | 85.4% | 80% |
| Decisions within 90 Days of Filing | 45,236 | 98.0% | 95.5% | 95% (Fiscal Year '02) |
| Higher Authority Appeals Timeliness | ||||
| Decisions within 45 Days of Filing | 8,195 | 72.6% | 62.7% | 50% (Fiscal Year '00) |
| Decisions within 75 Days of Filing | 8,195 | 91.5% | 85.6% | 80% (Fiscal Year '00) |
| Decisions within 150 Days of Filing | 8,195 | 98.9% | 96.3% | 95% (Fiscal Year '00) |
| Combined Wage Program Timeliness | ||||
| Wage Transfers Made within 3 Days | 13,700 | 77.5% | 69.8% | none |
| Wage Transfers Made within 14 Days | 13,700 | 93.0% | 97.3% | none |
| Billing Made within 45 Days | 199 | 93.5% | 92.6% | none |
| Reimbursements Made within 45 Days | 199 | 99.5% | 96.4% | none |
| Continued Claims Payment Timeliness | ||||
| Payments Made within 7 Days | 6,202,138 | 47.3% | 61.4% | none |
| Payments Made within 14 Days | 6,202,138 | 96.2% | 92.5% | none |
| Payments Made within 21 Days | 6,202,138 | 98.2% | 96.3% | none |
| Benefit Quality Measures | ||||
| Nonmon. Determin. with Scores > 80% | 383 | 79.5% | 70.9% | 75% (Fiscal Year '02) |
| LA Appeals with Scores >= 85% | 156 | 96.9% | 90.5% | 80% (Fiscal Year '00) |
| Benefit Payment Control | ||||
| Fraud Overpayment Recovery Rate | 13,183,219 | 30.2% | 50.9% | none |
| Nonfraud Overpayment Recovery Rate | 18,515,624 | 37.2% | 56.1% | none |
| Pennsylvania | ||||
| REPORTED MEASURE | STATE RESULTS | NATIONAL RESULTS | CRITERION | |
|---|---|---|---|---|
| Cash Management | ||||
| Average time (days) funds are on deposit before being transferred to Trust Fund | 0.1 | 2.1 days | <= 2 (Fiscal Year '00) | |
| Ratio of avg daily loanable balance in Clearing Account to avg daily transfer to Tust Fund | 0.07 | 1.70 | <= 1.75 (Fiscal Year '02) | |
| Benefit Accuracy Measurement | ||||
| Total Dollars Paid in Population | $1,421,240,755 | $18.8 B | none | |
| Sample Size | 480 | 26,353 | none | |
| Proper Payment Rate | 95.1 +/- 1.8 | 91.5% | none | |
| Overpayment Rate | 4.9 +/- 1.8 | 8.5% | none | |
| Underpayment Rate | 0.5 +/- 0.3 | 0.9% | none | |
| Footnotes: | none | |||

| Pennsylvania | ||||
| REPORTED MEASURE | STATE RESULTS | NATIONAL RESULTS | ||
|---|---|---|---|---|
| Status Determinations | ||||
| New Employer Determinations: | ||||
| Percentage Made Within 90 Days (Fiscal Year '00 criterion: 60%) | 56.0% | 78.0% | ||
| Percentage Made Within 180 Days (Fiscal Year '00 criterion: 80%) | 69.1% | 89.7% | ||
| Accuracy In Determinations? (Fiscal Year '02 criterion: <= 6 failed) | P | 45.8% Pass | ||
| Accuracy In Postings? | P | 39.6% Pass | ||
| Successor Determinations: | ||||
| Percentage Made Within 90 Days | 25.2% | 67.0% | ||
| Percentage Made Within 180 Days | 48.6% | 81.5% | ||
| Accuracy In Determinations? | P | 54.2% Pass | ||
| Accuracy In Postings? | P | 45.8% Pass | ||
| Inactivations: | ||||
| Accuracy In Determinations? | P | 64.4% Pass | ||
| Accuracy In Postings? | P | 64.6% Pass | ||
| Report Delinquency | ||||
| Reports From Contributory Employers: | ||||
| Percentage Filed Timely | 94.8% | 87.4% | ||
| Percentage Secured | 98.2% | 92.5% | ||
| Percentage Resolved | 100.7% | 97.1% | ||
| Reports From Reimbursing Employers: | ||||
| Percentage Filed Timely | 95.5% | 79.8% | ||
| Percentage Secured | 97.3% | 85.9% | ||
| Percentage Resolved | 99.0% | 87.5% | ||
| Appropriate Actions Taken To Resolve Delinquencies? | P | 76.6% Pass | ||
| Collections | ||||
| Collections From Contributory Employers: | ||||
| Percentage Of Tax Due Paid Timely | 96.0% | 92.0% | ||
| Turnover Ratio - Ratio Of Receivables Liquidated Or Declared Uncollectible/Doubtful To Tax Due | 4.0% | 8.1% | ||
| Percentage of Tax Due Declared Uncollectible/Doubtful | 0.9% | 1.3% | ||
| Accounts Receivable As A Percentage Of Tax Due | 1.8% | 2.2% | ||
| Collections From Reimbursing Employers: | ||||
| Percentage Of Tax Due Paid Timely | 83.4% | 80.6% | ||
| Turnover Ratio - Ratio Of Receivables Liquidated Or Declared Uncollectible/Doubtful To Tax Due | 17.3% | 19.4% | ||
| Percentage of Tax Due Declared Uncollectible/Doubtful | 0.6% | 1.2% | ||
| Accounts Receivable As A Percentage Of Tax Due | 9.9% | 4.6% | ||
| Appropriate Actions Taken To Collect Tax Due? | P | 48.9% Pass | ||
| Cashiering | ||||
| Remittances Deposited Within Three Days? | P | 92.0% Pass | ||
| Field Audit | ||||
| Percent Change In Total Wages Resulting From Audits | 6.3% | 5.0% | ||
| Percentage Of Contributory Employers Audited | 2.1% | 2.0% | ||
| Annualized Percentage Of Total Wages Audited | 1.1% | 1.8% | ||
| Audits Meet Employment Security Manual Requirements? | P | 64.6% Pass | ||
| Account Maintenance | ||||
| Accuracy In Report Processing? | P | 96.0% Pass | ||
| Accuracy In Contributory Employer Billing? | P | 84.8% Pass | ||
| Accuracy In Reimbursing Employer Billings? | P | 85.7% Pass | ||
| Accuracy In Credits/Refunds? | P | 73.9% Pass | ||
| Accuracy In Benefit Charging? | P | 89.6% Pass | ||
| Accuracy In Experience Rating? | P | 87.8% Pass | ||
| Puerto Rico | ||||
| REPORTED MEASURE | WORKLOAD | STATE RESULTS |
NATIONAL RESULTS |
CRITERION |
|---|---|---|---|---|
| First Payment Timeliness | ||||
| Intrastate UI, full weeks - 14/21 Days | 65,019 | 82.4% | 90.1% | 87% |
| Intrastate UI, full weeks - 35 Days | 341,735 | 97.2% | 97.2% | 93% |
| Interstate UI, full weeks - 14/21 Days | 5,181 | 63.8% | 78.4% | 70% |
| Interstate UI, full weeks - 35 Days | 5,181 | 94.1% | 92.4% | 78% |
| All First Payments - 14/21 Days | 84,812 | 78.9% | 89.2% | 90% (Fiscal Year '02) |
| All First Payments - 35 Days | 84,812 | 94.1% | 97.0% | 95% (Fiscal Year '02) |
| Nonmonetary Determinations Timeliness: Detection Date to Determination Date |
||||
| Nonseparation Determ. within 14 Days | 50,365 | 60.2% | 68.6% | 80% (Fiscal Year '02) |
| Separation Determ. within 21 Days | 35,713 | 74.2% | 73.3% | 80% (Fiscal Year '02) |
| Nonmonetary Issue Detection Timeliness: First Week Affected to Detection Date |
||||
| Nonseparation Issues within 14 Days | 38,905 | 56.4% | 63.1% | none |
| Separation Issues within 21 Days | 11,203 | 84.3% | 90.7% | none |
| Lower Authority Appeals Timeliness | ||||
| Decisions within 30 Days of Filing | 5,847 | 63.8% | 67.9% | 60% |
| Decisions within 45 Days of Filing | 5,847 | 81.4% | 85.4% | 80% |
| Decisions within 90 Days of Filing | 5,847 | 98.8% | 95.5% | 95% (Fiscal Year '02) |
| Higher Authority Appeals Timeliness | ||||
| Decisions within 45 Days of Filing | 1,050 | 62.9% | 62.7% | 50% (Fiscal Year '00) |
| Decisions within 75 Days of Filing | 1,050 | 83.0% | 85.6% | 80% (Fiscal Year '00) |
| Decisions within 150 Days of Filing | 1,050 | 96.4% | 96.3% | 95% (Fiscal Year '00) |
| Combined Wage Program Timeliness | ||||
| Wage Transfers Made within 3 Days | 649 | 0.0% | 69.8% | none |
| Wage Transfers Made within 14 Days | 649 | 96.9% | 97.3% | none |
| Billing Made within 45 Days | 0 | 0.0% | 92.6% | none |
| Reimbursements Made within 45 Days | 0 | 0.0% | 96.4% | none |
| Continued Claims Payment Timeliness | ||||
| Payments Made within 7 Days | 1,759,439 | 36.8% | 61.4% | none |
| Payments Made within 14 Days | 1,759,439 | 80.8% | 92.5% | none |
| Payments Made within 21 Days | 1,759,439 | 91.2% | 96.3% | none |
| Benefit Quality Measures | ||||
| Nonmon. Determin. with Scores > 80% | 217 | 54.8% | 70.9% | 75% (Fiscal Year '02) |
| LA Appeals with Scores >= 85% | 78 | 90.0% | 90.5% | 80% (Fiscal Year '00) |
| Benefit Payment Control | ||||
| Fraud Overpayment Recovery Rate | 1,875,941 | 44.3% | 50.9% | none |
| Nonfraud Overpayment Recovery Rate | 937,111 | 46.7% | 56.1% | none |
| Puerto Rico | ||||
| REPORTED MEASURE | STATE RESULTS | NATIONAL RESULTS | CRITERION | |
|---|---|---|---|---|
| Cash Management | ||||
| Average time (days) funds are on deposit before being transferred to Trust Fund | * | 2.1 days | <= 2 (Fiscal Year '00) | |
| Ratio of avg daily loanable balance in Clearing Account to avg daily transfer to Tust Fund | * | 1.70 | <= 1.75 (Fiscal Year '02) | |
| Benefit Accuracy Measurement | ||||
| Total Dollars Paid in Population | $241,644,056 | $18.8 B | none | |
| Sample Size | 480 | 26,353 | none | |
| Proper Payment Rate | 91.4 +/- 2.6 | 91.5% | none | |
| Overpayment Rate | 8.6 +/- 2.6 | 8.5% | none | |
| Underpayment Rate | 1.1 +/- 0.4 | 0.9% | none | |
| Footnotes: | #5 | |||
* State did not submit report as of 8/4/99.
| Puerto Rico | ||||
| REPORTED MEASURE | STATE RESULTS | NATIONAL RESULTS | ||
|---|---|---|---|---|
| Status Determinations | ||||
| New Employer Determinations: | ||||
| Percentage Made Within 90 Days (Fiscal Year '00 criterion: 60%) | 73.2% | 78.0% | ||
| Percentage Made Within 180 Days (Fiscal Year '00 criterion: 80%) | 85.6% | 89.7% | ||
| Accuracy In Determinations? (Fiscal Year '02 criterion: <= 6 failed) | * | 45.8% Pass | ||
| Accuracy In Postings? | * | 39.6% Pass | ||
| Successor Determinations: | ||||
| Percentage Made Within 90 Days | 77.9% | 67.0% | ||
| Percentage Made Within 180 Days | 89.0% | 81.5% | ||
| Accuracy In Determinations? | * | 54.2% Pass | ||
| Accuracy In Postings? | * | 45.8% Pass | ||
| Inactivations: | ||||
| Accuracy In Determinations? | * | 64.4% Pass | ||
| Accuracy In Postings? | * | 64.6% Pass | ||
| Report Delinquency | ||||
| Reports From Contributory Employers: | ||||
| Percentage Filed Timely | 72.9% | 87.4% | ||
| Percentage Secured | 79.6% | 92.5% | ||
| Percentage Resolved | 84.3% | 97.1% | ||
| Reports From Reimbursing Employers: | ||||
| Percentage Filed Timely | 56.1% | 79.8% | ||
| Percentage Secured | 66.8% | 85.9% | ||
| Percentage Resolved | 75.1% | 87.5% | ||
| Appropriate Actions Taken To Resolve Delinquencies? | * | 76.6% Pass | ||
| Collections | ||||
| Collections From Contributory Employers: | ||||
| Percentage Of Tax Due Paid Timely | 90.3% | 92.0% | ||
| Turnover Ratio - Ratio Of Receivables Liquidated Or Declared Uncollectible/Doubtful To Tax Due | 9.6% | 8.1% | ||
| Percentage of Tax Due Declared Uncollectible/Doubtful | 4.7% | 1.3% | ||
| Accounts Receivable As A Percentage Of Tax Due | 7.8% | 2.2% | ||
| Collections From Reimbursing Employers: | ||||
| Percentage Of Tax Due Paid Timely | 9.8% | 80.6% | ||
| Turnover Ratio - Ratio Of Receivables Liquidated Or Declared Uncollectible/Doubtful To Tax Due | 82.4% | 19.4% | ||
| Percentage of Tax Due Declared Uncollectible/Doubtful | 14.2% | 1.2% | ||
| Accounts Receivable As A Percentage Of Tax Due | 49.8% | 4.6% | ||
| Appropriate Actions Taken To Collect Tax Due? | * | 48.9% Pass | ||
| Cashiering | ||||
| Remittances Deposited Within Three Days? | * | 92.0% Pass | ||
| Field Audit | ||||
| Percent Change In Total Wages Resulting From Audits | 10.8% | 5.0% | ||
| Percentage Of Contributory Employers Audited | 1.9% | 2.0% | ||
| Annualized Percentage Of Total Wages Audited | 1.4% | 1.8% | ||
| Audits Meet Employment Security Manual Requirements? | * | 64.6% Pass | ||
| Account Maintenance | ||||
| Accuracy In Report Processing? | * | 96.0% Pass | ||
| Accuracy In Contributory Employer Billing? | * | 84.8% Pass | ||
| Accuracy In Reimbursing Employer Billings? | * | 85.7% Pass | ||
| Accuracy In Credits/Refunds? | * | 73.9% Pass | ||
| Accuracy In Benefit Charging? | * | 89.6% Pass | ||
| Accuracy In Experience Rating? | * | 87.8% Pass | ||
* State did not submit report as of 8/4/99.
| Rhode Island | ||||
| REPORTED MEASURE | WORKLOAD | STATE RESULTS |
NATIONAL RESULTS |
CRITERION |
|---|---|---|---|---|
| First Payment Timeliness | ||||
| Intrastate UI, full weeks - 14/21 Days | 37,423 | 87.4% | 90.1% | 87% |
| Intrastate UI, full weeks - 35 Days | 37,423 | 96.8% | 97.2% | 93% |
| Interstate UI, full weeks - 14/21 Days | 1,171 | 80.8% | 78.4% | 70% |
| Interstate UI, full weeks - 35 Days | 1,171 | 95.3% | 92.4% | 78% |
| All First Payments - 14/21 Days | 42,933 | 86.5% | 89.2% | 90% (Fiscal Year '02) |
| All First Payments - 35 Days | 42,933 | 96.7% | 97.0% | 95% (Fiscal Year '02) |
| Nonmonetary Determinations Timeliness: Detection Date to Determination Date |
||||
| Nonseparation Determ. within 14 Days | 20,247 | 62.4% | 68.6% | 80% (Fiscal Year '02) |
| Separation Determ. within 21 Days | 21,586 | 72.1% | 73.3% | 80% (Fiscal Year '02) |
| Nonmonetary Issue Detection Timeliness: First Week Affected to Detection Date |
||||
| Nonseparation Issues within 14 Days | 20,247 | 60.0% | 63.1% | none |
| Separation Issues within 21 Days | 21,586 | 71.8% | 90.7% | none |
| Lower Authority Appeals Timeliness | ||||
| Decisions within 30 Days of Filing | 5,069 | 74.6% | 67.9% | 60% |
| Decisions within 45 Days of Filing | 5,069 | 93.6% | 85.4% | 80% |
| Decisions within 90 Days of Filing | 5,069 | 99.8% | 95.5% | 95% (Fiscal Year '02) |
| Higher Authority Appeals Timeliness | ||||
| Decisions within 45 Days of Filing | 721 | 75.9% | 62.7% | 50% (Fiscal Year '00) |
| Decisions within 75 Days of Filing | 721 | 91.8% | 85.6% | 80% (Fiscal Year '00) |
| Decisions within 150 Days of Filing | 721 | 96.4% | 96.3% | 95% (Fiscal Year '00) |
| Combined Wage Program Timeliness | ||||
| Wage Transfers Made within 3 Days | 6,899 | 68.6% | 69.8% | none |
| Wage Transfers Made within 14 Days | 6,899 | 84.9% | 97.3% | none |
| Billing Made within 45 Days | 0 | 0.0% | 92.6% | none |
| Reimbursements Made within 45 Days | 0 | 0.0% | 96.4% | none |
| Continued Claims Payment Timeliness | ||||
| Payments Made within 7 Days | 556,133 | 93.5% | 61.4% | none |
| Payments Made within 14 Days | 556,133 | 96.9% | 92.5% | none |
| Payments Made within 21 Days | 556,133 | 98.1% | 96.3% | none |
| Benefit Quality Measures | ||||
| Nonmon. Determin. with Scores > 80% | 229 | 91.8% | 70.9% | 75% (Fiscal Year '02) |
| LA Appeals with Scores >= 85% | 77 | 93.8% | 90.5% | 80% (Fiscal Year '00) |
| Benefit Payment Control | ||||
| Fraud Overpayment Recovery Rate | 1,619,803 | 74.9% | 50.9% | none |
| Nonfraud Overpayment Recovery Rate | 1,506,546 | 45.4% | 56.1% | none |
| Rhode Island | ||||
| REPORTED MEASURE | STATE RESULTS | NATIONAL RESULTS | CRITERION | |
|---|---|---|---|---|
| Cash Management | ||||
| Average time (days) funds are on deposit before being transferred to Trust Fund | 0.3 | 2.1 days | <= 2 (Fiscal Year '00) | |
| Ratio of avg daily loanable balance in Clearing Account to avg daily transfer to Tust Fund | 0.35 | 1.70 | <= 1.75 (Fiscal Year '02) | |
| Benefit Accuracy Measurement | ||||
| Total Dollars Paid in Population | $125,302,913 | $18.8 B | none | |
| Sample Size | 480 | 26,353 | none | |
| Proper Payment Rate | 95.1 +/- 2.4 | 91.5% | none | |
| Overpayment Rate | 4.9 +/- 2.4 | 8.5% | none | |
| Underpayment Rate | 1.7 +/- 1 | 0.9% | none | |
| Footnotes: | none | |||

| Rhode Island | ||||
| REPORTED MEASURE | STATE RESULTS | NATIONAL RESULTS | ||
|---|---|---|---|---|
| Status Determinations | ||||
| New Employer Determinations: | ||||
| Percentage Made Within 90 Days (Fiscal Year '00 criterion: 60%) | 94.4% | 78.0% | ||
| Percentage Made Within 180 Days (Fiscal Year '00 criterion: 80%) | 96.8% | 89.7% | ||
| Accuracy In Determinations? (Fiscal Year '02 criterion: <= 6 failed) | P | 45.8% Pass | ||
| Accuracy In Postings? | P | 39.6% Pass | ||
| Successor Determinations: | ||||
| Percentage Made Within 90 Days | 82.8% | 67.0% | ||
| Percentage Made Within 180 Days | 90.6% | 81.5% | ||
| Accuracy In Determinations? | P | 54.2% Pass | ||
| Accuracy In Postings? | P | 45.8% Pass | ||
| Inactivations: | ||||
| Accuracy In Determinations? | P | 64.4% Pass | ||
| Accuracy In Postings? | P | 64.6% Pass | ||
| Report Delinquency | ||||
| Reports From Contributory Employers: | ||||
| Percentage Filed Timely | 92.4% | 87.4% | ||
| Percentage Secured | 96.5% | 92.5% | ||
| Percentage Resolved | 98.0% | 97.1% | ||
| Reports From Reimbursing Employers: | ||||
| Percentage Filed Timely | 97.8% | 79.8% | ||
| Percentage Secured | 98.3% | 85.9% | ||
| Percentage Resolved | 98.3% | 87.5% | ||
| Appropriate Actions Taken To Resolve Delinquencies? | P | 76.6% Pass | ||
| Collections | ||||
| Collections From Contributory Employers: | ||||
| Percentage Of Tax Due Paid Timely | 84.7% | 92.0% | ||
| Turnover Ratio - Ratio Of Receivables Liquidated Or Declared Uncollectible/Doubtful To Tax Due | 15.6% | 8.1% | ||
| Percentage of Tax Due Declared Uncollectible/Doubtful | 4.0% | 1.3% | ||
| Accounts Receivable As A Percentage Of Tax Due | 1.8% | 2.2% | ||
| Collections From Reimbursing Employers: | ||||
| Percentage Of Tax Due Paid Timely | 84.4% | 80.6% | ||
| Turnover Ratio - Ratio Of Receivables Liquidated Or Declared Uncollectible/Doubtful To Tax Due | 11.5% | 19.4% | ||
| Percentage of Tax Due Declared Uncollectible/Doubtful | 0.4% | 1.2% | ||
| Accounts Receivable As A Percentage Of Tax Due | 0.8% | 4.6% | ||
| Appropriate Actions Taken To Collect Tax Due? | F | 48.9% Pass | ||
| Cashiering | ||||
| Remittances Deposited Within Three Days? | P | 92.0% Pass | ||
| Field Audit | ||||
| Percent Change In Total Wages Resulting From Audits | 6.3% | 5.0% | ||
| Percentage Of Contributory Employers Audited | 2.2% | 2.0% | ||
| Annualized Percentage Of Total Wages Audited | 2.0% | 1.8% | ||
| Audits Meet Employment Security Manual Requirements? | P | 64.6% Pass | ||
| Account Maintenance | ||||
| Accuracy In Report Processing? | P | 96.0% Pass | ||
| Accuracy In Contributory Employer Billing? | P | 84.8% Pass | ||
| Accuracy In Reimbursing Employer Billings? | ** | 85.7% Pass | ||
| Accuracy In Credits/Refunds? | P | 73.9% Pass | ||
| Accuracy In Benefit Charging? | P | 89.6% Pass | ||
| Accuracy In Experience Rating? | P | 87.8% Pass | ||
** State had a problem in establishing the sample universe.

| South Carolina | ||||
| REPORTED MEASURE | WORKLOAD | STATE RESULTS |
NATIONAL RESULTS |
CRITERION |
|---|---|---|---|---|
| First Payment Timeliness | ||||
| Intrastate UI, full weeks - 14/21 Days | 71,303 | 94.1% | 90.1% | 87% |
| Intrastate UI, full weeks - 35 Days | 71,303 | 98.5% | 97.2% | 93% |
| Interstate UI, full weeks - 14/21 Days | 1,536 | 83.7% | 78.4% | 70% |
| Interstate UI, full weeks - 35 Days | 1,536 | 95.1% | 92.4% | 78% |
| All First Payments - 14/21 Days | 93,614 | 92.0% | 89.2% | 90% (Fiscal Year '02) |
| All First Payments - 35 Days | 93,614 | 98.5% | 97.0% | 95% (Fiscal Year '02) |
| Nonmonetary Determinations Timeliness: Detection Date to Determination Date |
||||
| Nonseparation Determ. within 14 Days | 13,243 | 84.0% | 68.6% | 80% (Fiscal Year '02) |
| Separation Determ. within 21 Days | 35,707 | 94.4% | 73.3% | 80% (Fiscal Year '02) |
| Nonmonetary Issue Detection Timeliness: First Week Affected to Detection Date |
||||
| Nonseparation Issues within 14 Days | 13,243 | 78.7% | 63.1% | none |
| Separation Issues within 21 Days | 35,707 | 99.2% | 90.7% | none |
| Lower Authority Appeals Timeliness | ||||
| Decisions within 30 Days of Filing | 8,262 | 99.9% | 67.9% | 60% |
| Decisions within 45 Days of Filing | 8,262 | 100.0% | 85.4% | 80% |
| Decisions within 90 Days of Filing | 8,262 | 100.0% | 95.5% | 95% (Fiscal Year '02) |
| Higher Authority Appeals Timeliness | ||||
| Decisions within 45 Days of Filing | 1,070 | 54.6% | 62.7% | 50% (Fiscal Year '00) |
| Decisions within 75 Days of Filing | 1,070 | 79.9% | 85.6% | 80% (Fiscal Year '00) |
| Decisions within 150 Days of Filing | 1,070 | 99.6% | 96.3% | 95% (Fiscal Year '00) |
| Combined Wage Program Timeliness | ||||
| Wage Transfers Made within 3 Days | 10,295 | 24.1% | 69.8% | none |
| Wage Transfers Made within 14 Days | 10,295 | 96.1% | 97.3% | none |
| Billing Made within 45 Days | 196 | 100.0% | 92.6% | none |
| Reimbursements Made within 45 Days | 195 | 100.0% | 96.4% | none |
| Continued Claims Payment Timeliness | ||||
| Payments Made within 7 Days | 933,864 | 91.1% | 61.4% | none |
| Payments Made within 14 Days | 933,864 | 98.0% | 92.5% | none |
| Payments Made within 21 Days | 933,864 | 99.0% | 96.3% | none |
| Benefit Quality Measures | ||||
| Nonmon. Determin. with Scores > 80% | 232 | 79.1% | 70.9% | 75% (Fiscal Year '02) |
| LA Appeals with Scores >= 85% | 84 | 93.0% | 90.5% | 80% (Fiscal Year '00) |
| Benefit Payment Control | ||||
| Fraud Overpayment Recovery Rate | 1,888,433 | 74.9% | 50.9% | none |
| Nonfraud Overpayment Recovery Rate | 2,927,741 | 87.4% | 56.1% | none |
| South Carolina | ||||
| REPORTED MEASURE | STATE RESULTS | NATIONAL RESULTS | CRITERION | |
|---|---|---|---|---|
| Cash Management | ||||
| Average time (days) funds are on deposit before being transferred to Trust Fund | 1.9 | 2.1 days | <= 2 (Fiscal Year '00) | |
| Ratio of avg daily loanable balance in Clearing Account to avg daily transfer to Tust Fund | 1.12 | 1.70 | <= 1.75 (Fiscal Year '02) | |
| Benefit Accuracy Measurement | ||||
| Total Dollars Paid in Population | $164,743,105 | $18.8 B | none | |
| Sample Size | 497 | 26,353 | none | |
| Proper Payment Rate | 88.1 +/- 2.8 | 91.5% | none | |
| Overpayment Rate | 11.9 +/- 2.8 | 8.5% | none | |
| Underpayment Rate | 0.4 +/- 0.3 | 0.9% | none | |
| Footnotes: | none | |||
| South Carolina | ||||
| REPORTED MEASURE | STATE RESULTS | NATIONAL RESULTS | ||
|---|---|---|---|---|
| Status Determinations | ||||
| New Employer Determinations: | ||||
| Percentage Made Within 90 Days (Fiscal Year '00 criterion: 60%) | 74.6% | 78.0% | ||
| Percentage Made Within 180 Days (Fiscal Year '00 criterion: 80%) | 91.9% | 89.7% | ||
| Accuracy In Determinations? (Fiscal Year '02 criterion: <= 6 failed) | P | 45.8% Pass | ||
| Accuracy In Postings? | P | 39.6% Pass | ||
| Successor Determinations: | ||||
| Percentage Made Within 90 Days | 86.0% | 67.0% | ||
| Percentage Made Within 180 Days | 95.1% | 81.5% | ||
| Accuracy In Determinations? | P | 54.2% Pass | ||
| Accuracy In Postings? | P | 45.8% Pass | ||
| Inactivations: | ||||
| Accuracy In Determinations? | P | 64.4% Pass | ||
| Accuracy In Postings? | P | 64.6% Pass | ||
| Report Delinquency | ||||
| Reports From Contributory Employers: | ||||
| Percentage Filed Timely | 88.8% | 87.4% | ||
| Percentage Secured | 95.3% | 92.5% | ||
| Percentage Resolved | 97.8% | 97.1% | ||
| Reports From Reimbursing Employers: | ||||
| Percentage Filed Timely | 91.9% | 79.8% | ||
| Percentage Secured | 96.5% | 85.9% | ||
| Percentage Resolved | 97.4% | 87.5% | ||
| Appropriate Actions Taken To Resolve Delinquencies? | P | 76.6% Pass | ||
| Collections | ||||
| Collections From Contributory Employers: | ||||
| Percentage Of Tax Due Paid Timely | 93.0% | 92.0% | ||
| Turnover Ratio - Ratio Of Receivables Liquidated Or Declared Uncollectible/Doubtful To Tax Due | 6.3% | 8.1% | ||
| Percentage of Tax Due Declared Uncollectible/Doubtful | 1.0% | 1.3% | ||
| Accounts Receivable As A Percentage Of Tax Due | 3.8% | 2.2% | ||
| Collections From Reimbursing Employers: | ||||
| Percentage Of Tax Due Paid Timely | 96.4% | 80.6% | ||
| Turnover Ratio - Ratio Of Receivables Liquidated Or Declared Uncollectible/Doubtful To Tax Due | 5.8% | 19.4% | ||
| Percentage of Tax Due Declared Uncollectible/Doubtful | 0.0% | 1.2% | ||
| Accounts Receivable As A Percentage Of Tax Due | 0.9% | 4.6% | ||
| Appropriate Actions Taken To Collect Tax Due? | P | 48.9% Pass | ||
| Cashiering | ||||
| Remittances Deposited Within Three Days? | P | 92.0% Pass | ||
| Field Audit | ||||
| Percent Change In Total Wages Resulting From Audits | 2.6% | 5.0% | ||
| Percentage Of Contributory Employers Audited | 2.1% | 2.0% | ||
| Annualized Percentage Of Total Wages Audited | 0.8% | 1.8% | ||
| Audits Meet Employment Security Manual Requirements? | P | 64.6% Pass | ||
| Account Maintenance | ||||
| Accuracy In Report Processing? | P | 96.0% Pass | ||
| Accuracy In Contributory Employer Billing? | P | 84.8% Pass | ||
| Accuracy In Reimbursing Employer Billings? | P | 85.7% Pass | ||
| Accuracy In Credits/Refunds? | P | 73.9% Pass | ||
| Accuracy In Benefit Charging? | P | 89.6% Pass | ||
| Accuracy In Experience Rating? | P | 87.8% Pass | ||

| South Dakota | ||||
| REPORTED MEASURE | WORKLOAD | STATE RESULTS |
NATIONAL RESULTS |
CRITERION |
|---|---|---|---|---|
| First Payment Timeliness | ||||
| Intrastate UI, full weeks - 14/21 Days | 6,746 | 91.8% | 90.1% | 87% |
| Intrastate UI, full weeks - 35 Days | 6,746 | 98.2% | 97.2% | 93% |
| Interstate UI, full weeks - 14/21 Days | 381 | 84.3% | 78.4% | 70% |
| Interstate UI, full weeks - 35 Days | 381 | 96.9% | 92.4% | 78% |
| All First Payments - 14/21 Days | 8,864 | 91.4% | 89.2% | 90% (Fiscal Year '02) |
| All First Payments - 35 Days | 8,864 | 98.2% | 97.0% | 95% (Fiscal Year '02) |
| Nonmonetary Determinations Timeliness: Detection Date to Determination Date |
||||
| Nonseparation Determ. within 14 Days | 8,537 | 71.1% | 68.6% | 80% (Fiscal Year '02) |
| Separation Determ. within 21 Days | 4,723 | 71.0% | 73.3% | 80% (Fiscal Year '02) |
| Nonmonetary Issue Detection Timeliness: First Week Affected to Detection Date |
||||
| Nonseparation Issues within 14 Days | 8,537 | 98.8% | 63.1% | none |
| Separation Issues within 21 Days | 4,723 | 99.8% | 90.7% | none |
| Lower Authority Appeals Timeliness | ||||
| Decisions within 30 Days of Filing | 1,076 | 60.3% | 67.9% | 60% |
| Decisions within 45 Days of Filing | 1,076 | 87.1% | 85.4% | 80% |
| Decisions within 90 Days of Filing | 1,076 | 99.0% | 95.5% | 95% (Fiscal Year '02) |
| Higher Authority Appeals Timeliness | ||||
| Decisions within 45 Days of Filing | 85 | 96.5% | 62.7% | 50% (Fiscal Year '00) |
| Decisions within 75 Days of Filing | 85 | 100.0% | 85.6% | 80% (Fiscal Year '00) |
| Decisions within 150 Days of Filing | 85 | 100.0% | 96.3% | 95% (Fiscal Year '00) |
| Combined Wage Program Timeliness | ||||
| Wage Transfers Made within 3 Days | 1,927 | 96.4% | 69.8% | none |
| Wage Transfers Made within 14 Days | 1,927 | 99.8% | 97.3% | none |
| Billing Made within 45 Days | 137 | 100.0% | 92.6% | none |
| Reimbursements Made within 45 Days | 145 | 99.3% | 96.4% | none |
| Continued Claims Payment Timeliness | ||||
| Payments Made within 7 Days | 88,219 | 89.3% | 61.4% | none |
| Payments Made within 14 Days | 88,219 | 97.2% | 92.5% | none |
| Payments Made within 21 Days | 88,219 | 98.6% | 96.3% | none |
| Benefit Quality Measures | ||||
| Nonmon. Determin. with Scores > 80% | 230 | 81.3% | 70.9% | 75% (Fiscal Year '02) |
| LA Appeals with Scores >= 85% | 80 | 98.8% | 90.5% | 80% (Fiscal Year '00) |
| Benefit Payment Control | ||||
| Fraud Overpayment Recovery Rate | 218,941 | 74.9% | 50.9% | none |
| Nonfraud Overpayment Recovery Rate | 203,950 | 87.4% | 56.1% | none |
| South Dakota | ||||
| REPORTED MEASURE | STATE RESULTS | NATIONAL RESULTS | CRITERION | |
|---|---|---|---|---|
| Cash Management | ||||
| Average time (days) funds are on deposit before being transferred to Trust Fund | 2.0 | 2.1 days | <= 2 (Fiscal Year '00) | |
| Ratio of avg daily loanable balance in Clearing Account to avg daily transfer to Tust Fund | 1.60 | 1.70 | <= 1.75 (Fiscal Year '02) | |
| Benefit Accuracy Measurement | ||||
| Total Dollars Paid in Population | $14,182,502 | $18.8 B | none | |
| Sample Size | 360 | 26,353 | none | |
| Proper Payment Rate | 95.3 +/- 2.5 | 91.5% | none | |
| Overpayment Rate | 4.7 +/- 2.5 | 8.5% | none | |
| Underpayment Rate | 0.7 +/- 0.4 | 0.9% | none | |
| Footnotes: | none | |||
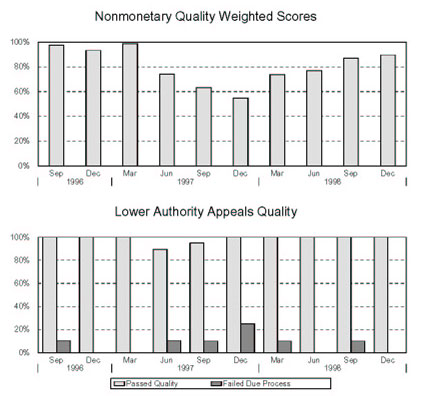
| South Dakota | ||||
| REPORTED MEASURE | STATE RESULTS | NATIONAL RESULTS | ||
|---|---|---|---|---|
| Status Determinations | ||||
| New Employer Determinations: | ||||
| Percentage Made Within 90 Days (Fiscal Year '00 criterion: 60%) | 72.8% | 78.0% | ||
| Percentage Made Within 180 Days (Fiscal Year '00 criterion: 80%) | 84.4% | 89.7% | ||
| Accuracy In Determinations? (Fiscal Year '02 criterion: <= 6 failed) | P | 45.8% Pass | ||
| Accuracy In Postings? | F | 39.6% Pass | ||
| Successor Determinations: | ||||
| Percentage Made Within 90 Days | 80.2% | 67.0% | ||
| Percentage Made Within 180 Days | 92.4% | 81.5% | ||
| Accuracy In Determinations? | F | 54.2% Pass | ||
| Accuracy In Postings? | F | 45.8% Pass | ||
| Inactivations: | ||||
| Accuracy In Determinations? | P | 64.4% Pass | ||
| Accuracy In Postings? | P | 64.6% Pass | ||
| Report Delinquency | ||||
| Reports From Contributory Employers: | ||||
| Percentage Filed Timely | 94.5% | 87.4% | ||
| Percentage Secured | 100.9% | 92.5% | ||
| Percentage Resolved | 102.7% | 97.1% | ||
| Reports From Reimbursing Employers: | ||||
| Percentage Filed Timely | 82.0% | 79.8% | ||
| Percentage Secured | 83.7% | 85.9% | ||
| Percentage Resolved | 84.1% | 87.5% | ||
| Appropriate Actions Taken To Resolve Delinquencies? | P | 76.6% Pass | ||
| Collections | ||||
| Collections From Contributory Employers: | ||||
| Percentage Of Tax Due Paid Timely | 97.9% | 92.0% | ||
| Turnover Ratio - Ratio Of Receivables Liquidated Or Declared Uncollectible/Doubtful To Tax Due | 2.2% | 8.1% | ||
| Percentage of Tax Due Declared Uncollectible/Doubtful | 0.3% | 1.3% | ||
| Accounts Receivable As A Percentage Of Tax Due | 1.2% | 2.2% | ||
| Collections From Reimbursing Employers: | ||||
| Percentage Of Tax Due Paid Timely | 100.0% | 80.6% | ||
| Turnover Ratio - Ratio Of Receivables Liquidated Or Declared Uncollectible/Doubtful To Tax Due | 0.0% | 19.4% | ||
| Percentage of Tax Due Declared Uncollectible/Doubtful | 0.0% | 1.2% | ||
| Accounts Receivable As A Percentage Of Tax Due | 0.0% | 4.6% | ||
| Appropriate Actions Taken To Collect Tax Due? | P | 48.9% Pass | ||
| Cashiering | ||||
| Remittances Deposited Within Three Days? | P | 92.0% Pass | ||
| Field Audit | ||||
| Percent Change In Total Wages Resulting From Audits | 0.9% | 5.0% | ||
| Percentage Of Contributory Employers Audited | 2.9% | 2.0% | ||
| Annualized Percentage Of Total Wages Audited | 2.4% | 1.8% | ||
| Audits Meet Employment Security Manual Requirements? | P | 64.6% Pass | ||
| Account Maintenance | ||||
| Accuracy In Report Processing? | P | 96.0% Pass | ||
| Accuracy In Contributory Employer Billing? | P | 84.8% Pass | ||
| Accuracy In Reimbursing Employer Billings? | ** | 85.7% Pass | ||
| Accuracy In Credits/Refunds? | ** | 73.9% Pass | ||
| Accuracy In Benefit Charging? | P | 89.6% Pass | ||
| Accuracy In Experience Rating? | P | 87.8% Pass | ||
** State had a problem in establishing the sample universe.
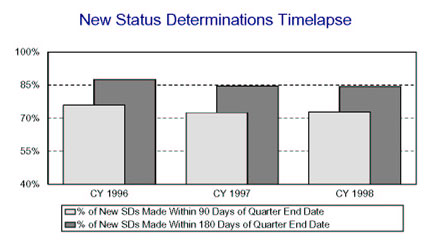
| Tennessee | ||||
| REPORTED MEASURE | WORKLOAD | STATE RESULTS |
NATIONAL RESULTS |
CRITERION |
|---|---|---|---|---|
| First Payment Timeliness | ||||
| Intrastate UI, full weeks - 14/21 Days | 128,199 | 96.4% | 90.1% | 87% |
| Intrastate UI, full weeks - 35 Days | 128,199 | 98.7% | 97.2% | 93% |
| Interstate UI, full weeks - 14/21 Days | 3,618 | 95.4% | 78.4% | 70% |
| Interstate UI, full weeks - 35 Days | 3,618 | 98.5% | 92.4% | 78% |
| All First Payments - 14/21 Days | 159,209 | 95.6% | 89.2% | 90% (Fiscal Year '02) |
| All First Payments - 35 Days | 159,209 | 98.7% | 97.0% | 95% (Fiscal Year '02) |
| Nonmonetary Determinations Timeliness: Detection Date to Determination Date |
||||
| Nonseparation Determ. within 14 Days | 10,612 | 73.0% | 68.6% | 80% (Fiscal Year '02) |
| Separation Determ. within 21 Days | 54,704 | 89.7% | 73.3% | 80% (Fiscal Year '02) |
| Nonmonetary Issue Detection Timeliness: First Week Affected to Detection Date |
||||
| Nonseparation Issues within 14 Days | 10,612 | 89.0% | 63.1% | none |
| Separation Issues within 21 Days | 54,704 | 98.8% | 90.7% | none |
| Lower Authority Appeals Timeliness | ||||
| Decisions within 30 Days of Filing | 14,230 | 72.9% | 67.9% | 60% |
| Decisions within 45 Days of Filing | 14,230 | 87.1% | 85.4% | 80% |
| Decisions within 90 Days of Filing | 14,230 | 99.0% | 95.5% | 95% (Fiscal Year '02) |
| Higher Authority Appeals Timeliness | ||||
| Decisions within 45 Days of Filing | 3,109 | 81.5% | 62.7% | 50% (Fiscal Year '00) |
| Decisions within 75 Days of Filing | 3,109 | 91.4% | 85.6% | 80% (Fiscal Year '00) |
| Decisions within 150 Days of Filing | 3,109 | 99.1% | 96.3% | 95% (Fiscal Year '00) |
| Combined Wage Program Timeliness | ||||
| Wage Transfers Made within 3 Days | 13,367 | 100.0% | 69.8% | none |
| Wage Transfers Made within 14 Days | 13,367 | 100.0% | 97.3% | none |
| Billing Made within 45 Days | 201 | 100.0% | 92.6% | none |
| Reimbursements Made within 45 Days | 197 | 100.0% | 96.4% | none |
| Continued Claims Payment Timeliness | ||||
| Payments Made within 7 Days | 1,812,438 | 92.5% | 61.4% | none |
| Payments Made within 14 Days | 1,812,438 | 98.4% | 92.5% | none |
| Payments Made within 21 Days | 1,812,438 | 99.1% | 96.3% | none |
| Benefit Quality Measures | ||||
| Nonmon. Determin. with Scores > 80% | 224 | 80.9% | 70.9% | 75% (Fiscal Year '02) |
| LA Appeals with Scores >= 85% | 72 | 76.3% | 90.5% | 80% (Fiscal Year '00) |
| Benefit Payment Control | ||||
| Fraud Overpayment Recovery Rate | 2,534,636 | 56.8% | 50.9% | none |
| Nonfraud Overpayment Recovery Rate | 2,973,967 | 61.1% | 56.1% | none |
| Tennessee | ||||
| REPORTED MEASURE | STATE RESULTS | NATIONAL RESULTS | CRITERION | |
|---|---|---|---|---|
| Cash Management | ||||
| Average time (days) funds are on deposit before being transferred to Trust Fund | 1.2 | 2.1 days | <= 2 (Fiscal Year '00) | |
| Ratio of avg daily loanable balance in Clearing Account to avg daily transfer to Tust Fund | 0.26 | 1.70 | <= 1.75 (Fiscal Year '02) | |
| Benefit Accuracy Measurement | ||||
| Total Dollars Paid in Population | $333,395,592 | $18.8 B | none | |
| Sample Size | 480 | 26,353 | none | |
| Proper Payment Rate | 94.9 +/- 1.9 | 91.5% | none | |
| Overpayment Rate | 5.1 +/- 1.9 | 8.5% | none | |
| Underpayment Rate | 0.4 +/- 0.2 | 0.9% | none | |
| Footnotes: | none | |||

| Tennessee | ||||
| REPORTED MEASURE | STATE RESULTS | NATIONAL RESULTS | ||
|---|---|---|---|---|
| Status Determinations | ||||
| New Employer Determinations: | ||||
| Percentage Made Within 90 Days (Fiscal Year '00 criterion: 60%) | 82.5% | 78.0% | ||
| Percentage Made Within 180 Days (Fiscal Year '00 criterion: 80%) | 89.4% | 89.7% | ||
| Accuracy In Determinations? (Fiscal Year '02 criterion: <= 6 failed) | F | 45.8% Pass | ||
| Accuracy In Postings? | P | 39.6% Pass | ||
| Successor Determinations: | ||||
| Percentage Made Within 90 Days | 78.7% | 67.0% | ||
| Percentage Made Within 180 Days | 90.5% | 81.5% | ||
| Accuracy In Determinations? | P | 54.2% Pass | ||
| Accuracy In Postings? | P | 45.8% Pass | ||
| Inactivations: | ||||
| Accuracy In Determinations? | P | 64.4% Pass | ||
| Accuracy In Postings? | P | 64.6% Pass | ||
| Report Delinquency | ||||
| Reports From Contributory Employers: | ||||
| Percentage Filed Timely | 93.1% | 87.4% | ||
| Percentage Secured | 98.3% | 92.5% | ||
| Percentage Resolved | 101.0% | 97.1% | ||
| Reports From Reimbursing Employers: | ||||
| Percentage Filed Timely | 96.4% | 79.8% | ||
| Percentage Secured | 98.5% | 85.9% | ||
| Percentage Resolved | 99.9% | 87.5% | ||
| Appropriate Actions Taken To Resolve Delinquencies? | P | 76.6% Pass | ||
| Collections | ||||
| Collections From Contributory Employers: | ||||
| Percentage Of Tax Due Paid Timely | 95.9% | 92.0% | ||
| Turnover Ratio - Ratio Of Receivables Liquidated Or Declared Uncollectible/Doubtful To Tax Due | 4.0% | 8.1% | ||
| Percentage of Tax Due Declared Uncollectible/Doubtful | 0.6% | 1.3% | ||
| Accounts Receivable As A Percentage Of Tax Due | 1.6% | 2.2% | ||
| Collections From Reimbursing Employers: | ||||
| Percentage Of Tax Due Paid Timely | 79.7% | 80.6% | ||
| Turnover Ratio - Ratio Of Receivables Liquidated Or Declared Uncollectible/Doubtful To Tax Due | 21.6% | 19.4% | ||
| Percentage of Tax Due Declared Uncollectible/Doubtful | 0.6% | 1.2% | ||
| Accounts Receivable As A Percentage Of Tax Due | 2.9% | 4.6% | ||
| Appropriate Actions Taken To Collect Tax Due? | P | 48.9% Pass | ||
| Cashiering | ||||
| Remittances Deposited Within Three Days? | P | 92.0% Pass | ||
| Field Audit | ||||
| Percent Change In Total Wages Resulting From Audits | 1.0% | 5.0% | ||
| Percentage Of Contributory Employers Audited | 2.1% | 2.0% | ||
| Annualized Percentage Of Total Wages Audited | 1.2% | 1.8% | ||
| Audits Meet Employment Security Manual Requirements? | P | 64.6% Pass | ||
| Account Maintenance | ||||
| Accuracy In Report Processing? | P | 96.0% Pass | ||
| Accuracy In Contributory Employer Billing? | P | 84.8% Pass | ||
| Accuracy In Reimbursing Employer Billings? | P | 85.7% Pass | ||
| Accuracy In Credits/Refunds? | P | 73.9% Pass | ||
| Accuracy In Benefit Charging? | P | 89.6% Pass | ||
| Accuracy In Experience Rating? | P | 87.8% Pass | ||
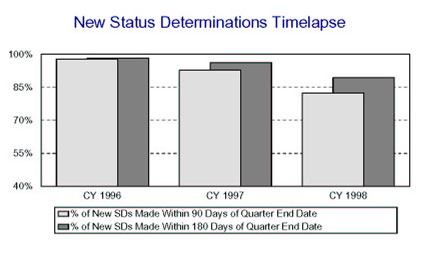
| Texas | ||||
| REPORTED MEASURE | WORKLOAD | STATE RESULTS |
NATIONAL RESULTS |
CRITERION |
|---|---|---|---|---|
| First Payment Timeliness | ||||
| Intrastate UI, full weeks - 14/21 Days | 301,059 | 89.6% | 90.1% | 87% |
| Intrastate UI, full weeks - 35 Days | 301,059 | 97.5% | 97.2% | 93% |
| Interstate UI, full weeks - 14/21 Days | 7,081 | 79.4% | 78.4% | 70% |
| Interstate UI, full weeks - 35 Days | 7,081 | 95.3% | 92.4% | 78% |
| All First Payments - 14/21 Days | 346,415 | 89.2% | 89.2% | 90% (Fiscal Year '02) |
| All First Payments - 35 Days | 346,415 | 97.6% | 97.0% | 95% (Fiscal Year '02) |
| Nonmonetary Determinations Timeliness: Detection Date to Determination Date |
||||
| Nonseparation Determ. within 14 Days | 126,833 | 78.7% | 68.6% | 80% (Fiscal Year '02) |
| Separation Determ. within 21 Days | 234,206 | 64.0% | 73.3% | 80% (Fiscal Year '02) |
| Nonmonetary Issue Detection Timeliness: First Week Affected to Detection Date |
||||
| Nonseparation Issues within 14 Days | 126,833 | 58.4% | 63.1% | none |
| Separation Issues within 21 Days | 234,206 | 97.2% | 90.7% | none |
| Lower Authority Appeals Timeliness | ||||
| Decisions within 30 Days of Filing | 67,369 | 51.4% | 67.9% | 60% |
| Decisions within 45 Days of Filing | 67,369 | 77.6% | 85.4% | 80% |
| Decisions within 90 Days of Filing | 67,369 | 92.1% | 95.5% | 95% (Fiscal Year '02) |
| Higher Authority Appeals Timeliness | ||||
| Decisions within 45 Days of Filing | 12,503 | 78.9% | 62.7% | 50% (Fiscal Year '00) |
| Decisions within 75 Days of Filing | 12,503 | 92.1% | 85.6% | 80% (Fiscal Year '00) |
| Decisions within 150 Days of Filing | 12,503 | 98.6% | 96.3% | 95% (Fiscal Year '00) |
| Combined Wage Program Timeliness | ||||
| Wage Transfers Made within 3 Days | 16,253 | 88.0% | 69.8% | none |
| Wage Transfers Made within 14 Days | 16,253 | 97.3% | 97.3% | none |
| Billing Made within 45 Days | 208 | 100.0% | 92.6% | none |
| Reimbursements Made within 45 Days | 192 | 99.0% | 96.4% | none |
| Continued Claims Payment Timeliness | ||||
| Payments Made within 7 Days | 4,674,535 | 43.1% | 61.4% | none |
| Payments Made within 14 Days | 4,674,535 | 89.2% | 92.5% | none |
| Payments Made within 21 Days | 4,674,535 | 91.3% | 96.3% | none |
| Benefit Quality Measures | ||||
| Nonmon. Determin. with Scores > 80% | 356 | 70.3% | 70.9% | 75% (Fiscal Year '02) |
| LA Appeals with Scores >= 85% | 140 | 76.6% | 90.5% | 80% (Fiscal Year '00) |
| Benefit Payment Control | ||||
| Fraud Overpayment Recovery Rate | 7,240,516 | 40.1% | 50.9% | none |
| Nonfraud Overpayment Recovery Rate | 21,840,768 | 47.4% | 56.1% | none |
| Texas | ||||
| REPORTED MEASURE | STATE RESULTS | NATIONAL RESULTS | CRITERION | |
|---|---|---|---|---|
| Cash Management | ||||
| Average time (days) funds are on deposit before being transferred to Trust Fund | 1.1 | 2.1 days | <= 2 (Fiscal Year '00) | |
| Ratio of avg daily loanable balance in Clearing Account to avg daily transfer to Tust Fund | 0.89 | 1.70 | <= 1.75 (Fiscal Year '02) | |
| Benefit Accuracy Measurement | ||||
| Total Dollars Paid in Population | $876,810,033 | $18.8 B | none | |
| Sample Size | 468 | 26,353 | none | |
| Proper Payment Rate | 85.9 +/- 3.2 | 91.5% | none | |
| Overpayment Rate | 14.1 +/- 3.2 | 8.5% | none | |
| Underpayment Rate | 0.6 +/- 0.4 | 0.9% | none | |
| Footnotes: | none | |||
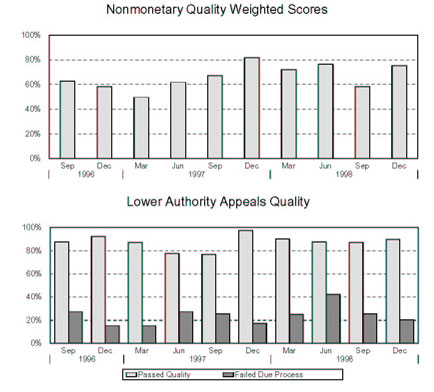
| Texas | ||||
| REPORTED MEASURE | STATE RESULTS | NATIONAL RESULTS | ||
|---|---|---|---|---|
| Status Determinations | ||||
| New Employer Determinations: | ||||
| Percentage Made Within 90 Days (Fiscal Year '00 criterion: 60%) | 78.8% | 78.0% | ||
| Percentage Made Within 180 Days (Fiscal Year '00 criterion: 80%) | 88.2% | 89.7% | ||
| Accuracy In Determinations? (Fiscal Year '02 criterion: <= 6 failed) | P | 45.8% Pass | ||
| Accuracy In Postings? | P | 39.6% Pass | ||
| Successor Determinations: | ||||
| Percentage Made Within 90 Days | 80.7% | 67.0% | ||
| Percentage Made Within 180 Days | 92.7% | 81.5% | ||
| Accuracy In Determinations? | P | 54.2% Pass | ||
| Accuracy In Postings? | P | 45.8% Pass | ||
| Inactivations: | ||||
| Accuracy In Determinations? | P | 64.4% Pass | ||
| Accuracy In Postings? | P | 64.6% Pass | ||
| Report Delinquency | ||||
| Reports From Contributory Employers: | ||||
| Percentage Filed Timely | 93.3% | 87.4% | ||
| Percentage Secured | 100.2% | 92.5% | ||
| Percentage Resolved | 102.4% | 97.1% | ||
| Reports From Reimbursing Employers: | ||||
| Percentage Filed Timely | 99.0% | 79.8% | ||
| Percentage Secured | 100.8% | 85.9% | ||
| Percentage Resolved | 102.3% | 87.5% | ||
| Appropriate Actions Taken To Resolve Delinquencies? | P | 76.6% Pass | ||
| Collections | ||||
| Collections From Contributory Employers: | ||||
| Percentage Of Tax Due Paid Timely | 86.0% | 92.0% | ||
| Turnover Ratio - Ratio Of Receivables Liquidated Or Declared Uncollectible/Doubtful To Tax Due | 13.9% | 8.1% | ||
| Percentage of Tax Due Declared Uncollectible/Doubtful | 2.0% | 1.3% | ||
| Accounts Receivable As A Percentage Of Tax Due | 1.3% | 2.2% | ||
| Collections From Reimbursing Employers: | ||||
| Percentage Of Tax Due Paid Timely | 87.1% | 80.6% | ||
| Turnover Ratio - Ratio Of Receivables Liquidated Or Declared Uncollectible/Doubtful To Tax Due | 13.8% | 19.4% | ||
| Percentage of Tax Due Declared Uncollectible/Doubtful | 0.4% | 1.2% | ||
| Accounts Receivable As A Percentage Of Tax Due | 1.0% | 4.6% | ||
| Appropriate Actions Taken To Collect Tax Due? | P | 48.9% Pass | ||
| Cashiering | ||||
| Remittances Deposited Within Three Days? | P | 92.0% Pass | ||
| Field Audit | ||||
| Percent Change In Total Wages Resulting From Audits | 1.9% | 5.0% | ||
| Percentage Of Contributory Employers Audited | 2.1% | 2.0% | ||
| Annualized Percentage Of Total Wages Audited | 0.9% | 1.8% | ||
| Audits Meet Employment Security Manual Requirements? | P | 64.6% Pass | ||
| Account Maintenance | ||||
| Accuracy In Report Processing? | P | 96.0% Pass | ||
| Accuracy In Contributory Employer Billing? | P | 84.8% Pass | ||
| Accuracy In Reimbursing Employer Billings? | P | 85.7% Pass | ||
| Accuracy In Credits/Refunds? | P | 73.9% Pass | ||
| Accuracy In Benefit Charging? | P | 89.6% Pass | ||
| Accuracy In Experience Rating? | P | 87.8% Pass | ||

| Utah | ||||
| REPORTED MEASURE | WORKLOAD | STATE RESULTS |
NATIONAL RESULTS |
CRITERION |
|---|---|---|---|---|
| First Payment Timeliness | ||||
| Intrastate UI, full weeks - 14/21 Days | 29,836 | 94.2% | 90.1% | 87% |
| Intrastate UI, full weeks - 35 Days | 29,836 | 99.7% | 97.2% | 93% |
| Interstate UI, full weeks - 14/21 Days | 1,327 | 90.6% | 78.4% | 70% |
| Interstate UI, full weeks - 35 Days | 1,327 | 99.3% | 92.4% | 78% |
| All First Payments - 14/21 Days | 35,059 | 94.1% | 89.2% | 90% (Fiscal Year '02) |
| All First Payments - 35 Days | 35,059 | 99.7% | 97.0% | 95% (Fiscal Year '02) |
| Nonmonetary Determinations Timeliness: Detection Date to Determination Date |
||||
| Nonseparation Determ. within 14 Days | 23,137 | 50.8% | 68.6% | 80% (Fiscal Year '02) |
| Separation Determ. within 21 Days | 22,630 | 56.7% | 73.3% | 80% (Fiscal Year '02) |
| Nonmonetary Issue Detection Timeliness: First Week Affected to Detection Date |
||||
| Nonseparation Issues within 14 Days | 23,120 | 90.7% | 63.1% | none |
| Separation Issues within 21 Days | 22,620 | 97.0% | 90.7% | none |
| Lower Authority Appeals Timeliness | ||||
| Decisions within 30 Days of Filing | 5,305 | 82.9% | 67.9% | 60% |
| Decisions within 45 Days of Filing | 5,305 | 97.1% | 85.4% | 80% |
| Decisions within 90 Days of Filing | 5,305 | 99.7% | 95.5% | 95% (Fiscal Year '02) |
| Higher Authority Appeals Timeliness | ||||
| Decisions within 45 Days of Filing | 375 | 53.6% | 62.7% | 50% (Fiscal Year '00) |
| Decisions within 75 Days of Filing | 375 | 95.7% | 85.6% | 80% (Fiscal Year '00) |
| Decisions within 150 Days of Filing | 375 | 99.7% | 96.3% | 95% (Fiscal Year '00) |
| Combined Wage Program Timeliness | ||||
| Wage Transfers Made within 3 Days | 2,419 | 31.8% | 69.8% | none |
| Wage Transfers Made within 14 Days | 2,419 | 98.8% | 97.3% | none |
| Billing Made within 45 Days | 0 | 0.0% | 92.6% | none |
| Reimbursements Made within 45 Days | 0 | 0.0% | 96.4% | none |
| Continued Claims Payment Timeliness | ||||
| Payments Made within 7 Days | 455,593 | 97.2% | 61.4% | none |
| Payments Made within 14 Days | 455,593 | 99.4% | 92.5% | none |
| Payments Made within 21 Days | 455,593 | 99.8% | 96.3% | none |
| Benefit Quality Measures | ||||
| Nonmon. Determin. with Scores > 80% | 236 | 75.9% | 70.9% | 75% (Fiscal Year '02) |
| LA Appeals with Scores >= 85% | 75 | 93.5% | 90.5% | 80% (Fiscal Year '00) |
| Benefit Payment Control | ||||
| Fraud Overpayment Recovery Rate | 1,875,291 | 15.5% | 50.9% | none |
| Nonfraud Overpayment Recovery Rate | 381,288 | 47.4% | 56.1% | none |
| Utah | ||||
| REPORTED MEASURE | STATE RESULTS | NATIONAL RESULTS | CRITERION | |
|---|---|---|---|---|
| Cash Management | ||||
| Average time (days) funds are on deposit before being transferred to Trust Fund | 1.4 | 2.1 days | <= 2 (Fiscal Year '00) | |
| Ratio of avg daily loanable balance in Clearing Account to avg daily transfer to Tust Fund | 0.33 | 1.70 | <= 1.75 (Fiscal Year '02) | |
| Benefit Accuracy Measurement | ||||
| Total Dollars Paid in Population | $83,299,004 | $18.8 B | none | |
| Sample Size | 362 | 26,353 | none | |
| Proper Payment Rate | 84.5 +/- 3.8 | 91.5% | none | |
| Overpayment Rate | 15.5 +/- 3.8 | 8.5% | none | |
| Underpayment Rate | 0.6 +/- 0.3 | 0.9% | none | |
| Footnotes: | #5 | |||

| Utah | ||||
| REPORTED MEASURE | STATE RESULTS | NATIONAL RESULTS | ||
|---|---|---|---|---|
| Status Determinations | ||||
| New Employer Determinations: | ||||
| Percentage Made Within 90 Days (Fiscal Year '00 criterion: 60%) | 86.0% | 78.0% | ||
| Percentage Made Within 180 Days (Fiscal Year '00 criterion: 80%) | 94.0% | 89.7% | ||
| Accuracy In Determinations? (Fiscal Year '02 criterion: <= 6 failed) | P | 45.8% Pass | ||
| Accuracy In Postings? | P | 39.6% Pass | ||
| Successor Determinations: | ||||
| Percentage Made Within 90 Days | 78.3% | 67.0% | ||
| Percentage Made Within 180 Days | 89.2% | 81.5% | ||
| Accuracy In Determinations? | P | 54.2% Pass | ||
| Accuracy In Postings? | P | 45.8% Pass | ||
| Inactivations: | ||||
| Accuracy In Determinations? | P | 64.4% Pass | ||
| Accuracy In Postings? | P | 64.6% Pass | ||
| Report Delinquency | ||||
| Reports From Contributory Employers: | ||||
| Percentage Filed Timely | 92.3% | 87.4% | ||
| Percentage Secured | 97.3% | 92.5% | ||
| Percentage Resolved | 99.2% | 97.1% | ||
| Reports From Reimbursing Employers: | ||||
| Percentage Filed Timely | 54.3% | 79.8% | ||
| Percentage Secured | 90.9% | 85.9% | ||
| Percentage Resolved | 98.9% | 87.5% | ||
| Appropriate Actions Taken To Resolve Delinquencies? | P | 76.6% Pass | ||
| Collections | ||||
| Collections From Contributory Employers: | ||||
| Percentage Of Tax Due Paid Timely | 94.0% | 92.0% | ||
| Turnover Ratio - Ratio Of Receivables Liquidated Or Declared Uncollectible/Doubtful To Tax Due | 5.8% | 8.1% | ||
| Percentage of Tax Due Declared Uncollectible/Doubtful | 0.5% | 1.3% | ||
| Accounts Receivable As A Percentage Of Tax Due | 1.4% | 2.2% | ||
| Collections From Reimbursing Employers: | ||||
| Percentage Of Tax Due Paid Timely | 82.4% | 80.6% | ||
| Turnover Ratio - Ratio Of Receivables Liquidated Or Declared Uncollectible/Doubtful To Tax Due | 15.2% | 19.4% | ||
| Percentage of Tax Due Declared Uncollectible/Doubtful | 0.0% | 1.2% | ||
| Accounts Receivable As A Percentage Of Tax Due | 3.8% | 4.6% | ||
| Appropriate Actions Taken To Collect Tax Due? | F | 48.9% Pass | ||
| Cashiering | ||||
| Remittances Deposited Within Three Days? | P | 92.0% Pass | ||
| Field Audit | ||||
| Percent Change In Total Wages Resulting From Audits | 1.7% | 5.0% | ||
| Percentage Of Contributory Employers Audited | 2.3% | 2.0% | ||
| Annualized Percentage Of Total Wages Audited | 1.5% | 1.8% | ||
| Audits Meet Employment Security Manual Requirements? | P | 64.6% Pass | ||
| Account Maintenance | ||||
| Accuracy In Report Processing? | P | 96.0% Pass | ||
| Accuracy In Contributory Employer Billing? | P | 84.8% Pass | ||
| Accuracy In Reimbursing Employer Billings? | P | 85.7% Pass | ||
| Accuracy In Credits/Refunds? | P | 73.9% Pass | ||
| Accuracy In Benefit Charging? | P | 89.6% Pass | ||
| Accuracy In Experience Rating? | P | 87.8% Pass | ||

| Vermont | ||||
| REPORTED MEASURE | WORKLOAD | STATE RESULTS |
NATIONAL RESULTS |
CRITERION |
|---|---|---|---|---|
| First Payment Timeliness | ||||
| Intrastate UI, full weeks - 14/21 Days | 16,286 | 91.3% | 90.1% | 87% |
| Intrastate UI, full weeks - 35 Days | 16,286 | 98.1% | 97.2% | 93% |
| Interstate UI, full weeks - 14/21 Days | 503 | 77.3% | 78.4% | 70% |
| Interstate UI, full weeks - 35 Days | 503 | 95.2% | 92.4% | 78% |
| All First Payments - 14/21 Days | 18,941 | 91.0% | 89.2% | 90% (Fiscal Year '02) |
| All First Payments - 35 Days | 18,941 | 98.0% | 97.0% | 95% (Fiscal Year '02) |
| Nonmonetary Determinations Timeliness: Detection Date to Determination Date |
||||
| Nonseparation Determ. within 14 Days | 5,176 | 74.3% | 68.6% | 80% (Fiscal Year '02) |
| Separation Determ. within 21 Days | 7,189 | 55.8% | 73.3% | 80% (Fiscal Year '02) |
| Nonmonetary Issue Detection Timeliness: First Week Affected to Detection Date |
||||
| Nonseparation Issues within 14 Days | 2,770 | 63.0% | 63.1% | none |
| Separation Issues within 21 Days | 2,184 | 66.6% | 90.7% | none |
| Lower Authority Appeals Timeliness | ||||
| Decisions within 30 Days of Filing | 1,481 | 68.9% | 67.9% | 60% |
| Decisions within 45 Days of Filing | 1,481 | 88.8% | 85.4% | 80% |
| Decisions within 90 Days of Filing | 1,481 | 97.3% | 95.5% | 95% (Fiscal Year '02) |
| Higher Authority Appeals Timeliness | ||||
| Decisions within 45 Days of Filing | 233 | 67.8% | 62.7% | 50% (Fiscal Year '00) |
| Decisions within 75 Days of Filing | 233 | 91.8% | 85.6% | 80% (Fiscal Year '00) |
| Decisions within 150 Days of Filing | 233 | 98.7% | 96.3% | 95% (Fiscal Year '00) |
| Combined Wage Program Timeliness | ||||
| Wage Transfers Made within 3 Days | 2,340 | 56.3% | 69.8% | none |
| Wage Transfers Made within 14 Days | 2,340 | 83.5% | 97.3% | none |
| Billing Made within 45 Days | 0 | 0.0% | 92.6% | none |
| Reimbursements Made within 45 Days | 0 | 0.0% | 96.4% | none |
| Continued Claims Payment Timeliness | ||||
| Payments Made within 7 Days | 261,484 | 95.5% | 61.4% | none |
| Payments Made within 14 Days | 261,484 | 97.8% | 92.5% | none |
| Payments Made within 21 Days | 261,484 | 98.7% | 96.3% | none |
| Benefit Quality Measures | ||||
| Nonmon. Determin. with Scores > 80% | 225 | 84.1% | 70.9% | 75% (Fiscal Year '02) |
| LA Appeals with Scores >= 85% | 83 | 100.0% | 90.5% | 80% (Fiscal Year '00) |
| Benefit Payment Control | ||||
| Fraud Overpayment Recovery Rate | 234,502 | 74.1% | 50.9% | none |
| Nonfraud Overpayment Recovery Rate | 902,185 | 47.8% | 56.1% | none |
| Vermont | ||||
| REPORTED MEASURE | STATE RESULTS | NATIONAL RESULTS | CRITERION | |
|---|---|---|---|---|
| Cash Management | ||||
| Average time (days) funds are on deposit before being transferred to Trust Fund | 1.4 | 2.1 days | <= 2 (Fiscal Year '00) | |
| Ratio of avg daily loanable balance in Clearing Account to avg daily transfer to Tust Fund | 0.29 | 1.70 | <= 1.75 (Fiscal Year '02) | |
| Benefit Accuracy Measurement | ||||
| Total Dollars Paid in Population | $40,587,206 | $18.8 B | none | |
| Sample Size | 392 | 26,353 | none | |
| Proper Payment Rate | 93.5 +/- 2.4 | 91.5% | none | |
| Overpayment Rate | 6.5 +/- 2.4 | 8.5% | none | |
| Underpayment Rate | 0.6 +/- 0.3 | 0.9% | none | |
| Footnotes: | #5 | |||
| Vermont | ||||
| REPORTED MEASURE | STATE RESULTS | NATIONAL RESULTS | ||
|---|---|---|---|---|
| Status Determinations | ||||
| New Employer Determinations: | ||||
| Percentage Made Within 90 Days (Fiscal Year '00 criterion: 60%) | 76.6% | 78.0% | ||
| Percentage Made Within 180 Days (Fiscal Year '00 criterion: 80%) | 88.3% | 89.7% | ||
| Accuracy In Determinations? (Fiscal Year '02 criterion: <= 6 failed) | F | 45.8% Pass | ||
| Accuracy In Postings? | F | 39.6% Pass | ||
| Successor Determinations: | ||||
| Percentage Made Within 90 Days | 77.0% | 67.0% | ||
| Percentage Made Within 180 Days | 89.4% | 81.5% | ||
| Accuracy In Determinations? | F | 54.2% Pass | ||
| Accuracy In Postings? | F | 45.8% Pass | ||
| Inactivations: | ||||
| Accuracy In Determinations? | P | 64.4% Pass | ||
| Accuracy In Postings? | P | 64.6% Pass | ||
| Report Delinquency | ||||
| Reports From Contributory Employers: | ||||
| Percentage Filed Timely | 91.0% | 87.4% | ||
| Percentage Secured | 99.2% | 92.5% | ||
| Percentage Resolved | 102.0% | 97.1% | ||
| Reports From Reimbursing Employers: | ||||
| Percentage Filed Timely | 96.5% | 79.8% | ||
| Percentage Secured | 99.9% | 85.9% | ||
| Percentage Resolved | 102.0% | 87.5% | ||
| Appropriate Actions Taken To Resolve Delinquencies? | P | 76.6% Pass | ||
| Collections | ||||
| Collections From Contributory Employers: | ||||
| Percentage Of Tax Due Paid Timely | 88.3% | 92.0% | ||
| Turnover Ratio - Ratio Of Receivables Liquidated Or Declared Uncollectible/Doubtful To Tax Due | 11.9% | 8.1% | ||
| Percentage of Tax Due Declared Uncollectible/Doubtful | 2.5% | 1.3% | ||
| Accounts Receivable As A Percentage Of Tax Due | 0.9% | 2.2% | ||
| Collections From Reimbursing Employers: | ||||
| Percentage Of Tax Due Paid Timely | 92.0% | 80.6% | ||
| Turnover Ratio - Ratio Of Receivables Liquidated Or Declared Uncollectible/Doubtful To Tax Due | 7.6% | 19.4% | ||
| Percentage of Tax Due Declared Uncollectible/Doubtful | 4.4% | 1.2% | ||
| Accounts Receivable As A Percentage Of Tax Due | 1.3% | 4.6% | ||
| Appropriate Actions Taken To Collect Tax Due? | F | 48.9% Pass | ||
| Cashiering | ||||
| Remittances Deposited Within Three Days? | P | 92.0% Pass | ||
| Field Audit | ||||
| Percent Change In Total Wages Resulting From Audits | 0.8% | 5.0% | ||
| Percentage Of Contributory Employers Audited | 3.5% | 2.0% | ||
| Annualized Percentage Of Total Wages Audited | 2.9% | 1.8% | ||
| Audits Meet Employment Security Manual Requirements? | P | 64.6% Pass | ||
| Account Maintenance | ||||
| Accuracy In Report Processing? | P | 96.0% Pass | ||
| Accuracy In Contributory Employer Billing? | P | 84.8% Pass | ||
| Accuracy In Reimbursing Employer Billings? | P | 85.7% Pass | ||
| Accuracy In Credits/Refunds? | P | 73.9% Pass | ||
| Accuracy In Benefit Charging? | P | 89.6% Pass | ||
| Accuracy In Experience Rating? | P | 87.8% Pass | ||
| Virginia | ||||
| REPORTED MEASURE | WORKLOAD | STATE RESULTS |
NATIONAL RESULTS |
CRITERION |
|---|---|---|---|---|
| First Payment Timeliness | ||||
| Intrastate UI, full weeks - 14/21 Days | 86,249 | 94.4% | 90.1% | 87% |
| Intrastate UI, full weeks - 35 Days | 86,249 | 98.7% | 97.2% | 93% |
| Interstate UI, full weeks - 14/21 Days | 5,192 | 83.1% | 78.4% | 70% |
| Interstate UI, full weeks - 35 Days | 5,192 | 95.5% | 92.4% | 78% |
| All First Payments - 14/21 Days | 104,881 | 93.0% | 89.2% | 90% (Fiscal Year '02) |
| All First Payments - 35 Days | 104,881 | 98.6% | 97.0% | 95% (Fiscal Year '02) |
| Nonmonetary Determinations Timeliness: Detection Date to Determination Date |
||||
| Nonseparation Determ. within 14 Days | 38,365 | 92.6% | 68.6% | 80% (Fiscal Year '02) |
| Separation Determ. within 21 Days | 53,449 | 81.0% | 73.3% | 80% (Fiscal Year '02) |
| Nonmonetary Issue Detection Timeliness: First Week Affected to Detection Date |
||||
| Nonseparation Issues within 14 Days | 38,365 | 65.5% | 63.1% | none |
| Separation Issues within 21 Days | 53,449 | 46.6% | 90.7% | none |
| Lower Authority Appeals Timeliness | ||||
| Decisions within 30 Days of Filing | 11,944 | 84.9% | 67.9% | 60% |
| Decisions within 45 Days of Filing | 11,944 | 95.2% | 85.4% | 80% |
| Decisions within 90 Days of Filing | 11,944 | 99.5% | 95.5% | 95% (Fiscal Year '02) |
| Higher Authority Appeals Timeliness | ||||
| Decisions within 45 Days of Filing | 2,234 | 63.7% | 62.7% | 50% (Fiscal Year '00) |
| Decisions within 75 Days of Filing | 2,234 | 89.3% | 85.6% | 80% (Fiscal Year '00) |
| Decisions within 150 Days of Filing | 2,234 | 93.7% | 96.3% | 95% (Fiscal Year '00) |
| Combined Wage Program Timeliness | ||||
| Wage Transfers Made within 3 Days | 19,075 | 65.9% | 69.8% | none |
| Wage Transfers Made within 14 Days | 19,075 | 99.4% | 97.3% | none |
| Billing Made within 45 Days | 0 | 0.0% | 92.6% | none |
| Reimbursements Made within 45 Days | 0 | 0.0% | 96.4% | none |
| Continued Claims Payment Timeliness | ||||
| Payments Made within 7 Days | 948,550 | 60.4% | 61.4% | none |
| Payments Made within 14 Days | 948,550 | 89.4% | 92.5% | none |
| Payments Made within 21 Days | 948,550 | 96.4% | 96.3% | none |
| Benefit Quality Measures | ||||
| Nonmon. Determin. with Scores > 80% | 388 | 70.5% | 70.9% | 75% (Fiscal Year '02) |
| LA Appeals with Scores >= 85% | 80 | 100.0% | 90.5% | 80% (Fiscal Year '00) |
| Benefit Payment Control | ||||
| Fraud Overpayment Recovery Rate | 724,375 | 74.1% | 50.9% | none |
| Nonfraud Overpayment Recovery Rate | 4,178,666 | 61.7% | 56.1% | none |
| Virginia | ||||
| REPORTED MEASURE | STATE RESULTS | NATIONAL RESULTS | CRITERION | |
|---|---|---|---|---|
| Cash Management | ||||
| Average time (days) funds are on deposit before being transferred to Trust Fund | 3.5 | 2.1 days | <= 2 (Fiscal Year '00) | |
| Ratio of avg daily loanable balance in Clearing Account to avg daily transfer to Tust Fund | 3.47 | 1.70 | <= 1.75 (Fiscal Year '02) | |
| Benefit Accuracy Measurement | ||||
| Total Dollars Paid in Population | $171,338,443 | $18.8 B | none | |
| Sample Size | 519 | 26,353 | none | |
| Proper Payment Rate | 80.8 +/- 3.5 | 91.5% | none | |
| Overpayment Rate | 19.2 +/- 3.5 | 8.5% | none | |
| Underpayment Rate | 0.3 +/- 0.2 | 0.9% | none | |
| Footnotes: | #5 | |||
| Virginia | ||||
| REPORTED MEASURE | STATE RESULTS | NATIONAL RESULTS | ||
|---|---|---|---|---|
| Status Determinations | ||||
| New Employer Determinations: | ||||
| Percentage Made Within 90 Days (Fiscal Year '00 criterion: 60%) | 75.9% | 78.0% | ||
| Percentage Made Within 180 Days (Fiscal Year '00 criterion: 80%) | 87.6% | 89.7% | ||
| Accuracy In Determinations? (Fiscal Year '02 criterion: <= 6 failed) | F | 45.8% Pass | ||
| Accuracy In Postings? | F | 39.6% Pass | ||
| Successor Determinations: | ||||
| Percentage Made Within 90 Days | 69.2% | 67.0% | ||
| Percentage Made Within 180 Days | 82.9% | 81.5% | ||
| Accuracy In Determinations? | F | 54.2% Pass | ||
| Accuracy In Postings? | F | 45.8% Pass | ||
| Inactivations: | ||||
| Accuracy In Determinations? | F | 64.4% Pass | ||
| Accuracy In Postings? | F | 64.6% Pass | ||
| Report Delinquency | ||||
| Reports From Contributory Employers: | ||||
| Percentage Filed Timely | 77.2% | 87.4% | ||
| Percentage Secured | 79.6% | 92.5% | ||
| Percentage Resolved | 86.2% | 97.1% | ||
| Reports From Reimbursing Employers: | ||||
| Percentage Filed Timely | 95.5% | 79.8% | ||
| Percentage Secured | 97.1% | 85.9% | ||
| Percentage Resolved | 99.9% | 87.5% | ||
| Appropriate Actions Taken To Resolve Delinquencies? | F | 76.6% Pass | ||
| Collections | ||||
| Collections From Contributory Employers: | ||||
| Percentage Of Tax Due Paid Timely | 92.9% | 92.0% | ||
| Turnover Ratio - Ratio Of Receivables Liquidated Or Declared Uncollectible/Doubtful To Tax Due | 7.8% | 8.1% | ||
| Percentage of Tax Due Declared Uncollectible/Doubtful | 2.0% | 1.3% | ||
| Accounts Receivable As A Percentage Of Tax Due | 2.8% | 2.2% | ||
| Collections From Reimbursing Employers: | ||||
| Percentage Of Tax Due Paid Timely | 2.7% | 80.6% | ||
| Turnover Ratio - Ratio Of Receivables Liquidated Or Declared Uncollectible/Doubtful To Tax Due | 97.5% | 19.4% | ||
| Percentage of Tax Due Declared Uncollectible/Doubtful | 7.3% | 1.2% | ||
| Accounts Receivable As A Percentage Of Tax Due | 3.8% | 4.6% | ||
| Appropriate Actions Taken To Collect Tax Due? | F | 48.9% Pass | ||
| Cashiering | ||||
| Remittances Deposited Within Three Days? | P | 92.0% Pass | ||
| Field Audit | ||||
| Percent Change In Total Wages Resulting From Audits | 2.7% | 5.0% | ||
| Percentage Of Contributory Employers Audited | 2.1% | 2.0% | ||
| Annualized Percentage Of Total Wages Audited | 0.8% | 1.8% | ||
| Audits Meet Employment Security Manual Requirements? | F | 64.6% Pass | ||
| Account Maintenance | ||||
| Accuracy In Report Processing? | P | 96.0% Pass | ||
| Accuracy In Contributory Employer Billing? | P | 84.8% Pass | ||
| Accuracy In Reimbursing Employer Billings? | ** | 85.7% Pass | ||
| Accuracy In Credits/Refunds? | F | 73.9% Pass | ||
| Accuracy In Benefit Charging? | P | 89.6% Pass | ||
| Accuracy In Experience Rating? | F | 87.8% Pass | ||
** State had a problem in establishing the sample universe.
| Virgin Islands | ||||
| REPORTED MEASURE | WORKLOAD | STATE RESULTS |
NATIONAL RESULTS |
CRITERION |
|---|---|---|---|---|
| First Payment Timeliness | ||||
| Intrastate UI, full weeks - 14/21 Days | 1,326 | 79.9% | 90.1% | 87% |
| Intrastate UI, full weeks - 35 Days | 1,326 | 95.6% | 97.2% | 93% |
| Interstate UI, full weeks - 14/21 Days | 55 | 30.9% | 78.4% | 70% |
| Interstate UI, full weeks - 35 Days | 55 | 78.2% | 92.4% | 78% |
| All First Payments - 14/21 Days | 1,593 | 80.0% | 89.2% | 90% (Fiscal Year '02) |
| All First Payments - 35 Days | 1,593 | 95.4% | 97.0% | 95% (Fiscal Year '02) |
| Nonmonetary Determinations Timeliness: Detection Date to Determination Date |
||||
| Nonseparation Determ. within 14 Days | 371 | 85.4% | 68.6% | 80% (Fiscal Year '02) |
| Separation Determ. within 21 Days | 430 | 80.7% | 73.3% | 80% (Fiscal Year '02) |
| Nonmonetary Issue Detection Timeliness: First Week Affected to Detection Date |
||||
| Nonseparation Issues within 14 Days | 330 | 95.8% | 63.1% | none |
| Separation Issues within 21 Days | 473 | 87.5% | 90.7% | none |
| Lower Authority Appeals Timeliness | ||||
| Decisions within 30 Days of Filing | 96 | 70.8% | 67.9% | 60% |
| Decisions within 45 Days of Filing | 96 | 89.6% | 85.4% | 80% |
| Decisions within 90 Days of Filing | 96 | 96.9% | 95.5% | 95% (Fiscal Year '02) |
| Higher Authority Appeals Timeliness | ||||
| Decisions within 45 Days of Filing | + | + | 62.7% | 50% (Fiscal Year '00) |
| Decisions within 75 Days of Filing | + | + | 85.6% | 80% (Fiscal Year '00) |
| Decisions within 150 Days of Filing | + | + | 96.3% | 95% (Fiscal Year '00) |
| Combined Wage Program Timeliness | ||||
| Wage Transfers Made within 3 Days | 245 | 12.7% | 69.8% | none |
| Wage Transfers Made within 14 Days | 245 | 108.2% | 97.3% | none |
| Billing Made within 45 Days | 13 | 100.0% | 92.6% | none |
| Reimbursements Made within 45 Days | 0 | 0.0% | 96.4% | none |
| Continued Claims Payment Timeliness | ||||
| Payments Made within 7 Days | 26,248 | 30.7% | 61.4% | none |
| Payments Made within 14 Days | 26,248 | 71.4% | 92.5% | none |
| Payments Made within 21 Days | 26,248 | 89.0% | 96.3% | none |
| Benefit Quality Measures | ||||
| Nonmon. Determin. with Scores > 80% | 70.9% | 75% (Fiscal Year '02) | ||
| LA Appeals with Scores >= 85% | 0 | 0.0% | 90.5% | 80% (Fiscal Year '00) |
| Benefit Payment Control | ||||
| Fraud Overpayment Recovery Rate | 9,204 | 38.5% | 50.9% | none |
| Nonfraud Overpayment Recovery Rate | 17,043 | 61.7% | 56.1% | none |
+ Virgin Islands does not have higher authority appeals.
| Virgin Islands | ||||
| REPORTED MEASURE | STATE RESULTS | NATIONAL RESULTS | CRITERION | |
|---|---|---|---|---|
| Cash Management | ||||
| Average time (days) funds are on deposit before being transferred to Trust Fund | 0.1 | 2.1 days | <= 2 (Fiscal Year '00) | |
| Ratio of avg daily loanable balance in Clearing Account to avg daily transfer to Tust Fund | 5.30 | 1.70 | <= 1.75 (Fiscal Year '02) | |
| Benefit Accuracy Measurement | ||||
| Total Dollars Paid in Population | ^ | $18.8 B | none | |
| Sample Size | ^ | 26,353 | none | |
| Proper Payment Rate | ^ | 91.5% | none | |
| Overpayment Rate | ^ | 8.5% | none | |
| Underpayment Rate | ^ | 0.9% | none | |
| Footnotes: | ^ | |||
^ Virgin Islands does not operate a BAM program.

| Virgin Islands | ||||
| REPORTED MEASURE | STATE RESULTS | NATIONAL RESULTS | ||
|---|---|---|---|---|
| Status Determinations | ||||
| New Employer Determinations: | ||||
| Percentage Made Within 90 Days (Fiscal Year '00 criterion: 60%) | ^ | 78.0% | ||
| Percentage Made Within 180 Days (Fiscal Year '00 criterion: 80%) | ^ | 89.7% | ||
| Accuracy In Determinations? (Fiscal Year '02 criterion: <= 6 failed) | ^ | 45.8% Pass | ||
| Accuracy In Postings? | ^ | 39.6% Pass | ||
| Successor Determinations: | ||||
| Percentage Made Within 90 Days | ^ | 67.0% | ||
| Percentage Made Within 180 Days | ^ | 81.5% | ||
| Accuracy In Determinations? | ^ | 54.2% Pass | ||
| Accuracy In Postings? | ^ | 45.8% Pass | ||
| Inactivations: | ||||
| Accuracy In Determinations? | ^ | 64.4% Pass | ||
| Accuracy In Postings? | ^ | 64.6% Pass | ||
| Report Delinquency | ||||
| Reports From Contributory Employers: | ||||
| Percentage Filed Timely | ^ | 87.4% | ||
| Percentage Secured | ^ | 92.5% | ||
| Percentage Resolved | ^ | 97.1% | ||
| Reports From Reimbursing Employers: | ||||
| Percentage Filed Timely | ^ | 79.8% | ||
| Percentage Secured | ^ | 85.9% | ||
| Percentage Resolved | ^ | 87.5% | ||
| Appropriate Actions Taken To Resolve Delinquencies? | ^ | 76.6% Pass | ||
| Collections | ||||
| Collections From Contributory Employers: | ||||
| Percentage Of Tax Due Paid Timely | ^ | 92.0% | ||
| Turnover Ratio - Ratio Of Receivables Liquidated Or Declared Uncollectible/Doubtful To Tax Due | ^ | 8.1% | ||
| Percentage of Tax Due Declared Uncollectible/Doubtful | ^ | 1.3% | ||
| Accounts Receivable As A Percentage Of Tax Due | ^ | 2.2% | ||
| Collections From Reimbursing Employers: | ||||
| Percentage Of Tax Due Paid Timely | ^ | 80.6% | ||
| Turnover Ratio - Ratio Of Receivables Liquidated Or Declared Uncollectible/Doubtful To Tax Due | ^ | 19.4% | ||
| Percentage of Tax Due Declared Uncollectible/Doubtful | ^ | 1.2% | ||
| Accounts Receivable As A Percentage Of Tax Due | ^ | 4.6% | ||
| Appropriate Actions Taken To Collect Tax Due? | ^ | 48.9% Pass | ||
| Cashiering | ||||
| Remittances Deposited Within Three Days? | ^ | 92.0% Pass | ||
| Field Audit | ||||
| Percent Change In Total Wages Resulting From Audits | ^ | 5.0% | ||
| Percentage Of Contributory Employers Audited | ^ | 2.0% | ||
| Annualized Percentage Of Total Wages Audited | ^ | 1.8% | ||
| Audits Meet Employment Security Manual Requirements? | ^ | 64.6% Pass | ||
| Account Maintenance | ||||
| Accuracy In Report Processing? | ^ | 96.0% Pass | ||
| Accuracy In Contributory Employer Billing? | ^ | 84.8% Pass | ||
| Accuracy In Reimbursing Employer Billings? | ^ | 85.7% Pass | ||
| Accuracy In Credits/Refunds? | ^ | 73.9% Pass | ||
| Accuracy In Benefit Charging? | ^ | 89.6% Pass | ||
| Accuracy In Experience Rating? | ^ | 87.8% Pass | ||
^ Virgin Islands does not participate in the Tax Performance System.
| Washington | ||||
| REPORTED MEASURE | WORKLOAD | STATE RESULTS |
NATIONAL RESULTS |
CRITERION |
|---|---|---|---|---|
| First Payment Timeliness | ||||
| Intrastate UI, full weeks - 14/21 Days | 140,292 | 96.5% | 90.1% | 87% |
| Intrastate UI, full weeks - 35 Days | 140,292 | 99.1% | 97.2% | 93% |
| Interstate UI, full weeks - 14/21 Days | 6,902 | 86.5% | 78.4% | 70% |
| Interstate UI, full weeks - 35 Days | 6,902 | 97.1% | 92.4% | 78% |
| All First Payments - 14/21 Days | 172,347 | 95.9% | 89.2% | 90% (Fiscal Year '02) |
| All First Payments - 35 Days | 172,347 | 99.0% | 97.0% | 95% (Fiscal Year '02) |
| Nonmonetary Determinations Timeliness: Detection Date to Determination Date |
||||
| Nonseparation Determ. within 14 Days | 72,693 | 84.8% | 68.6% | 80% (Fiscal Year '02) |
| Separation Determ. within 21 Days | 84,545 | 69.6% | 73.3% | 80% (Fiscal Year '02) |
| Nonmonetary Issue Detection Timeliness: First Week Affected to Detection Date |
||||
| Nonseparation Issues within 14 Days | 72,686 | 60.8% | 63.1% | none |
| Separation Issues within 21 Days | 84,542 | 95.5% | 90.7% | none |
| Lower Authority Appeals Timeliness | ||||
| Decisions within 30 Days of Filing | 24,759 | 65.8% | 67.9% | 60% |
| Decisions within 45 Days of Filing | 24,759 | 85.2% | 85.4% | 80% |
| Decisions within 90 Days of Filing | 24,759 | 95.9% | 95.5% | 95% (Fiscal Year '02) |
| Higher Authority Appeals Timeliness | ||||
| Decisions within 45 Days of Filing | 3,622 | 97.7% | 62.7% | 50% (Fiscal Year '00) |
| Decisions within 75 Days of Filing | 3,622 | 99.5% | 85.6% | 80% (Fiscal Year '00) |
| Decisions within 150 Days of Filing | 3,622 | 100.0% | 96.3% | 95% (Fiscal Year '00) |
| Combined Wage Program Timeliness | ||||
| Wage Transfers Made within 3 Days | 14,947 | 0.0% | 69.8% | none |
| Wage Transfers Made within 14 Days | 14,947 | 99.0% | 97.3% | none |
| Billing Made within 45 Days | 205 | 100.0% | 92.6% | none |
| Reimbursements Made within 45 Days | 166 | 0.0% | 96.4% | none |
| Continued Claims Payment Timeliness | ||||
| Payments Made within 7 Days | 3,215,662 | 93.0% | 61.4% | none |
| Payments Made within 14 Days | 3,215,662 | 98.3% | 92.5% | none |
| Payments Made within 21 Days | 3,215,662 | 99.2% | 96.3% | none |
| Benefit Quality Measures | ||||
| Nonmon. Determin. with Scores > 80% | 384 | 54.9% | 70.9% | 75% (Fiscal Year '02) |
| LA Appeals with Scores >= 85% | 75 | 96.2% | 90.5% | 80% (Fiscal Year '00) |
| Benefit Payment Control | ||||
| Fraud Overpayment Recovery Rate | 9,320,856 | 38.5% | 50.9% | none |
| Nonfraud Overpayment Recovery Rate | 12,837,196 | 61.7% | 56.1% | none |
| Washington | ||||
| REPORTED MEASURE | STATE RESULTS | NATIONAL RESULTS | CRITERION | |
|---|---|---|---|---|
| Cash Management | ||||
| Average time (days) funds are on deposit before being transferred to Trust Fund | 2.3 | 2.1 days | <= 2 (Fiscal Year '00) | |
| Ratio of avg daily loanable balance in Clearing Account to avg daily transfer to Tust Fund | 2.00 | 1.70 | <= 1.75 (Fiscal Year '02) | |
| Benefit Accuracy Measurement | ||||
| Total Dollars Paid in Population | $757,297,003 | $18.8 B | none | |
| Sample Size | 538 | 26,353 | none | |
| Proper Payment Rate | 88.5 +/- 2.9 | 91.5% | none | |
| Overpayment Rate | 11.5 +/- 2.9 | 8.5% | none | |
| Underpayment Rate | 0.6 +/- 0.3 | 0.9% | none | |
| Footnotes: | #1 | |||
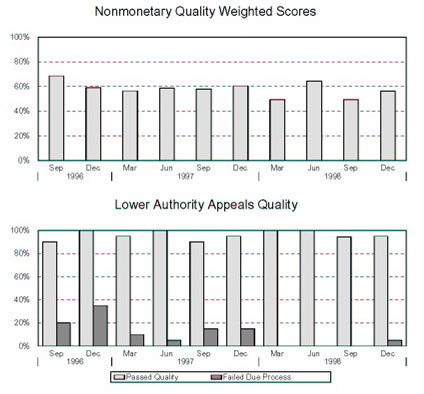
| Washington | ||||
| REPORTED MEASURE | STATE RESULTS | NATIONAL RESULTS | ||
|---|---|---|---|---|
| Status Determinations | ||||
| New Employer Determinations: | ||||
| Percentage Made Within 90 Days (Fiscal Year '00 criterion: 60%) | 86.7% | 78.0% | ||
| Percentage Made Within 180 Days (Fiscal Year '00 criterion: 80%) | 94.2% | 89.7% | ||
| Accuracy In Determinations? (Fiscal Year '02 criterion: <= 6 failed) | F | 45.8% Pass | ||
| Accuracy In Postings? | F | 39.6% Pass | ||
| Successor Determinations: | ||||
| Percentage Made Within 90 Days | 94.8% | 67.0% | ||
| Percentage Made Within 180 Days | 97.8% | 81.5% | ||
| Accuracy In Determinations? | F | 54.2% Pass | ||
| Accuracy In Postings? | F | 45.8% Pass | ||
| Inactivations: | ||||
| Accuracy In Determinations? | F | 64.4% Pass | ||
| Accuracy In Postings? | F | 64.6% Pass | ||
| Report Delinquency | ||||
| Reports From Contributory Employers: | ||||
| Percentage Filed Timely | 82.3% | 87.4% | ||
| Percentage Secured | 96.4% | 92.5% | ||
| Percentage Resolved | 96.0% | 97.1% | ||
| Reports From Reimbursing Employers: | ||||
| Percentage Filed Timely | 86.2% | 79.8% | ||
| Percentage Secured | 88.2% | 85.9% | ||
| Percentage Resolved | 88.4% | 87.5% | ||
| Appropriate Actions Taken To Resolve Delinquencies? | P | 76.6% Pass | ||
| Collections | ||||
| Collections From Contributory Employers: | ||||
| Percentage Of Tax Due Paid Timely | 99.1% | 92.0% | ||
| Turnover Ratio - Ratio Of Receivables Liquidated Or Declared Uncollectible/Doubtful To Tax Due | 1.0% | 8.1% | ||
| Percentage of Tax Due Declared Uncollectible/Doubtful | 0.4% | 1.3% | ||
| Accounts Receivable As A Percentage Of Tax Due | 0.9% | 2.2% | ||
| Collections From Reimbursing Employers: | ||||
| Percentage Of Tax Due Paid Timely | 99.7% | 80.6% | ||
| Turnover Ratio - Ratio Of Receivables Liquidated Or Declared Uncollectible/Doubtful To Tax Due | 0.5% | 19.4% | ||
| Percentage of Tax Due Declared Uncollectible/Doubtful | 0.1% | 1.2% | ||
| Accounts Receivable As A Percentage Of Tax Due | 0.1% | 4.6% | ||
| Appropriate Actions Taken To Collect Tax Due? | F | 48.9% Pass | ||
| Cashiering | ||||
| Remittances Deposited Within Three Days? | P | 92.0% Pass | ||
| Field Audit | ||||
| Percent Change In Total Wages Resulting From Audits | 1.5% | 5.0% | ||
| Percentage Of Contributory Employers Audited | 5.2% | 2.0% | ||
| Annualized Percentage Of Total Wages Audited | 3.6% | 1.8% | ||
| Audits Meet Employment Security Manual Requirements? | P | 64.6% Pass | ||
| Account Maintenance | ||||
| Accuracy In Report Processing? | P | 96.0% Pass | ||
| Accuracy In Contributory Employer Billing? | P | 84.8% Pass | ||
| Accuracy In Reimbursing Employer Billings? | P | 85.7% Pass | ||
| Accuracy In Credits/Refunds? | P | 73.9% Pass | ||
| Accuracy In Benefit Charging? | F | 89.6% Pass | ||
| Accuracy In Experience Rating? | P | 87.8% Pass | ||
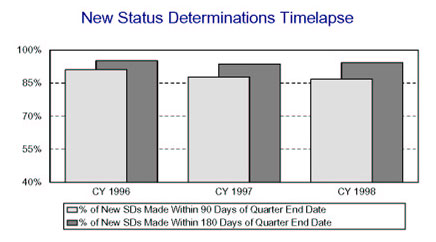
| West Virginia | ||||
| REPORTED MEASURE | WORKLOAD | STATE RESULTS |
NATIONAL RESULTS |
CRITERION |
|---|---|---|---|---|
| First Payment Timeliness | ||||
| Intrastate UI, full weeks - 14/21 Days | 43,078 | 92.9% | 90.1% | 87% |
| Intrastate UI, full weeks - 35 Days | 43,078 | 97.8% | 97.2% | 93% |
| Interstate UI, full weeks - 14/21 Days | 1,171 | 84.4% | 78.4% | 70% |
| Interstate UI, full weeks - 35 Days | 1,171 | 95.8% | 92.4% | 78% |
| All First Payments - 14/21 Days | 50,981 | 91.4% | 89.2% | 90% (Fiscal Year '02) |
| All First Payments - 35 Days | 50,981 | 97.9% | 97.0% | 95% (Fiscal Year '02) |
| Nonmonetary Determinations Timeliness: Detection Date to Determination Date |
||||
| Nonseparation Determ. within 14 Days | 11,346 | 89.8% | 68.6% | 80% (Fiscal Year '02) |
| Separation Determ. within 21 Days | 16,224 | 97.8% | 73.3% | 80% (Fiscal Year '02) |
| Nonmonetary Issue Detection Timeliness: First Week Affected to Detection Date |
||||
| Nonseparation Issues within 14 Days | 11,346 | 81.5% | 63.1% | none |
| Separation Issues within 21 Days | 16,224 | 98.4% | 90.7% | none |
| Lower Authority Appeals Timeliness | ||||
| Decisions within 30 Days of Filing | 4,381 | 68.2% | 67.9% | 60% |
| Decisions within 45 Days of Filing | 4,381 | 90.5% | 85.4% | 80% |
| Decisions within 90 Days of Filing | 4,381 | 98.4% | 95.5% | 95% (Fiscal Year '02) |
| Higher Authority Appeals Timeliness | ||||
| Decisions within 45 Days of Filing | 781 | 89.2% | 62.7% | 50% (Fiscal Year '00) |
| Decisions within 75 Days of Filing | 781 | 98.7% | 85.6% | 80% (Fiscal Year '00) |
| Decisions within 150 Days of Filing | 781 | 99.9% | 96.3% | 95% (Fiscal Year '00) |
| Combined Wage Program Timeliness | ||||
| Wage Transfers Made within 3 Days | 7,234 | 100.0% | 69.8% | none |
| Wage Transfers Made within 14 Days | 7,234 | 100.0% | 97.3% | none |
| Billing Made within 45 Days | 195 | 100.0% | 92.6% | none |
| Reimbursements Made within 45 Days | 167 | 99.4% | 96.4% | none |
| Continued Claims Payment Timeliness | ||||
| Payments Made within 7 Days | 669,495 | 50.7% | 61.4% | none |
| Payments Made within 14 Days | 669,495 | 94.8% | 92.5% | none |
| Payments Made within 21 Days | 669,495 | 98.4% | 96.3% | none |
| Benefit Quality Measures | ||||
| Nonmon. Determin. with Scores > 80% | 179 | 93.5% | 70.9% | 75% (Fiscal Year '02) |
| LA Appeals with Scores >= 85% | 70 | 61.3% | 90.5% | 80% (Fiscal Year '00) |
| Benefit Payment Control | ||||
| Fraud Overpayment Recovery Rate | 795,135 | 38.5% | 50.9% | none |
| Nonfraud Overpayment Recovery Rate | 1,356,700 | 61.7% | 56.1% | none |
| West Virginia | ||||
| REPORTED MEASURE | STATE RESULTS | NATIONAL RESULTS | CRITERION | |
|---|---|---|---|---|
| Cash Management | ||||
| Average time (days) funds are on deposit before being transferred to Trust Fund | 1.8 | 2.1 days | <= 2 (Fiscal Year '00) | |
| Ratio of avg daily loanable balance in Clearing Account to avg daily transfer to Tust Fund | 1.28 | 1.70 | <= 1.75 (Fiscal Year '02) | |
| Benefit Accuracy Measurement | ||||
| Total Dollars Paid in Population | $125,223,397 | $18.8 B | none | |
| Sample Size | 480 | 26,353 | none | |
| Proper Payment Rate | 98.3 +/- 1 | 91.5% | none | |
| Overpayment Rate | 1.7 +/- 1 | 8.5% | none | |
| Underpayment Rate | 0.5 +/- 0.3 | 0.9% | none | |
| Footnotes: | none | |||
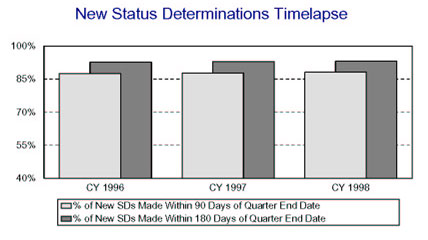
| West Virginia | ||||
| REPORTED MEASURE | STATE RESULTS | NATIONAL RESULTS | ||
|---|---|---|---|---|
| Status Determinations | ||||
| New Employer Determinations: | ||||
| Percentage Made Within 90 Days (Fiscal Year '00 criterion: 60%) | 88.1% | 78.0% | ||
| Percentage Made Within 180 Days (Fiscal Year '00 criterion: 80%) | 93.1% | 89.7% | ||
| Accuracy In Determinations? (Fiscal Year '02 criterion: <= 6 failed) | P | 45.8% Pass | ||
| Accuracy In Postings? | P | 39.6% Pass | ||
| Successor Determinations: | ||||
| Percentage Made Within 90 Days | 73.5% | 67.0% | ||
| Percentage Made Within 180 Days | 83.0% | 81.5% | ||
| Accuracy In Determinations? | P | 54.2% Pass | ||
| Accuracy In Postings? | P | 45.8% Pass | ||
| Inactivations: | ||||
| Accuracy In Determinations? | P | 64.4% Pass | ||
| Accuracy In Postings? | P | 64.6% Pass | ||
| Report Delinquency | ||||
| Reports From Contributory Employers: | ||||
| Percentage Filed Timely | 89.5% | 87.4% | ||
| Percentage Secured | 98.8% | 92.5% | ||
| Percentage Resolved | 103.1% | 97.1% | ||
| Reports From Reimbursing Employers: | ||||
| Percentage Filed Timely | 91.5% | 79.8% | ||
| Percentage Secured | 98.1% | 85.9% | ||
| Percentage Resolved | 99.6% | 87.5% | ||
| Appropriate Actions Taken To Resolve Delinquencies? | P | 76.6% Pass | ||
| Collections | ||||
| Collections From Contributory Employers: | ||||
| Percentage Of Tax Due Paid Timely | 88.6% | 92.0% | ||
| Turnover Ratio - Ratio Of Receivables Liquidated Or Declared Uncollectible/Doubtful To Tax Due | 11.7% | 8.1% | ||
| Percentage of Tax Due Declared Uncollectible/Doubtful | 4.6% | 1.3% | ||
| Accounts Receivable As A Percentage Of Tax Due | 3.5% | 2.2% | ||
| Collections From Reimbursing Employers: | ||||
| Percentage Of Tax Due Paid Timely | 85.4% | 80.6% | ||
| Turnover Ratio - Ratio Of Receivables Liquidated Or Declared Uncollectible/Doubtful To Tax Due | 13.1% | 19.4% | ||
| Percentage of Tax Due Declared Uncollectible/Doubtful | 0.6% | 1.2% | ||
| Accounts Receivable As A Percentage Of Tax Due | 2.2% | 4.6% | ||
| Appropriate Actions Taken To Collect Tax Due? | P | 48.9% Pass | ||
| Cashiering | ||||
| Remittances Deposited Within Three Days? | P | 92.0% Pass | ||
| Field Audit | ||||
| Percent Change In Total Wages Resulting From Audits | 3.0% | 5.0% | ||
| Percentage Of Contributory Employers Audited | 4.0% | 2.0% | ||
| Annualized Percentage Of Total Wages Audited | 2.4% | 1.8% | ||
| Audits Meet Employment Security Manual Requirements? | P | 64.6% Pass | ||
| Account Maintenance | ||||
| Accuracy In Report Processing? | P | 96.0% Pass | ||
| Accuracy In Contributory Employer Billing? | P | 84.8% Pass | ||
| Accuracy In Reimbursing Employer Billings? | P | 85.7% Pass | ||
| Accuracy In Credits/Refunds? | P | 73.9% Pass | ||
| Accuracy In Benefit Charging? | P | 89.6% Pass | ||
| Accuracy In Experience Rating? | P | 87.8% Pass | ||
| Wisconsin | ||||
| REPORTED MEASURE | WORKLOAD | STATE RESULTS |
NATIONAL RESULTS |
CRITERION |
|---|---|---|---|---|
| First Payment Timeliness | ||||
| Intrastate UI, full weeks - 14/21 Days | 159,031 | 94.9% | 90.1% | 87% |
| Intrastate UI, full weeks - 35 Days | 159,031 | 97.9% | 97.2% | 93% |
| Interstate UI, full weeks - 14/21 Days | 3,830 | 89.2% | 78.4% | 70% |
| Interstate UI, full weeks - 35 Days | 3,830 | 95.7% | 92.4% | 78% |
| All First Payments - 14/21 Days | 218,844 | 94.4% | 89.2% | 90% (Fiscal Year '02) |
| All First Payments - 35 Days | 218,844 | 97.9% | 97.0% | 95% (Fiscal Year '02) |
| Nonmonetary Determinations Timeliness: Detection Date to Determination Date |
||||
| Nonseparation Determ. within 14 Days | 133,229 | 82.4% | 68.6% | 80% (Fiscal Year '02) |
| Separation Determ. within 21 Days | 111,326 | 86.9% | 73.3% | 80% (Fiscal Year '02) |
| Nonmonetary Issue Detection Timeliness: First Week Affected to Detection Date |
||||
| Nonseparation Issues within 14 Days | 133,229 | 74.6% | 63.1% | none |
| Separation Issues within 21 Days | 111,326 | 90.6% | 90.7% | none |
| Lower Authority Appeals Timeliness | ||||
| Decisions within 30 Days of Filing | 18,732 | 73.1% | 67.9% | 60% |
| Decisions within 45 Days of Filing | 18,732 | 90.7% | 85.4% | 80% |
| Decisions within 90 Days of Filing | 18,732 | 97.9% | 95.5% | 95% (Fiscal Year '02) |
| Higher Authority Appeals Timeliness | ||||
| Decisions within 45 Days of Filing | 2,371 | 46.0% | 62.7% | 50% (Fiscal Year '00) |
| Decisions within 75 Days of Filing | 2,371 | 73.7% | 85.6% | 80% (Fiscal Year '00) |
| Decisions within 150 Days of Filing | 2,371 | 90.2% | 96.3% | 95% (Fiscal Year '00) |
| Combined Wage Program Timeliness | ||||
| Wage Transfers Made within 3 Days | 6,280 | 89.9% | 69.8% | none |
| Wage Transfers Made within 14 Days | 6,280 | 96.6% | 97.3% | none |
| Billing Made within 45 Days | 202 | 100.0% | 92.6% | none |
| Reimbursements Made within 45 Days | 209 | 100.0% | 96.4% | none |
| Continued Claims Payment Timeliness | ||||
| Payments Made within 7 Days | 2,272,630 | 91.6% | 61.4% | none |
| Payments Made within 14 Days | 2,272,630 | 96.9% | 92.5% | none |
| Payments Made within 21 Days | 2,272,630 | 98.2% | 96.3% | none |
| Benefit Quality Measures | ||||
| Nonmon. Determin. with Scores > 80% | 372 | 70.0% | 70.9% | 75% (Fiscal Year '02) |
| LA Appeals with Scores >= 85% | 72 | 90.8% | 90.5% | 80% (Fiscal Year '00) |
| Benefit Payment Control | ||||
| Fraud Overpayment Recovery Rate | 4,167,471 | 62.5% | 50.9% | none |
| Nonfraud Overpayment Recovery Rate | 6,181,176 | 91.7% | 56.1% | none |
| Wisconsin | ||||
| REPORTED MEASURE | STATE RESULTS | NATIONAL RESULTS | CRITERION | |
|---|---|---|---|---|
| Cash Management | ||||
| Average time (days) funds are on deposit before being transferred to Trust Fund | 6.9 | 2.1 days | <= 2 (Fiscal Year '00) | |
| Ratio of avg daily loanable balance in Clearing Account to avg daily transfer to Tust Fund | 8.11 | 1.70 | <= 1.75 (Fiscal Year '02) | |
| Benefit Accuracy Measurement | ||||
| Total Dollars Paid in Population | $467,668,209 | $18.8 B | none | |
| Sample Size | 480 | 26,353 | none | |
| Proper Payment Rate | 92.2 +/- 2.6 | 91.5% | none | |
| Overpayment Rate | 7.8 +/- 2.6 | 8.5% | none | |
| Underpayment Rate | 0.7 +/- 0.4 | 0.9% | none | |
| Footnotes: | none | |||
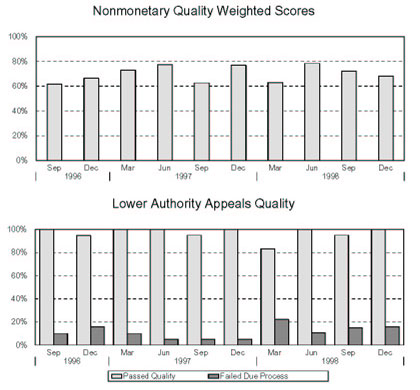
| Wisconsin | ||||
| REPORTED MEASURE | STATE RESULTS | NATIONAL RESULTS | ||
|---|---|---|---|---|
| Status Determinations | ||||
| New Employer Determinations: | ||||
| Percentage Made Within 90 Days (Fiscal Year '00 criterion: 60%) | 70.7% | 78.0% | ||
| Percentage Made Within 180 Days (Fiscal Year '00 criterion: 80%) | 86.3% | 89.7% | ||
| Accuracy In Determinations? (Fiscal Year '02 criterion: <= 6 failed) | F | 45.8% Pass | ||
| Accuracy In Postings? | F | 39.6% Pass | ||
| Successor Determinations: | ||||
| Percentage Made Within 90 Days | 80.1% | 67.0% | ||
| Percentage Made Within 180 Days | 90.9% | 81.5% | ||
| Accuracy In Determinations? | F | 54.2% Pass | ||
| Accuracy In Postings? | F | 45.8% Pass | ||
| Inactivations: | ||||
| Accuracy In Determinations? | P | 64.4% Pass | ||
| Accuracy In Postings? | P | 64.6% Pass | ||
| Report Delinquency | ||||
| Reports From Contributory Employers: | ||||
| Percentage Filed Timely | 92.5% | 87.4% | ||
| Percentage Secured | 96.9% | 92.5% | ||
| Percentage Resolved | 101.0% | 97.1% | ||
| Reports From Reimbursing Employers: | ||||
| Percentage Filed Timely | 96.4% | 79.8% | ||
| Percentage Secured | 98.9% | 85.9% | ||
| Percentage Resolved | 100.6% | 87.5% | ||
| Appropriate Actions Taken To Resolve Delinquencies? | P | 76.6% Pass | ||
| Collections | ||||
| Collections From Contributory Employers: | ||||
| Percentage Of Tax Due Paid Timely | 92.4% | 92.0% | ||
| Turnover Ratio - Ratio Of Receivables Liquidated Or Declared Uncollectible/Doubtful To Tax Due | 7.7% | 8.1% | ||
| Percentage of Tax Due Declared Uncollectible/Doubtful | 2.5% | 1.3% | ||
| Accounts Receivable As A Percentage Of Tax Due | 1.3% | 2.2% | ||
| Collections From Reimbursing Employers: | ||||
| Percentage Of Tax Due Paid Timely | 94.6% | 80.6% | ||
| Turnover Ratio - Ratio Of Receivables Liquidated Or Declared Uncollectible/Doubtful To Tax Due | 5.5% | 19.4% | ||
| Percentage of Tax Due Declared Uncollectible/Doubtful | 0.0% | 1.2% | ||
| Accounts Receivable As A Percentage Of Tax Due | 0.7% | 4.6% | ||
| Appropriate Actions Taken To Collect Tax Due? | P | 48.9% Pass | ||
| Cashiering | ||||
| Remittances Deposited Within Three Days? | P | 92.0% Pass | ||
| Field Audit | ||||
| Percent Change In Total Wages Resulting From Audits | 3.3% | 5.0% | ||
| Percentage Of Contributory Employers Audited | 2.1% | 2.0% | ||
| Annualized Percentage Of Total Wages Audited | 2.2% | 1.8% | ||
| Audits Meet Employment Security Manual Requirements? | P | 64.6% Pass | ||
| Account Maintenance | ||||
| Accuracy In Report Processing? | P | 96.0% Pass | ||
| Accuracy In Contributory Employer Billing? | P | 84.8% Pass | ||
| Accuracy In Reimbursing Employer Billings? | F | 85.7% Pass | ||
| Accuracy In Credits/Refunds? | P | 73.9% Pass | ||
| Accuracy In Benefit Charging? | P | 89.6% Pass | ||
| Accuracy In Experience Rating? | P | 87.8% Pass | ||
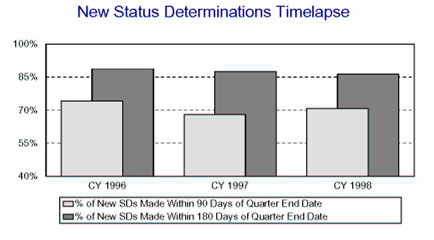
| Wyoming | ||||
| REPORTED MEASURE | WORKLOAD | STATE RESULTS |
NATIONAL RESULTS |
CRITERION |
|---|---|---|---|---|
| First Payment Timeliness | ||||
| Intrastate UI, full weeks - 14/21 Days | 9,729 | 96.1% | 90.1% | 87% |
| Intrastate UI, full weeks - 35 Days | 9,729 | 99.1% | 97.2% | 93% |
| Interstate UI, full weeks - 14/21 Days | 793 | 83.6% | 78.4% | 70% |
| Interstate UI, full weeks - 35 Days | 793 | 97.6% | 92.4% | 78% |
| All First Payments - 14/21 Days | 10,813 | 94.9% | 89.2% | 90% (Fiscal Year '02) |
| All First Payments - 35 Days | 10,813 | 98.9% | 97.0% | 95% (Fiscal Year '02) |
| Nonmonetary Determinations Timeliness: Detection Date to Determination Date |
||||
| Nonseparation Determ. within 14 Days | 7,838 | 88.5% | 68.6% | 80% (Fiscal Year '02) |
| Separation Determ. within 21 Days | 4,9.8 | 95.2% | 73.3% | 80% (Fiscal Year '02) |
| Nonmonetary Issue Detection Timeliness: First Week Affected to Detection Date |
||||
| Nonseparation Issues within 14 Days | 7,306 | 78.8% | 63.1% | none |
| Separation Issues within 21 Days | 1,967 | 80.9% | 90.7% | none |
| Lower Authority Appeals Timeliness | ||||
| Decisions within 30 Days of Filing | 1,226 | 90.5% | 67.9% | 60% |
| Decisions within 45 Days of Filing | 1,226 | 97.7% | 85.4% | 80% |
| Decisions within 90 Days of Filing | 1,226 | 99.7% | 95.5% | 95% (Fiscal Year '02) |
| Higher Authority Appeals Timeliness | ||||
| Decisions within 45 Days of Filing | 201 | 84.6% | 62.7% | 50% (Fiscal Year '00) |
| Decisions within 75 Days of Filing | 201 | 99.0% | 85.6% | 80% (Fiscal Year '00) |
| Decisions within 150 Days of Filing | 201 | 100.0% | 96.3% | 95% (Fiscal Year '00) |
| Combined Wage Program Timeliness | ||||
| Wage Transfers Made within 3 Days | 1,518 | 0.0% | 69.8% | none |
| Wage Transfers Made within 14 Days | 1,518 | 92.2% | 97.3% | none |
| Billing Made within 45 Days | 186 | 100.0% | 92.6% | none |
| Reimbursements Made within 45 Days | 172 | 93.6% | 96.4% | none |
| Continued Claims Payment Timeliness | ||||
| Payments Made within 7 Days | 130,796 | 44.9% | 61.4% | none |
| Payments Made within 14 Days | 130,796 | 94.6% | 92.5% | none |
| Payments Made within 21 Days | 130,796 | 98.3% | 96.3% | none |
| Benefit Quality Measures | ||||
| Nonmon. Determin. with Scores > 80% | 160 | 75.1% | 70.9% | 75% (Fiscal Year '02) |
| LA Appeals with Scores >= 85% | 73 | 82.5% | 90.5% | 80% (Fiscal Year '00) |
| Benefit Payment Control | ||||
| Fraud Overpayment Recovery Rate | 147,194 | 45.1% | 50.9% | none |
| Nonfraud Overpayment Recovery Rate | 356,464 | 56.4% | 56.1% | none |
| Wyoming | ||||
| REPORTED MEASURE | STATE RESULTS | NATIONAL RESULTS | CRITERION | |
|---|---|---|---|---|
| Cash Management | ||||
| Average time (days) funds are on deposit before being transferred to Trust Fund | 2.9 | 2.1 days | <= 2 (Fiscal Year '00) | |
| Ratio of avg daily loanable balance in Clearing Account to avg daily transfer to Tust Fund | 0.35 | 1.70 | <= 1.75 (Fiscal Year '02) | |
| Benefit Accuracy Measurement | ||||
| Total Dollars Paid in Population | $24,104,280 | $18.8 B | none | |
| Sample Size | 360 | 26,353 | none | |
| Proper Payment Rate | 90 +/- 3.4 | 91.5% | none | |
| Overpayment Rate | 10 +/- 3.4 | 8.5% | none | |
| Underpayment Rate | 0.3 +/- 0.2 | 0.9% | none | |
| Footnotes: | none | |||
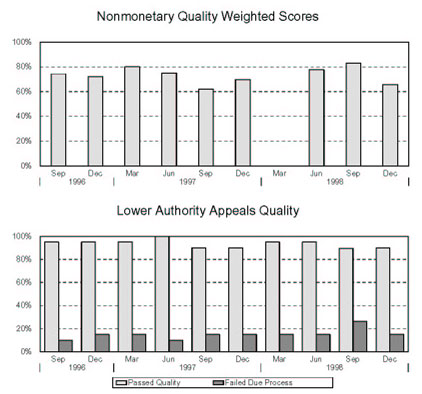
| Wyoming | ||||
| REPORTED MEASURE | STATE RESULTS | NATIONAL RESULTS | ||
|---|---|---|---|---|
| Status Determinations | ||||
| New Employer Determinations: | ||||
| Percentage Made Within 90 Days (Fiscal Year '00 criterion: 60%) | 81.4% | 78.0% | ||
| Percentage Made Within 180 Days (Fiscal Year '00 criterion: 80%) | 89.8% | 89.7% | ||
| Accuracy In Determinations? (Fiscal Year '02 criterion: <= 6 failed) | F | 45.8% Pass | ||
| Accuracy In Postings? | F | 39.6% Pass | ||
| Successor Determinations: | ||||
| Percentage Made Within 90 Days | 69.4% | 67.0% | ||
| Percentage Made Within 180 Days | 79.2% | 81.5% | ||
| Accuracy In Determinations? | F | 54.2% Pass | ||
| Accuracy In Postings? | F | 45.8% Pass | ||
| Inactivations: | ||||
| Accuracy In Determinations? | F | 64.4% Pass | ||
| Accuracy In Postings? | F | 64.6% Pass | ||
| Report Delinquency | ||||
| Reports From Contributory Employers: | ||||
| Percentage Filed Timely | 86.8% | 87.4% | ||
| Percentage Secured | 99.4% | 92.5% | ||
| Percentage Resolved | 101.7% | 97.1% | ||
| Reports From Reimbursing Employers: | ||||
| Percentage Filed Timely | 91.8% | 79.8% | ||
| Percentage Secured | 98.8% | 85.9% | ||
| Percentage Resolved | 100.2% | 87.5% | ||
| Appropriate Actions Taken To Resolve Delinquencies? | P | 76.6% Pass | ||
| Collections | ||||
| Collections From Contributory Employers: | ||||
| Percentage Of Tax Due Paid Timely | 88.4% | 92.0% | ||
| Turnover Ratio - Ratio Of Receivables Liquidated Or Declared Uncollectible/Doubtful To Tax Due | 12.5% | 8.1% | ||
| Percentage of Tax Due Declared Uncollectible/Doubtful | 0.8% | 1.3% | ||
| Accounts Receivable As A Percentage Of Tax Due | 5.9% | 2.2% | ||
| Collections From Reimbursing Employers: | ||||
| Percentage Of Tax Due Paid Timely | 98.0% | 80.6% | ||
| Turnover Ratio - Ratio Of Receivables Liquidated Or Declared Uncollectible/Doubtful To Tax Due | 3.2% | 19.4% | ||
| Percentage of Tax Due Declared Uncollectible/Doubtful | 0.7% | 1.2% | ||
| Accounts Receivable As A Percentage Of Tax Due | 0.1% | 4.6% | ||
| Appropriate Actions Taken To Collect Tax Due? | F | 48.9% Pass | ||
| Cashiering | ||||
| Remittances Deposited Within Three Days? | P | 92.0% Pass | ||
| Field Audit | ||||
| Percent Change In Total Wages Resulting From Audits | 2.2% | 5.0% | ||
| Percentage Of Contributory Employers Audited | 3.8% | 2.0% | ||
| Annualized Percentage Of Total Wages Audited | 1.8% | 1.8% | ||
| Audits Meet Employment Security Manual Requirements? | P | 64.6% Pass | ||
| Account Maintenance | ||||
| Accuracy In Report Processing? | P | 96.0% Pass | ||
| Accuracy In Contributory Employer Billing? | P | 84.8% Pass | ||
| Accuracy In Reimbursing Employer Billings? | P | 85.7% Pass | ||
| Accuracy In Credits/Refunds? | P | 73.9% Pass | ||
| Accuracy In Benefit Charging? | P | 89.6% Pass | ||
| Accuracy In Experience Rating? | P | 87.8% Pass | ||
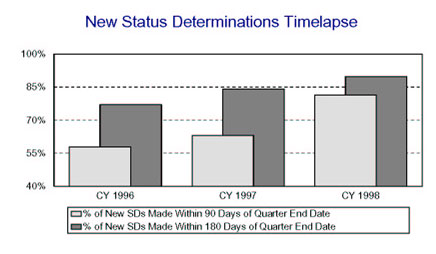
APPENDIX A: BAM DATA AND FOOTNOTES
The reported BAM data comprises five pieces of information: total dollars paid in the population, sample size, proper payment rate, overpayment rate, and underpayment rate. In addition, some Statesí reports include footnotes that describe certain conditions that affect the data. All States have been given the opportunity to provide a narrative to accompany their annual report.
States can generate a variety of estimates based on the BAM sample including:
POPULATION AND SAMPLE SIZE
"Total Dollars Paid in Population" is the total UI benefits paid for the population of UI claims which comprised the sampling frames for all weeks in Calendar Year 1998 for which the State pulled BAM samples.
"Sample Size" is the number of BAM payments from covered UI programs selected for investigation during Calendar Year 1998 that have been completed and entered into the computer on or before April 30, 1999.
ESTIMATES OF ERROR
"Proper Payments" is the combined ratio estimate of total dollars properly paid to total dollars paid, expressed as a percentage.
"Overpayments" is the combined ratio estimate of total dollars overpaid to total dollars paid, expressed as a percentage. All estimates are based upon official actions only.
"Underpayments" is the combined ratio estimate of total dollars underpaid to total dollars paid, expressed as a percentage.
"95% Confidence Interval", expressed as +/- percentage points, is shown for each of the three estimated rates: proper payments, overpayments, and underpayments. The actual rate is expected to lie within ninety-five percent of the intervals constructed from repeated samples of the same size and selected in the same manner as the BAM sample.
FOOTNOTES
EXCLUDED CASES
Occasionally, cases that are not part of the BAM survey population (for example interstate payments or supplemental payments) inadvertently enter the BAM sampling frame, usually due to coding errors. Any such cases that are identified in the BAM sample are excluded from the Annual Report data. Accordingly, the total dollars paid in the population is adjusted to exclude the dollars paid for any non-BAM cases. Excluded dollars are estimated using the combined ratio of the dollars paid for excluded payments in the BAM sample to the total dollars paid for all payments in the BAM sample.
The proper, overpayment, and underpayment rate estimates are based on the number of BAM sample cases completed by the State, excluding the non-BAM cases. This number is reported in the Annual Report as the "Sample Size". The BAM case completion and time lapse data used to determine the applicability of footnotes were computed excluding the non-BAM cases.
This appendix provides a technically complete but concise definition of all Tier II measures, including the report and cell numbers in the Unemployment Insurance Data Base from which the measures are computed. The benefit measures are defined in Table 1. The report cells for the benefit measures are listed in Table 2. The computed tax measures are defined in Table 3. Information on the acceptance samples are displayed in Table 4.
TABLE 1
| Benefit Measures | Units | Intrastate/ Interstate | Programs | Full/Part Wks | Table |
|---|---|---|---|---|---|
| First Payment Time Lapse, 14/21 days, Partial Payments | % within 14/21 days | Both | State UI | Partials | ar9050p |
| UCFE First Payment Time Lapse, 14/21 days | % within 14/21 days | both | UCFE | Both | ar9050 |
| UCX First Payment Time Lapse, 14/21 days | % within 14/21 days | both | UCX | Both | ar9050 |
| Intrastate UI First Payment Time Lapse, 14/21 days | % within 14/21 days | Intra | State UI | Both | ar9050 |
| Interstate UI First Payment Time Lapse, 14/21 days | % within 14/21 days | Inter | State UI | Both | ar9050 |
| Workshare First Payments, 14/21 days | % within 14/21 days | Both | All | Both | ar9050 |
| Continued Claims Time Lapse, 14 Days | % within 14 days | Both | All | Both | ar9051 |
| Continued Claims Time Lapse, 28 Days | % within 28 days | Both | All | Both | ar9051 |
| Continued Claims Time Lapse, 14 Days, Partials | % within 14 days | Both | All | Partials | ar9051 |
| Continued Claims Time Lapse, 21 Days, Partials | % within 21 days | Both | All | Partials | ar9051 |
| Continued Claims Time Lapse, 28 Days, Partials | % within 28 days | Both | All | Partials | ar9051 |
| Workshare Continued Weeks Time Lapse, 14 days | % within 14 days | Both | All | Both | ar9051 |
| Nonmonetary Determinations Detection to Decision Time Lapse, Intrastate Separations, 21 days | % within 21 days | Intrastate | All | Both | ar9052 |
| Nonmonetary Determinations Detection to Decision Time Lapse, Interstate Separations, 21 days | % within 21 days | Interstate | All | Both | ar9052 |
| Nonmonetary Determinations Detection to Decision Time Lapse, Intrastate Nonseparations, 14 days | % within 14 days | Intrastate | All | Both | ar9052 |
| Nonmonetary Determinations Detection to Decision Time Lapse, Interstate Nonseparations, 14 days | % within 14 days | Interstate | All | Both | ar9052 |
| Nonmonetary Determinations Affected Week to Detection Time Lapse, Intrastate Separations, 21 days | % within 21 days | Intrastate | All | Both | ar9053 |
| Nonmonetary Determinations Affected Week to Detection Time Lapse, Interstate Separations, 21 days | % within 21 days | Interstate | All | Both | ar9053 |
| Nonmonetary Determinations Affected Week to Detection Time Lapse, Intrastate Nonseparations, 14 days | % within 14 days | Intrastate | All | Both | ar9053 |
| Nonmonetary Determinations Affected Week to Detection Time Lapse, Interstate Nonseparations, 14 days | % within 14 days | Interstate | All | Both | ar9053 |
| Lower Authority Appeals, Pending Cases Aged 25 Days or Less | % 25 days or less old | Both | All | Both | ar9055l |
| Lower Authority Appeals, Pending Cases Aged More than 40 Days | % more than 40 days old | Both | All | Both | ar9055l |
| Lower Authority Appeals, Pending Cases Aged More than 120 Days | % more than 120 days old | Both | All | Both | ar9055l |
| Lower Authority Appeals, Pending Cases Aged More than 360 Days | % more than 360 days old | Both | All | Both | ar9055l |
| Average Days to Implement Lower Authority Appeals Decision | Average # of days | Both | All | Both | ar9057 |
| Percent of Lower Authority Appeals Decisions Passing Due Process | % of Sampled Cases w/o errors | Both | All | Both | ar9057t |
| Months Worth of Pending Lower Authority Appeals | Ratio of Pending Cases to Avg. Mo. Decision Rate | Both | All | Both | ar9055l and 5130 |
| Higher Authority Appeals, Pending Cases Aged 40 Days or Less | % 40 days or less old | Both | All | Both | ar9055h |
| Higher Authority Appeals, Pending Cases Aged More than 70 Days | % more than 70 days old | Both | All | Both | ar9055h |
| Higher Authority Appeals, Pending Cases Aged More than 120 Days | % more than 120 days old | Both | All | Both | ar9055h |
| Higher Authority Appeals, Pending Cases Aged More than 360 Days | % more than 360 days old | Both | All | Both | ar9055h |
| Months Worth of Pending Higher Authority Appeals | Ratio of Pending Cases to Avg. Mo. Decision Rate | Both | All | Both | ar9055h and ar5130 |
| CWC Wage Transfer Time Lapse: 3-Day | % within 3 days | Both | All | Both | ar586 |
| CWC Billing Timeliness: 14- Day | % within 14 days | Both | All | Both | ar586 |
| CWC Reimbursement Timeliness: 14-Day | % within 14 days | Both | All | Both | ar586 |
| Benefit Payment Control, Nonfraud Collections | % $ estab. collected | Both | All | Both | ar227 |
| Benefit Payment Control, Fraud Collections | % $ estab. collected | Both | All | Both | ar227 |
TABLE 2
| Benefit Measures | Table Cells |
|---|---|
| First Payment Time Lapse, 14/21 days, Partial Payments | sum(c10+c14+c18+c22) for Sts w/o ww +sum(c10+c14+c18+c22+c26+c30) for Sts with ww}/sum(c2+c6) |
| UCFE First Payment Time Lapse, 14/21 days | sum(c11+c15+c19+c23) for Sts w/o ww +sum(c11+c15+c19+c23+c27+c31) for Sts with ww}/sum(c3+c7) |
| UCX First Payment Time Lapse, 14/21 days | sum(c12+c16+c20+c24) for Sts w/o ww +sum(c12+c16+c20+c24+c28+c32) for Sts with ww}/sum(c4+c8) |
| Intrastate UI First Payment Time Lapse, 14/21 days | sum(c10+c18) for Sts w/o ww +sum(c10+c18+c26) for Sts with ww}/ sum(c2) |
| Interstate UI First Payment Time Lapse, 14/21 days | sum(c14+c22) for Sts w/o ww +sum(c14c22+c30) for Sts with ww}/ sum(c6) |
| Workshare First Payments, 14 days | sum(c2+c3)/sum(c1) |
| Continued Claims Time Lapse, 14 Days | sum(c9+c13+c17+c21)/sum(c1+c5) |
| Continued Claims Time Lapse, 21 Days | sum(c9+c13+c17+c21+c25+c29)/ sum(c1+c5) |
| Continued Claims Time Lapse, 28 Days | sum(c9+c13+c17+c21+c25+c29+c33+c37)/ sum(c1+c5) |
| Continued Claims Time Lapse, 14 Days, Partials | sum(c9+c13+c17+c21)/sum(c1+c5) |
| Continued Claims Time Lapse, 21 Days, Partials | sum(c9+c13+c17+c21+c25+c29)/ sum(c1+c5) |
| Continued Claims Time Lapse, 28 Days, Partials | sum(c9+c13+c17+c21+c25+c29+c33+c37)/ sum(c1+c5) |
| Workshare Continued Weeks Time Lapse, 14 days | sum(c2+c3)/sum(c1) |
| Nonmonetary Determinations Detection to Decision Time Lapse, Intrastate Separations, 21 days | sum(c9+c17+c25)/sum(c1) |
| Nonmonetary Determinations Detection to Decision Time Lapse, Interstate Separations, 21 days | sum(c13+c21+c29)/sum(c5) |
| Nonmonetary Determinations Detection to Decision Time Lapse, Intrastate Nonseparations, 14 days | sum(c105+c113)/sum(c97) |
| Nonmonetary Determinations Detection to Decision Time Lapse, Interstate Nonseparations, 14 days | sum(c109+c117)/sum(c101) |
| Nonmonetary Determinations Affected Week to Detection Time Lapse, Intrastate Separations, 21 days | sum(c9+c17+c25)/sum(c1) |
| Nonmonetary Determinations Affected Week to Detection Time Lapse, Interstate Separations, 21 days | sum(c13+c21+c29)/sum(c5) |
| Nonmonetary Determinations Affected Week to Detection Time Lapse, Intrastate Nonseparations, 14 days | sum(c105+c113)/sum(c97) |
| Nonmonetary Determinations Affected Week to Detection Time Lapse, Interstate Nonseparations, 14 days | sum(c109+c117)/sum(c101) |
| Lower Authority Appeals, Pending Cases Aged 25 Days or Less | sum(c2)/sum(c1) |
| Lower Authority Appeals, Pending Cases Aged More than 40 Days | sum(c1-c2-c3)/sum(c1) |
| Lower Authority Appeals, Pending Cases Aged More than 120 Days | sum(c6+c7+c8)/sum(c1) |
| Lower Authority Appeals, Pending Cases Aged More than 360 Days | sum(c8)/sum(c1) |
| Average Days to Implement Lower Authority Appeals Decision | c36-c35 |
| Percent of Lower Authority Appeals Decisions Passing Due Process | Number of cases where none of {c9,c13,c14,c22,c25,c26,c28,c29} equal "U" divided by the number of cases where c39>0 |
| Months Worth of Pending Lower Authority Appeals | ar9055l.c1 for the latest month divided by avg(ar5130.c51) over the last 6 months |
| Higher Authority Appeals, Pending Cases Aged 40 Days or Less | sum(c2)/sum(c1) |
| Higher Authority Appeals, Pending Cases Aged More than 70 Days | sum(c1-c2-c3)/sum(c1) |
| Higher Authority Appeals, Pending Cases Aged More than 120 Days | sum(c5+c6+c7)/sum(c1) |
| Higher Authority Appeals, Pending Cases Aged More than 360 Days | sum(c7)/sum(c1) for last month of period |
| Months Worth of Pending Higher Authority Appeals | ar9055h.c1 for the last month of period divided by avg(ar5130.c52) over the last 6 months of period |
| CWC Wage Transfer Time Lapse: 3-Day | sum(c84)/sum(c26) |
| CWC Billing Timeliness: 14-Day | sum(c72)/sum(c70) |
| CWC Reimbursement Timeliness: 14-Day | sum(c73)/sum(c71) |
| Benefit Payment Control, Nonfraud Collections | sum(c41+c45)/sum(c29+c61-c69) |
| Benefit Payment Control, Fraud Collections | sum(c39+c43)/sum(c3+c59-c67) |
TABLE 3
| Tax Computed Measures | Units | Type of Employer | Table | Table Cells |
|---|---|---|---|---|
| Successor Status Determination Timeliness, 90-day | % w/in 90 days | All | ar581 | sum(c59)/sum(c68) |
| Successor Status Determination Timeliness, 180-day | % w/in 180 days | All | ar581 | sum(c60)/sum(c68) |
| Contributory Employer Report Timeliness: Timely Filing | % Employers filing on Time | Contrib | ar581 | sum(c53)/sum(c1), c1 w/1 qtr lag |
| Contributory Employer Report Timeliness: Reports Secured w/in 1 qtr after report is due | % Reports Secured | Contrib | ar581 | sum(c54)/sum(c1), c1 w/1 qtr lag |
| Contributory Employer Report Timeliness: Reports resolved w/in 2 qtrs after report is due | % Reports Resolved | Contrib | ar581 | sum(c55)/sum(c1), c1 w/2 qtr lag |
| Reimbursing Employer Report Timeliness: Timely Filing | % Employers filing on Time | Reimb | ar581 | sum(c56)/sum(c2), c2 w/1 qtr lag |
| Reimbursing Employer Report Timeliness: Reports Secured w/in 1 qtr after report is due | % Reports Secured | Reimb | ar581 | sum(c57)/sum(c2), c2 w/1 qtr lag |
| Reimbutory Employer Report Timeliness: Reports resolved w/in 2 qtrs after report is due | % Reports Resolved | Reimb | ar581 | sum(c58)/sum(c2), c2 w/2 qtr lag |
| Contributory Employers, Amounts Due Paid Timely | % Due Received on Time | Contrib | ar581 and ar2112 | 1-sum(ar581.c15)/ (sum(ar2112.c9)+ sum(ar581.c15- ar581.c16)) |
| Contributory Employers, Turnover Ratio | Ratio, receiv liq + uncoll. + doubtful/ tax due | Contrib | ar581 and ar2112 | sum(ar581.c16+ar581.c17+ ar581.c64)/ (sum(ar2112.c9)+ sum(ar581.c15- ar581.c16)) |
| Contributory Employers, Uncollectible Receivables | % Tax Due Decleared Uncollectible | Contrib | ar581 and ar2112 | sum(ar581.c17+ar581.c64)/ (sum(ar2112.c9)+ sum(ar581.c15-ar581.c16)), |
| Contributory Employers, Unpaid Contributions | Accounts Receivable End of Pd. as % of Tax Due | Contrib | ar581 and ar2112 | sum(ar581.c18)/ (sum(ar2112.c9)+ sum(ar581.c15-ar581.c16)), c18 for last qtr, other cells for 4 qtrs |
| Reimbursing Employers, Amounts Due Paid Timely | % Due Received on Time | Reimb | ar581 and ar2112 | 1-sum(ar581.c20)/ (sum(ar2112.c27+ ar2112.c29+ar2112.c31)+ sum(ar581.c20-ar581.c21)) |
| Reimbursing Employers, Turnover Ratio | Ratio, receiv liq + uncoll. + doubtful/ tax due | Reimb | ar581 and ar2112 | sum(ar581.c21+ar581.c22+ ar581.c65)/ (sum(ar2112.c27+ ar2112.c29+ar2112.c31)+ sum(ar581.c20-ar581.c21)) |
| Reimbursing Employers, Uncollectible Receivables | % Tax Due Decleared Uncollectible | Reimb | ar581 and ar2112 | sum(ar581.c22+ar581.c65)/ (sum(ar2112.c27+ ar2112.c29+ar2112.c31)+ sum(ar581.c20-ar581.c21)) |
| Reimbursing Employers, Unpaid Contributions | Accounts Receivable End of Pd. as % of Tax Due | Reimb | ar581 and ar2112 | sum(ar581.c23)/ (sum(ar2112.c27+ ar2112.c29+ar2112.c31)+ sum(ar581.c20-ar581.c21)) c23 for last qtr, other cells for 4 qtrs |
| Wage Change Due to Field Audit | % of Wages Audited Changed by Audit | Contrib | ar581 | sum(c40a+c37a)/sum(c66) |
| Contributory Employers Audited | Audits as % of employers | Contrib | ar581 | sum(c25b)/sum(c1), c1 w/5 qtr lag |
| Contributory Employers, Wages Audited | Audited Wages as % Total Wages | Contrib | ar581 and ar202 | sum(ar581.c67)* sum(ar581.c25b)*4/ (sum(ar581.c26a)* sum(ar202.c5)), c5 w/4 qtr lag |
TABLE 4
| Name/Transactions | Description | Sample Size | Failures to Pass |
|---|---|---|---|
| New Status Determinations | Evaluates accuracy by rating sample of determinations using 11-question review instrument | 60 | < 4 |
| New Status Determinations Posting | Evaluates posting accuracy by rating sample of new accounts using 15-question review instrument | 60 | < 4 |
| Successor Status Determinations | Evaluates accuracy by rating sample of determinations using 9- question review instrument | 60 | < 4 |
| Successor Status Determinations Posting | Evaluates posting accuracy by rating sample of Inactivation/ Termination accounts using multi-part review instrument | 60 | < 4 |
| Inactivation/Termination Status Determinations | Evaluates accuracy by rating sample of determinations using 4-question review instrumen | 60 | < 4 |
| Inactivation/Termination Status Determinations Posting | Evaluates posting accuracy by rating sample of Inactivated/ Terminated accounts using multi- part review instrument | 60 | < 4 |
States were invited to submit a short narrative analysis of their annual reports. Any narratives submitted to the Department electronically, on or before June 4, 1999, are included in this appendix. State narratives are displayed in alphabetical order. The content of each State's narrative is at the discretion of the individual State.
In 1998, the California Employment Development Departmentís (EDD) Quality Control (QC) Section examined 1,729 randomly selected unemployment insurance (UI) benefit payments. The Quality Control (QC) Section met or exceeded all federal timeliness guidelines for the UI Benefit Accuracy Measurement (BAM) program in completing these cases.
The BAM overpayment rate for 1998 was 5.9%. Separation issues were the leading cause accounting for 46.3% of the amount overpaid. The claimants were responsible for 37.0% of the amount overpaid.
The roll-out of the EDDís strategic plan and the implementation of telephone claim filing (TCF) continued during 1998. Among other accomplishments, the final TCF call center became fully operational during the year. It should be noted that the 1998 BAM overpayment rate, 5.9%, is basically the same as it was under in person service operations.
The California EDD will continue to monitor the effects of changes to the UI system and operation using the BAM data.
During the calendar year 1998, Connecticutís Benefit Accuracy Measurement (BAM) program exceeded all established federal performance standards for case timeliness. A total of 480 case investigations were completed, which is the required annual sample.
Connecticut paid approximately $332 million dollars in UI benefits in 1998. The percentage of dollars paid without error increased from 95.7% in 1997 to 97.2% in 1998. Overpayments decreased from 4.3% in 1997 to 2.8% in 1998.
The percentage of dollars paid in error attributed to the claimant decreased from 82.9% in 1997 to 72% in 1998. This decrease is attributed to a reduction in instances of claimant fraud and the incorrect reporting of partial earnings. Claimant error continues to account for a vast majority of the dollars overpaid.
Connecticut currently employs voice response technology for continued claim filing for both full and partial benefits. A review of BAM data from prior years indicate that this technology has had no detrimental impact on payment
rates.The dollar amount overpaid where the agency is the responsible party is so small that the error estimate is considered unreliable. The data will be viewed as an additional tool to aid in performance improvement.
Indiana sampled 690 benefit payments in the calendar year 1998. Based on audit findings, it is estimated that 85.1% (+/- 2.8%) were properly paid. This is a 1.7% percent decrease from 1997. This small decrease in proper payments can be attributed to an increase in Work Search Issues and Benefit Year Earnings errors.
The majority of the overpayments were caused by errors pertaining to: Work Search (35.4%), Benefit Year Earnings (25.3%), Eligibility - Registration (22.5%), Separation (14.5%), and Base Period Wages (1.4%).
Claimants are responsible (solely or jointly) for 78.9% of overpayment dollars. The agency is responsible (solely or jointly) for 23.7% of dollars overpaid. Employers are solely or jointly responsible for 15% of dollars overpaid.
The increase in Work Search Issues is due partly to claimants misrepresenting their recall status. Benefit Year Earnings Errors has increased because some claimants are still reporting their partial earnings inaccurately.
Indiana is continuing its efforts to reduce payment errors. Program improvement initiatives are focusing on staff, employer, and claimant education. Claimant self-entry has been implemented in every office, which is allowing staff more time to focus on claimant profiling, job placement and employer issues.
The Indiana Department of Workforce Development is currently working on an automated system, which will let UI claimants use the phone to file continued claims. This system is planned to be in place later this fall
.During the 1998 calendar year Iowa randomly selected 480 unemployment insurance payments for analysis. After investigation, it was determined that 91.9% (+/-2.5%) were paid properly. The balance of 8.1% (+/-2.5%) were overpaid. This represents a decrease of .3% in properly made payments from last year and a similar increase in overpayments.
Breakouts for the areas contributing to the overpayments are as follows: separation issues 1.4%, benefit year earnings issues 19.1%, eligibility issues excluding work search 9.0%, other issues 6.6%, base period wage issues 3.9%, and work search issues 0.0%.
Of obvious concern to Iowa is the increase (22.7%) due to separation issues. Although, at first glance, it would appear that this increase was due to improper decision making; in fact, that was not the case. Further investigation revealed that the separation errors were fairly evenly split between agency procedures, increased workload due to Disaster Unemployment Assistance claims, and inadequate information provided by claimants or employers.
It was encouraging to note that errors due to benefit year earnings issues improved 24.9% since last year. The improvement was due to a decline in the average dollar value of the overpayments rather than a decrease in the percent of issues resulting in overpayments due to benefit year earnings errors. Interestingly, the 1998 decline occurred after several years of movement in the opposite direction.
It is also noteworthy that, for the second year in a row, errors due to work search issues remained at 0.0%. In the last half of 1994 new work search procedures were implemented as a result of technology advancements. Implementation of the new procedures resulted in a 13% increase in errors for this area in 1994. Although still an area of concern in 1995, the necessary internal actions had been taken to address the situation. By 1996 the problem was under control (down to only 4.3% error rate). Reports for 1997 and 1998 substantiate that the problem in this area has been resolved.
Iowa will continue to use the Benefit Accuracy Measurement Annual Report as a means to successfully identify and address areas of concern within the Iowa Unemployment Insurance Program.
The Unemployment Insurance Benefit Accuracy Measurement Program provides information on errors made in Unemployment Insurance (UI) benefit payments.
During calendar year 1998, the BAM program selected 360 benefit claim weeks for audit. These 360 weeks were selected from a total of 340,602 benefit weeks paid.
The results of the audit show that 83.2 percent of the claims were paid correctly, a 4 percent decrease from 1997, and 22.5 percent of the claims were found to have errors, a 6 percent decrease from 1997. Benefit Year Earnings errors accounted for the largest dollar amount of errors, accounting for 44.8 percent of the total errors found, and fraud was found in five cases, or 1.3 percent of the cases audited, a decrease from 1997.
Claimants caused forty three percent of the errors found. The large number of claimant errors is primarily due to misreporting benefit year earnings and hours in the continued claim process. When problem areas are identified, studies are conducted to evaluate and improve the system and recommendations are then presented to the program affected.
Over the past year, the Montana Unemployment Insurance Program has been developing a new computerized benefits system to replace the 14 year old mainframe system currently in use. The new system will be based on an Oracle database and will incorporate Imaging and Workflow components into the overall system. The system will allow staff to utilize their time more efficiently and help our clients in a more expedient manner.
The Montana Unemployment Insurance Division instituted a Process Improvement Project (PIP) to find improved methods of taking claims. The result was a reorganization of claimstaking and adjudication staff into teams. There will also be improved measurement of claims activity to assure a more holistic, customer-focused program.
During 1998 the BAM staff participated in training Customer Service Representatives. They reviewed cases as part of the Benefit Timeliness and Quality review process. BAM members also participated on both the new UI Benefits computer system design and Department security teams, and rewrote the Montana BAM Policy Manual.
In an effort to better serve Montana employers, the Tax Collection and Audit functions of the Unemployment Insurance Division was relocated to the Montana Department of Revenue in 1997. While oversight and Trust Fund management of the program remains with the Unemployment Insurance Division, all other functions are with the Department of Revenue. This relocation of services reduces the number of stops employers need to make to gain information regarding their tax information or to set up accounts.
As in years past, UI Division staff visited Montana communities to provide clinics, workshops and training for employers and Job Service staff. Resolving reporting errors made by claimants and employers is a priority of the UI Division and the Quality Control program.
As part of the UI Benefit Accuracy Measurement (BAM) Program in 1998, Quality Control Program staff audited 768 benefit payments made to claimants. Results showed that 90.2 percent of the dollars paid in unemployment insurance benefits in North Carolina were paid properly. Over 79 percent of the benefit dollars overpaid were due to claimant and/or employer errors which are difficult to control.
The most significant data finding for 1998 is that for the first time since Quality Control audits began in 1985, work search issues were no longer the greatest cause of overpayments. For 1998, work search fell behind weekly earnings and separation issues as causing the largest dollar amount of overpayments in the sample cases. Improved claimant education in work search responsibilities is felt to be the leading cause in the error reduction.
The Employment Security Commission of North Carolina will continue to use Benefit Accuracy Measurement data to enhance the accuracy of unemployment insurance benefit payments.
In 1998, the Ohio Benefits Accuracy Measurement program audited 485 paid weeks of unemployment benefits. The program met all federal standards for 1998.
Ohio has stringent work search requirements which call for unemployed workers to register with state Employment Services, make weekly job contacts with employers, retain a written record of their job contacts and to report in-person to field offices for periodic eligibility reviews. These work search requirements are intended to assist the unemployed individual in returning to work as soon as possible and reduce the weeks of unemployment paid. The strict work search requirements benefit the overall unemployment insurance program in Ohio. The duration of unemployment in Ohio has been reduced from 13.3 weeks in 1997 to 11.9 weeks in 1998, thereby reducing trust fund payments by $100.9 million. This is the lowest duration of unemployment in Ohio since 1974. The strict work search requirements assist Ohio to surpasses the national average for duration of unemployment which was13.9 weeks in 1998.
In an effort for continuous quality improvement, Ohio intends to implement several changes to the work search policy in 1999. These changes will allow more flexibility in assigning work search requirements. Ohio anticipates that the policy changes will further reduce the duration of unemployment, and decrease the dollars overpaid due to work search errors.
In 1998 the Benefits, Timeliness and Quality (BTQ) review showed steady improvement in quality through the year. The results increased from 59.15% for the first quarter 1998 to 73.37% for the fourth quarter 1998. Ohio attributes this improvement to the development of a workload reporting guide for staff, intensive nonmonetary (separation and nonseparation) training and the implementation of Adjudication centers. Currently 16 of our 56 field offices send their separation issue claims to an Adjudication center, with 2 more participating beginning June, 1999. It is anticipated that an additional Adjudication center will open during 1999. Ohio expects future results to reflect the same increases in quality.
The 1998 review of Ohioís tax functions was successfully completed in accordance with TPS requirements. The results of the 1998 TPS review revealed Ohioís tax program maintains consistent, current policies and procedures in all its tax transactions; that all thirteen acceptance samples passed, demonstrating accurate and timely application of Ohioís policies and procedures; and the computed measures indicators confirmed Ohio is accurately reporting its tax activity.
Ohio is continuing to re-engineer the Unemployment Insurance Benefits Delivery System. The projectís mission is to redesign business processes and apply advanced technology to improve accuracy, accountability, accessibility, and efficiency of UI benefits services for employer and claimant customers. Continuous improvement is our goal
.In 1998, the Benefits Accuracy Measurement Staff investigated 497 cases. The overall proper payment rate increased from 87.9 percent in Calendar Year 1997 to 88.1 percent of total benefits paid in Calendar Year 1998, an increase of 0.2 percentage points.
Over 89 percent of the dollars overpaid were due to claimant and or employer error. Claimants were the largest contributor to overpayments (80.9%). "Agency only" responsibility for overpayments fell from 1,87% of all payments to 1.25% relative to the previous year.
The largest cause of these overpayments was unreported or incorrectly reported benefit year earnings, which amounted to 39.3 percent of all dollars overpaid (4.68% of all payments). The agency has recently begun crossmatching claim status with New Hire Directory information in an effort to further reduce unreported earnings overpayments. Various other actions continue to be a made to reduce this cause of overpayments.
There was an absolute decline in overpayments by all other causes when compared to the previous year.
All problems found in UI benefit payments that can be directly impacted by UI Division action, have been identified by Quality Control and all efforts will be made to eliminate them.
In Calendar Year 1998, the Virginia Employment Commission properly paid 80.8 percent, or $138,441,462, of the $171,338,443, total umemployment benefits
paid.Of the total dollars paid, claimants were responsible for 15.9 percent, or $27,238,700, paid in error, an increase from 15.1 peracent in Calendar Year 1997. Virginia law requires that individuals actively look for work and document information about the employers contacted during each week for which a claim is filed.
Claimants provided inaccurrate or fraudulent information about their efforts to find work which caused 10.44 percent of the total dollars paid to be in error. This compares to 10.24 percent the previous year. Claimants also misreported casual earnings. This accounted for 4.67 percent of the total dollars paid, compared with 2.29 percent the previous year. Benefits paid to claimants who misrepresented or withheld information about their most recent employment increased from 2.45 percent in 1997 to 2.50 percent in 1998. Benefits paid to claimants who misrepresented their eligibility for other reasons decreased from 2.43 percent in 1997 to 1.44 percent in 1998.
The Quality Control Unit of the West Virginia Bureau of Employment Programs completed the review of 480 unemployment insurance benefit payments for calendar year 1998.
Results indicate that of the $125,223,397 in unemployment benefits subject to audit, 98.3% were proper payments. The 1.7% of dollars overpaid was due primarily to base period wages being improperly reported by employers and benefit year earnings being improperly reported by claimants and employers.
UI Administrationís use of Quality Control findings for ongoing program improvement has been instrumental in their ability to maintain high proper payment rates.