Arizona Water Science Center
Graphical Display of Current and Historical Drought Conditions for Selected Drainage Basins In Arizona
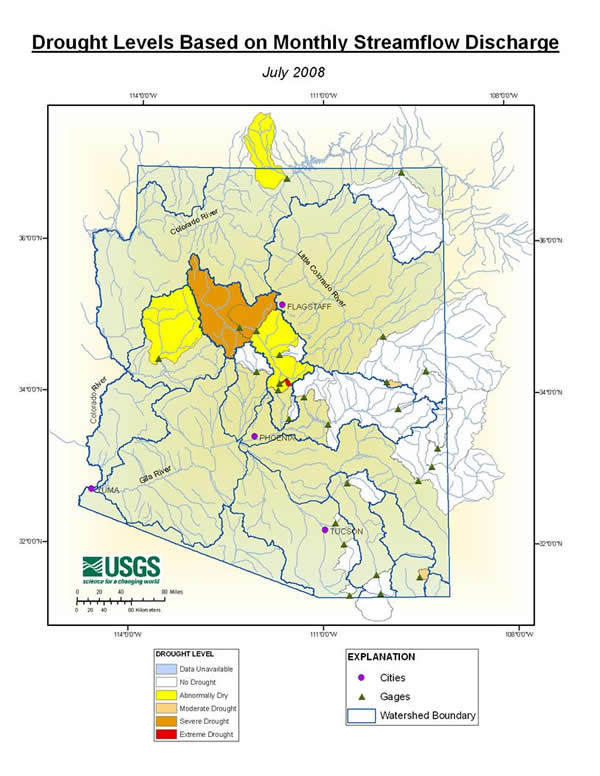
Is Arizona in a drought? If so, how long will the drought last? Is it statewide or only in some areas? What variables constitute a drought? Water managers and the public are seeking answers to these questions because of the economic and environmental consequences of drought. The U.S. Geological Survey (USGS), in cooperation with the Governor’s Drought Task Force, has developed a series of maps showing drought intensity for selected drainage basins in Arizona. Many indicators can be used to determine drought; however, none can exclusively measure the exact severity of drought affecting a region. Two issues need to be addressed to estimate the drought level in an area: the distribution of drought conditions over the landscape and the time frame being examined. Consideration of these issues is needed to ensure an accurate representation of the areas being affected and to differentiate between short-term and long-term conditions. Understanding how historical droughts have varied can help in assessing the length and severity of current and future droughts. The USGS, therefore, has developed historical and current maps of drought conditions throughout Arizona by utilizing key streamflow-gaging stations. The graphical displays will help to identify trends associated with selected basins throughout the State that have unique geographic and hydrologic characteristics. Streamflow-gaging stations measure the volume of water flowing through a stream cross section at a specific point. Geostatistical analysis is one method that can use this point data and relate its distribution with distance. A limitation of this method is that the information needs to be extrapolated to areas that have a definitive boundary, such as a drainage basin. The strength in using data from gaging stations to depict drought conditions is that the data represent a defined area or, in general, the entire basin upstream from the station. One required assumption, however, is that the runoff measured at streamflow-gaging stations is the result of basinwide conditions. Mean monthly discharge values for the selected streamflow-gaging stations were available from the USGS Automated Data Processing System (ADAPS) for the periods the stations were operational. The Arizona’s Governor’s Drought Task Force developed five categorical descriptions of drought on the basis of a particular indicator (table 1). Drought levels were calculated by ranking monthly values for each streamflow-gaging station and then determining a percentile for the period of record. Maps show the drought level for a particular basin during a given month on the basis of available data for the associated gaging station. Comparisons of data from adjacent basins, therefore, should be done with this in mind.
Table 1. Drought levels based on percentiles for the period of record for streamflow-gaging stations
Streamflow-gaging stations used for drought-condition indicators have more than 30 years of data and are not dominated by zero flow. Streamflow at many stations in Arizona is influenced to some degree by upstream dams and by agricultural activities, such as pumping and drainage return from fields (table 2). The basins represented by the selected gaging stations contain the three largest cities in Arizona (Phoenix, Tucson, and Flagstaff). These basins range from 36 to 8,072 square miles in size (table 2). The 8-digit Hydrologic Unit Codes were used to delineate the basin boundaries. Hydrologic indicators, such as streamflow, provide a moderated indication of drought. Using data from streamflow-gaging stations to indicate drought intensity within Arizona will help answer important questions such as, “What areas are being affected by drought and what are the drought trends in these areas?” Table 2. List of USGS streamflow gages used for this study
a Periods of monthly data values missing. Some records are incomplete due to discontinuation of gage and/or discharge measurements. b Monthly discharge values used begain after the start of the Period of Record. In some cases this is due to constrution of gage being completed. c Elevation datum: National Geodetic Vertical Datum of 1929. d For the purpose of this product, 3,748 mi2 of the total 8,580 mi2 was used to represent the drainage basin contributing to the Santa Cruz River near Laveen.
For more information about historical hydrologic conditions in Arizona, see Fact Sheet: Hydrologic Conditions in Arizona During 1999—2004: A Historical Perspective (U.S. Geological Survey Fact Sheet 2005-3081) |
||||||||||||||||||||||||||||||||||||||||||||||||||||||||||||||||||||||||||||||||||||||||||||||||||||||||||||||||||||||||||||||||||||||||||||||||||||||||||||||||||||||||||||||||||||||||||||||||||||||||||||||||||||||||||||||||||||||||||||||||||||||||

![]() U.S. Department of the Interior |
U.S. Geological Survey
U.S. Department of the Interior |
U.S. Geological Survey
URL: http://az.water.usgs.gov/drought/index.html
Page Contact Information: AzWSC Web Team
Page Last Modified: Wednesday, 27-Feb-2008 17:19:07 EST