 |
||||
|
|
|
|||


| |
Computational Modeling of Ballast Tanks to Improve Understanding and Maximize Effectiveness of Management Practices and Treatment Mechanisms - Extension of Laboratory Study
Collaborators
Naval Surface Warfare Center, Carderock Division
(West Bethesda, MD)
Stephan J. Verosto (co-PI), Dr. Peter Chang, Wesley Wilson, Dr. Paisan
Atsavapranee
(NAVSEA Carderock Division web site)
Philip T. Jenkins & Associates Ltd. Capt. Philip
Jenkins
FedNav, Inc. (Montreal, Canada).
Executive Summary
The project uses computer-based computational fluid dynamics (CFD) modeling
and scale model experimental validation to study the flow dynamics in
a typical ballast tank during flow-through exchange of ballast water,
and to determine the effects of tank architecture on the efficacy of exchange
in replacing coastal water in the tank.
Project Rationale
Ballast water discharge is considered to be the primary mechanism responsible for the introduction of nonindigenous aquatic species into coastal ecosystems. There are more than 35,000 commercial cargo vessels operating on the world's oceans. Mid-ocean ballast water exchange (BWE) has been the primary management practice with widespread acceptance aimed at reducing or preventing the spread of nonindigenous aquatic species via ballast water. Although efforts are underway to replace ballast water exchange with technology-based treatment systems, ballast exchange continues to be the only management practice generally available for widespread use by a large variety of vessels. In addition, BWE may be the only mechanism available for use as a back-up in case of failure by future on-board treatment systems. Therefore, it is essential to fully understand the ballast exchange process and what occurs inside a ballast tank during exchange.
The goal of BWE is to replace coastal ballast water (and entrained organisms) with mid-ocean surface seawater. There are two types of BWE approaches: sequential (or empty-refill), and flow-through (or flushing). The former requires that ballast tanks be emptied completely and then refilled at sea, while the latter requires pumping of mid-ocean water, usually entering at the tank bottom, into a full or partially full ballast tank and allowing the water to overflow the tank for a given tank volume multiple. Flow-through exchange has a target of three tank volume overflows based on a theoretical calculation that assumes perfect and instantaneous mixing between the original ballast water and the incoming mid-ocean water. In practice this is not likely achieved.
Shipboard experiments to quantify the effectiveness of BWE are costly, time-consuming, and labor-intensive and cannot be easily reproduced or repeated on the same ship. On-board studies have involved different experimental conditions, and different sampling and analytical approaches. Obtaining samples from a ballast tank during exchange is not a trivial procedure. In addition, on-board experiments generally rely on measurements and samples taken at access hatches or the overflow outlet of the ballast tank. These may not be representative the actual volume mixture of original and exchange water that remains in the ballast tank. Limitations on tank access and sampling equipment generally prevent collection of more than a few spatially and temporally distributed samples, and better resolution is needed to assure the results are representative of conditions throughout the tank.
A validated CFD model offers the possibility of forecasting ballast water exchange "effectiveness," (that is, the percent of original water removed via flow-through exchange process) for individual ballast tank architectures. A model would be portable and could be tailored to different tank types and geometries, different ballasting and deballasting flow rates, and different starting conditions. There is no need to wait for another transoceanic voyage to retest or run a test under different conditions. A validated model can identify areas of the tank that might have significant deadspots due to low fluid velocities. A computer model could also be used to improve the sampling design of on-board ballast exchange experiments and to test the effects of modifications to internal tank architecture.
Program Accomplishments
- 1/3 scale model constructed
- Validation experiments using 1/3 scale model completed for one tank volume of flow
- Full scale CFD model programmed and refined based on experimental validation results
- Full scale flow-through CFD simulation completed
- Effects of ballast tank structural detail on exchange efficiency analyzed
Phase I - Experimental Tank
A 1/3-scale experimental tank consisting of four contiguous bays of a typical ballast tank, two double bottom and two side bays, was constructed (Figure 1). An extensive effort was dedicated to ensuring that the appropriate non-dimensional parameters were scaled correctly throughout the experimental model's design. Richardson numbers were calculated at various points in the experimental model and were found to scale satisfactorily. The Richardson number is the ratio of buoyancy to inertial forces, and is considered to be the most important parameter for two-fluid mixing. Sizing of the waste and supply tanks available for the experimental model limited experimental measurements to a single flow-through exchange volume.
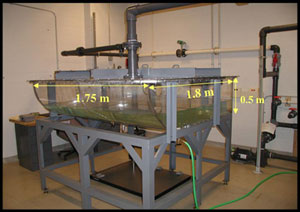
Figure 1: 1/3 scale Experimental Tank
Laser Induced Fluorescence (LIF) was used to obtain two-dimensional temporal measurements of the concentration of the fluid fraction of the two fluids at three or four planes inside the experimental tank, strategically chosen in areas where significant mixing occurs, as well as in the exit pipe. Tests were performed with an inlet flow rate of 65 gpm (246 lpm) which corresponds to a 1000 gpm (3,785 lpm) full-scale flow rate. The flow rates were obtained by Richardson scaling of the flows in the vicinity of the inlet bellmouth. Richardson scaling requires that the ratio of the ship and model scale flow rates are the 5/2 power of the scale ratio; therefore, a 65 gpm model scale flow rate gives the same Richardson scaling as a 1000 gpm full-scale flow rate. The experiments were run for only one model-scale tank volume exchange due to limited reservoir capacity. One tank volume exchange takes 356 seconds with an inlet flow rate of 65 gpm in the 1/3-scale experimental model.
Phase I - Computational Model
The CFD simulations are performed using the commercial viscous flow solver, Fluent, developed by Fluent, Inc. The code uses a cell-centered finite volume approach to solving the governing equations of mass and momentum. In order to facilitate flexibility in handling the complex geometries in ballast water tanks, both structured and unstructured grid areas were used to represent the physical tank model. The grid is focused in regions of interest, such as near the inlet pipe and inlet bellmouth and through the tank floor openings (e.g., manholes, limberholes) for improved resolution. The entire domain of the experimental 4-bay tank model is composed of approximately 1.3 million grid cells in total. A cut plane through the experimental model at the inlet pipe (bellmouth) centerline showing the grid structure is given in Figure 2. More information about the model development may be found in Wilson et al, 2006.
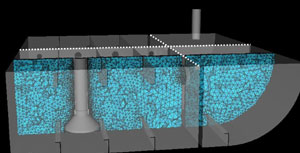
Figure 2: Grid Cell Distribution in One Cut Plane through Experimental Model
Phase I - Results: Computational Model Outcomes and Comparison with Experimental Data
Results from the 1/3-scale model simulations are shown in Figure 3 at three different elapsed times. Figure 3(a) shows the salt water volume fraction contours on two cut-planes through the inlet and exit pipes after 31 seconds, which corresponds to approximately 10% of one volume of flow. Figure 3(b) corresponds to one volume of flow (356 seconds), and Figure 3(c) corresponds to three volumes of flow (1056 seconds). The contour values extend from a saltwater volume fraction of 0.0 (red = pure freshwater) to 1.0 (dark blue = pure salt water). As shown in the figures, early in the ballast exchange process, there is a spreading of the incoming fluid longitudinally down the tank, as well as over the stringers, which encourages mixing of the two fluids. After one tank volume exchange there is still a significant amount of the original fluid left in the tank, trapped between the stringers near the tank top. Negatively buoyant waterfalls are also seen associated with flow through the manholes. After three tank volumes have been completed, there are still some areas of mostly unmixed original fluid trapped between the stringers near the tank top, while in some areas the fluid has become mixed or scoured away. This scenario shows how tank structure may limit the effectiveness of the exchange process.
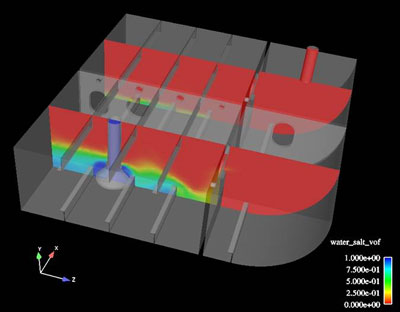
Figure 3a: Simulation Results: ~ 10% volume exchange
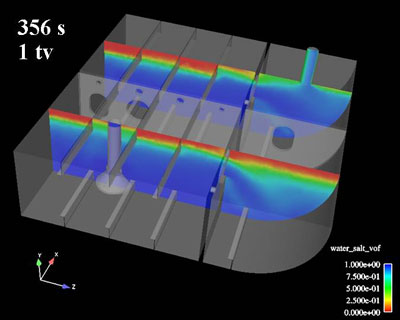
Figure 3b: Simulation Results: One volume exchange

Figure 3c: Simulation Results: Three volume exchanges
Experimental data were collected to measure the effluent concentration history for comparison with the CFD model prediction (Figure 4). The experimental data were collected in the exit pipe. In Figure 4 the time scale has been converted to multiples of a single tank volume exchange (t* = tank volume/inlet flow rate), and the effluent concentration is shown in terms of the exchange efficiency, that is the ratio of the total salt water (replacing) fluid to the total volume of the tank. The comparison shows that the Fluent predictions are nearly identical to the experimental measurements up to t* = 1.2. which is the limit to which the experimental measurements could be taken due to facility size (tank storage) limitations. The plot shows every third data point from the experimental measurements.
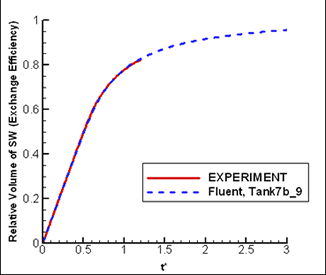
Figure 4: Comparison of experimental and computational model effluent concentrations
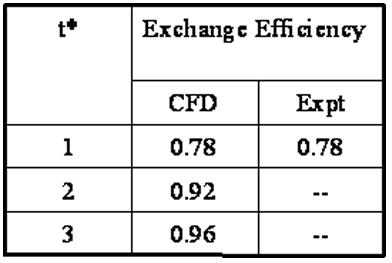
The exchange efficiencies for the four-bay experimental model are tabulated in Table 1. The predicted exchange efficiency after 1 tank volume exchange (t* = 1) is identical to that measured in the experiment. Also, the CFD model for the 4-bay experimental tank predicts that after three volume exchange flow has been completed, the resulting exchange efficiency is 0.96, which exceeds the desired 95% goal for BWE. However, see below for a discussion of the full-scale model and the slightly lower exchange efficiency predicted for a full-size ballast tank.
The flow patterns predicted by the CFD model are not exactly the same as observed in the experimental model. However, it would seem that the discrepancies do not have a significant impact on the accuracy of the predictions for the overall exchange efficiency, which is the primary concern of this study.
Table 1 Exchange Efficiencies
Phase I - Full-Scale Simulations
After gaining some confidence in the accuracy of the CFD predictions, computational simulations were also performed for a full-scale ballast tank. A similar grid structure was used, except the full-scale ballast tank also includes an upper wing (or topside) tank (see Figure 5). The full-scale tank model is a physical representation of ballast tanks from a typical 35,000 dwt handysize bulk carrier. There are a total of ten rows of double bottom tank, hopper side tank, and topside tank bays. The topside tank bays are connected to the hopper tank bays via two connection pipes. The incoming fluid is pumped into the tank via a single inlet bellmouth. There are two exits that were modeled as flush with the tank top (not shown) directly above the two connection pipes to simulate an overflow condition. The tank floor openings and stiffeners were modeled based on tank drawings provided by Fednav International.
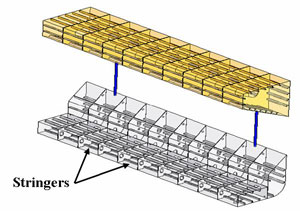
Figure 5: Tank grid with reinforcing stringers
In order to investigate the influence of the tank structures, two separate grids were developed for the full-scale tank, one with all of the tank structure as shown in Figure 5 and one that neglects the reinforcing stringers. The grid that did not include the stringers included approximately 1.3 million cells, while the grid that included the finer structural details required approximately 5.5 million cells. The inclusion of the stringers had a significant impact on the computational resources and time required to perform the simulations. A close-up comparison of the predicted salt water volume fraction in several cut planes near the inlet pipe are shown in Figure 6. In Figure 6(a) the lack of stringers allows the incoming fluid to spread more quickly through the first several tank bays, while in Figure 6(b) the presence of the stringers causes the incoming fluid to be trapped at various locations near the inlet.
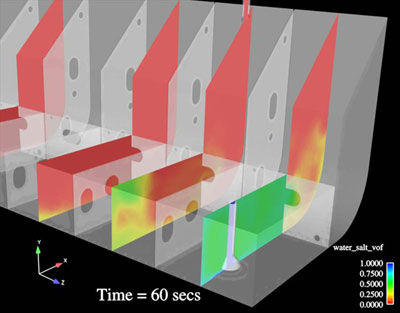
Figure 6a: Close up predicted salt water volume fraction without stringers
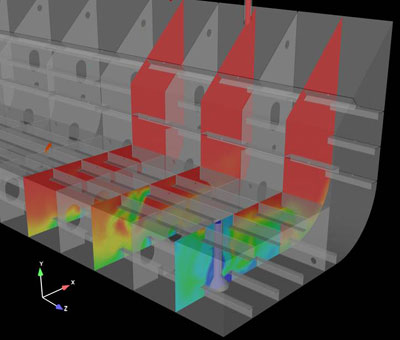
Figure 6b: Close up predicted salt water volume fraction with stringers
The influence of the stringers can also be seen in the integral of the volume fraction from the two different grids. Recall that there are two exit locations from the tank, simulating a deck overflow condition directly above the two connection pipes. A comparison of the predicted exchange efficiency for the two different geometries is shown in Figure 7, and tabulated in Table 2. The impact of including the stringers is clearly shown in Figure 7. When the stringers are neglected, there is significantly less obstruction to the dispersion of the incoming fluid, and the tank acts more like an open box. A larger amount of the incoming fluid reaches the tank exit much sooner than if the stringers were present. This causes the effluent concentration history to have a more diffuse profile, closer to that of a perfect mixing scenario, in which the incoming fluid becomes instantaneously mixed with the original fluid. This is not characteristic of the actual flow situation. It is clear that the perfect mixing assumptions are not valid.
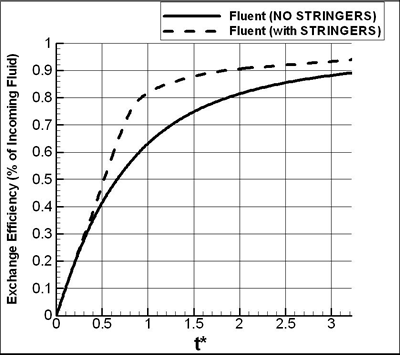
Figure 7: Comparison of predicted exchange efficiency with and without stringers
Table 2 Predicted Exchange Efficiency
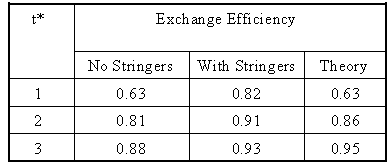
It is also interesting to note that based on the results of the simulation when stringers are included, this particular ballast tank would not meet the guidelines for achieving a 95% replacement after three volume exchanges. It is anticipated that this could be improved through structural modifications or additional exchange flow time.
Phase II - Plans
Phase II will expand the experimental data and verification of the computational outcomes over the full three-tank-volume exchange process. All work is being performed at the Naval Surface Warfare Center Carderock Division.
- Expand experimental facility to accommodate experiments over three complete tank volumes of water flow
- Conduct several physical model experiments over three complete tank volumes of flow.
- Compare and verify experimental outcomes with CFD model and adjust model accordingly to obtain maximum accuracy.
- Run verified CFD model for three tank volumes of exchange flow and document results
- Prepare final reports and papers.
Products
Wilson, W. P. Chang, S. Verosto, P. Atsavapranee, D.F. Reid and P.T. Jenkins. (2006). Computational and Experimental Analysis of Ballast Water Exchange. Proceedings, ASNE Marine Environmental Engineering Technical Symposium (MEETS), Jan 23-24, 2006, Arlington, VA.
Reid, D.F., S. Verosto, P. Chang, W. Wilson, P. Atsavapranee and P.T. Jenkins. 2005. Modeling of Ballast Water Mixing and Flow Dynamics to Understand Ballast Water Exchange. Proceedings, ENSUS 2005: Marine Science and Technology for Environmental Sustainability, April 13-15, 2005, Newcastle-Upon-Tyne, UK
![]()
![]()
Last updated: 2005-12-15 mbl