
Cytogenetic Biodosimetry Laboratory: The Process
Cytogenetic biodosimetry is used to identify damage to chromosomes in individuals who have been exposed to ionizing radiation. ORISE researchers use the latest technologies and software to quantify chromosomal abnormalities. This information is then used to calculate the radiation dose estimates that are used by physicians in determining the appropriate treatment for a patient.
The process involves many stages:
![]() Watch the process
(video transcript)
Watch the process
(video transcript)
|
|
 |
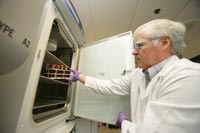 |
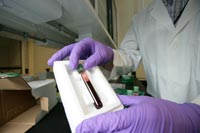
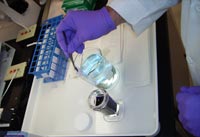
| Step 1: Blood samples are shipped at room temperature to the Cytogenetic Biodosimetry Laboratory in Oak Ridge, Tennessee. | Step 2: White blood cells, lymphocytes, are cultured under sterile conditions in an incubator using a standard growth medium for 48 hours. |
|
|
 |
 |
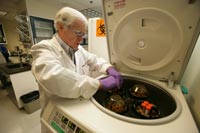
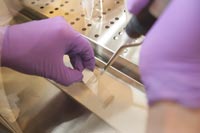
| Step 3: Culture tubes are centrifuged and cells are re-suspended in a weak salt solution, which allows the chromosomes to separate and spread evenly on slides. | Step 4: Further centrifugations and re-suspensions of the cells in fixative are performed to preserve the cells. |
 |
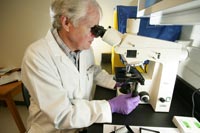 |
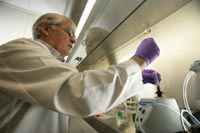
| Step 5: The fixed cell suspension is then dispensed on slides and allowed to dry in a controlled atmosphere. | Step 6: Metaphase spreads undergo a preliminary quality evaluation under the microscope. |
|
|
 |
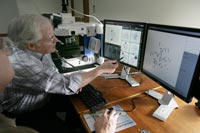 |
| Step 7: Chromosomes are stained making them visible in a microscope at 1,000x magnification. Slides are then mounted using very thin glass cover slips, which protect and preserve the cells. The metaphase spreads are now ready for microscopic analysis. | Step 8: The automated workstation, a motorized Zeiss microscope coupled with a slide changer, automatically locates metaphase spreads on the slide and can scan slides unattended overnight. |
|
|
 |
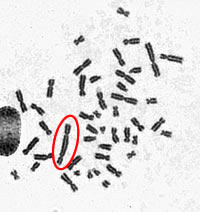 |
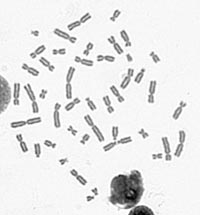
Image A |
Image B |
| Step 9: A digital photo of the metaphase spread is taken at 63x magnification. Image A displays a normal metaphase spread. Image B reveals a metaphase spread with a dicentric chromosome. A dicentric chromosome has two centromeres—the point where the two chromatids connect. The number of dicentric chromosomes is counted and compared to calibration curves to estimate radiation dose. | |