![[Movie icon]](mov.gif)
movie |
![[Camera icon]](pict.gif)
color image |
plot |
audio |
The type of file is denoted by the following icons:
|
movie |
color image |
plot |
audio |
Movie formats are QuickTime, MPEG, and animated GIFS. You need QuickTime or MPEG players for those formats. Animated GIF images may not work with some browsers or older versions of browsers.
The
2000 ozone hole over the arctic seen by EPTOMS. This image was
recently produced by Code 916 for use in a Textbook
The 1998 ozone hole as seen
by Earth Probe TOMS. These are TOMS data beautifully interpreted
by the Goddard Computer Visualization Studio.
The 1997 ozone hole movies.
The 1996 Earth Probe TOMS
ozone hole. The movies show the formation and breakup of the ozone
hole (August 1st - December 15th).
 The ozone hole size from 1979-2004. (102K)
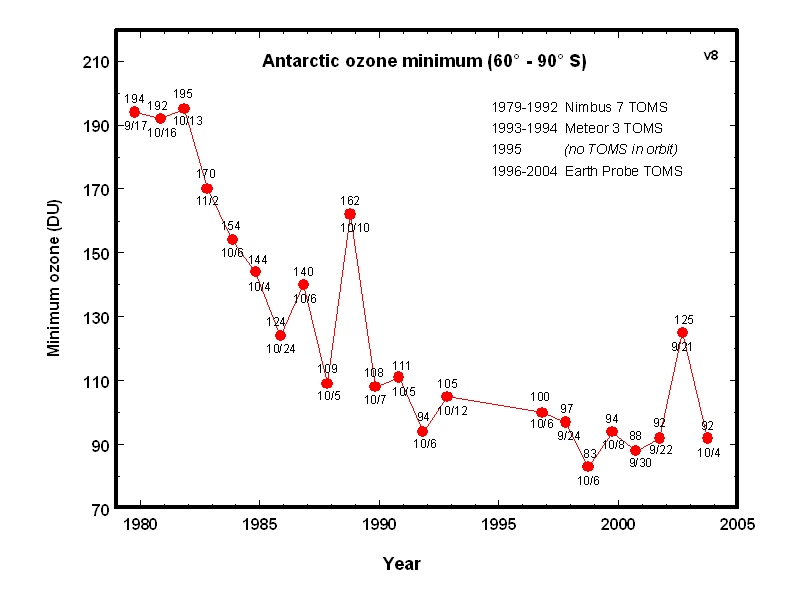
The ozone hole minima from 1979-2004.
(120K)
The global monthly average total ozone from 1979-2001.
(50K) [caption]
The ozone hole from 1979-1997 (Note:
No TOMS instrument was in orbit during 1995). (43K)
A combination of Nimbus-4 BUV (70-72) data and TOMS data
(79-93). The image depicts the growth of the Antarctic ozone
hole. (122K)
Low ozone was measured over
the North Hemisphere during the Spring of 1997.
Northern hemisphere ozone from 1979 to
1998. (45K)
Ozone at Arosa, Switzerland from 1926-1997. (20
Kb)
UV-Absorbing Aerosols and UV Radiation
A GIF animation showing daily images of Earth Probe
TOMS aerosol index for a major dust storm over China and Mongolia
in April, 1998.
The frequency
of occurrence of different types of UV-absorbing aerosols
in the troposphere during July, August, and September. (2K)
A GIF animation of the location of tropospheric, UV-absorbing
aerosols for Jul-Sept, 1988. (400K)
Images from Earth Probe TOMS
showing smoke from the fires
in Indonesia, Borneo, and other areas in the South Pacific.
Comparison of the TOMS aerosol
index with brightness temperature difference determined from AVHRR
for a volcanic ash cloud
from the eruption of Mt. Spurr in 1992.
Images from Earth Probe TOMS
showing volcanic
ash from the 26-Dec-97 eruption of Soufriere Hills, Montserrat.
Image showing DNA
spectral exposure over the United States for July, 1992 (determined
from the V7 Nimbus-7 data set).