This is an alphabetical list of all training modules, separated out by language, that are currently referenced on the MetEd Website. We also have a chronological listing of modules.
|
Modules Available in: English | Spanish | French | Russian | Portuguese
English
content level: 0=for non-scientists, 1=basic, 2=intermediate, 3=advanced
| Level |
Module Title and Link |
Quiz Link |

|
A Convective Storm Matrix: Buoyancy/Shear Dependencies
description (click to show/hide) |
Quiz
|
 Description: Description:
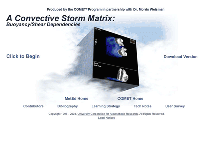
In order to help forecasters build a strategy for anticipating convective storm structures, their evolution, and the potential for severe weather, A Convective Storm Matrix provides learners the opportunity for extensive exploration of the relationship between a storm's environment and its structure.
The matrix is composed of 54 four-dimensional numerical simulations based on the interactions of 16 different hodographs and 4 thermodynamic profiles. By comparing animated displays of these simulations, learners are able to discern the influences of varying buoyancy and vertical wind shear profiles on storm structure and evolution.
A series of questions guides the exploration and helps to reveal key storm/environment relationships evident in the matrix. A synopsis of the physical processes that control storm structure, as well as the current conceptual models of key convective storms types, is included for reference.
Subject matter expects for A Convective Storm Matrix: Buoyancy/Shear Dependencies include Mr. Steve Keighton, Mr. Ed Szoke, and Dr. Morris Weisman.
Note: This module was originally published on CD-ROM in March 1996 (v1.1) and re-released in 2001 as v1.3 for Microsoft Windows users only. CD-ROM version 1.3 works fairly well with Windows 98/ME/NT4/2000 but has reported to be problematic with Windows XP. Users of version 1.1 should obtain the patch located at http://www.comet.ucar.edu/help/ModuleSupport/matrix_problem.htm or use the new, Web-based module.
Estimated time to complete: 3-4 h
Includes audio: no
Required plug-ins:  Flash Flash  RealPlayer RealPlayer  Java Java  Adobe® Reader® Adobe® Reader®
* Plug-in information
Last published on: 2003-04-09
close
|

|
A Social Science Perspective on Flood Events
description (click to show/hide) |
Quiz
|
 Description: Description:
This presentation by Dr. Eve Gruntfest raises important issues of how floods and other disasters, including land-falling hurricanes and their related warnings, affect public attitudes and actions. Awareness of these social science considerations is important for persons responsible for public weather warnings as well as other types of public interaction.
Estimated time to complete: 30 min
Includes audio: yes
Required plug-ins:  Flash Flash  RealPlayer RealPlayer  Java Java  Adobe® Reader® Adobe® Reader®
* Plug-in information
Last published on: 2001-03-26
close
|

|
Advanced Fire Weather Forecasters Course Orientation
description (click to show/hide) |
No Quiz
|
 Description: Description:
The “Advanced Fire Weather Forecasters Course Orientation” module introduces the organization of the course, the topics presented, and the intended audience, as well as the motivation for converting this course to online training. This web module is part of the Advanced Fire Weather Forecasters Course..
Objectives:
At the end of this module you should be able to:
1. Describe the structure of the Advanced Fire Weather Forecasters Course and component modules.
Estimated time to complete: 15 m
Includes audio: yes
Required plug-ins:  Flash Flash  RealPlayer RealPlayer  Java Java  Adobe® Reader® Adobe® Reader®
* Plug-in information
Last published on: 2008-06-12
close
|

|
Advances in Microwave Remote Sensing: Ocean Wind Speed and Direction
description (click to show/hide) |
Quiz
|
 Description: Description:
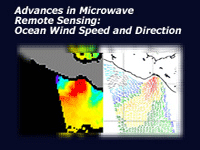
This Webcast covers the ocean surface wind retrieval process, the basics of microwave polarization as it relates to wind retrievals, and several operational examples. Information on the development of microwave sensors used to retrieve ocean surface wind speed and the ocean surface wind vector (speed and direction) is also included.
Objectives:
State some key meteorological applications for ocean surface winds
• Describe the benefits of using microwave remote sensing to observe ocean winds
• Describe the differences between active and passive microwave remote sensing
• Describe in general terms, the emission, transmission, and scattering of microwave energy within the Earth-atmosphere system
• State the key assumptions for derivation of wind speed and direction from passive observation of microwave radiation
• Describe the limitations of passive microwave remote sensing and impacts on deriving wind speed and direction (this applies to both product limits and accuracy)
• Use cloud liquid water imagery to help assess the validity of the wind speed and direction vector
Estimated time to complete: 45 min
Includes audio: yes
Required plug-ins:  Flash Flash  RealPlayer RealPlayer  Java Java  Adobe® Reader® Adobe® Reader®
* Plug-in information
Last published on: 2005-11-28
close
|

|
An Introduction to Ensemble Streamflow Prediction
description (click to show/hide) |
Quiz
|
 Description: Description:
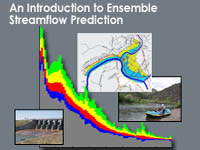
The “Introduction to Ensemble Streamflow Prediction” module provides basic information on probabilistic streamflow forecasting. In this webcast, Dr. Richard Koehler, the National Hydrologic Sciences Training Coordinator for NOAA's NWS, presents information about the types of organizations that might use probabilistic streamflow forecasts as well as foundation concepts and background for ESP methods. The module begins with a brief review of hydrologic models including deterministic, stochastic, and scenario-based approaches. It then provides an overview of time-series approaches including a summary of traditional techniques such as flood frequency, flood analysis, statistical analysis, and trend analysis. Finally, the module presents the basics of ESP techniques including an explanation of its strengths, weaknesses, and appropriate application. The module also provides guidance on how to interpret ensemble forecast products.
Objectives:
Describe terminology and definitions for Ensemble Streamflow Prediction, or ESP:
- Use standard language to describe ESP.
- Explain what time series, realizations, and ensembles represent.
- Describe basic processes using output from scenario-based deterministic models and traditional streamflow analysis methods.
Describe methods and techniques used in ESP:
- Describe current modeling methods and tools used in trace plots.
- Describe product output from ESP.
- Describe use of verification of ESP products.
Estimated time to complete: 60 min
Includes audio: yes
Required plug-ins:  Flash Flash  RealPlayer RealPlayer  Java Java  Adobe® Reader® Adobe® Reader®
* Plug-in information
Last published on: 2007-01-30
close
|

|
An Introduction to POES Data and Products
description (click to show/hide) |
No Quiz
|
 Description: Description:
A course outline is available online at http://www.comet.ucar.edu/class/POES_2001/outline.htm.
Estimated time to complete: 75 min
Includes audio: yes
Required plug-ins:  Flash Flash  RealPlayer RealPlayer  Java Java  Adobe® Reader® Adobe® Reader®
* Plug-in information
Last published on: 2002-07-09
close
|

|
An Introduction to the EUMETSAT Polar System
description (click to show/hide) |
Quiz
|
 Description: Description:
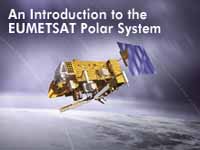
This Webcast provides an overview of the EUMETSAT Polar System (EPS), Europe's first dedicated operational polar-orbiting weather satellite program. EPS contributes to the Initial Joint Polar System (IJPS) under a cooperation agreement between EUMETSAT and NOAA to provide and improve operational meteorological and environmental forecasting and global climate monitoring services worldwide. The highly innovative features implemented with EPS include high-level sounding performance and enhanced data streams that further improve the capabilities of advanced NWP systems. The Webcast takes one hour to complete.
Objectives:
After completing this Webcast, learners will be able to:
* Identify the three major disciplines to which EPS contributes.
* Describe the role of EPS within the Global Operational Satellite Observation System (GOSOS) and the Initial Joint Polar-Orbiting Operational Satellite System (IJPS).
* Describe the main differences between polar and geostationary satellites.
* Describe the EPS programme elements and how they contribute to the flow of data products.
* Identify the instruments on the Metop satellite and their primary applications.
* Describe the capabilities and anticipated benefits of the IASI hyperspectral sounder.
* Describe the main services provided by EPS.
Estimated time to complete: 1 h
Includes audio: yes
Required plug-ins:  Flash Flash  RealPlayer RealPlayer  Java Java  Adobe® Reader® Adobe® Reader®
* Plug-in information
Last published on: 2006-09-22
close
|

|
An MCS Matrix
description (click to show/hide) |
Quiz
|
 Description: Description:
This module includes an interactive MCS Matrix of numerical simulations illustrating the physical processes controlling MCS evolution, as well as an archive of the entire Web module, Mesoscale Convective Systems: Squall Lines and Bow Echoes.
Patterned after the CD Module A Convective Storm Matrix, the new MCS Matrix provides learners the opportunity for extensive exploration of the relationship between a MCSs environment and its structure. The matrix is composed of 21 four-dimensional numerical simulations based on the interactions of 10 different hodographs with a common thermodynamic profile. By comparing animated displays of these simulations learners are able to discern the influences of vertical wind shear and the Coriolis Force on MCS structure and evolution.
A series of questions guides the exploration and helps to reveal key storm/environment relationships evident in the matrix.
The subject matter expert for this module is Dr. Morris Weisman.
Note: This module was originally published 5/28/99 as a CD-ROM (v1.0) as dual module along with a local copy of the Web module Mesoscale Convective Systems: Squall Lines and Bow Echoes (v3.0). The CD-ROM version of An MCS Matrix (1.0) works fairly well with Windows 98/ME/NT4/2000 but has reported to be problematic with Windows XP. Windows XP Users of version 1.0 should use the new, Web-based module.
Estimated time to complete: 3-4 h
Includes audio: no
Required plug-ins:  Flash Flash  RealPlayer RealPlayer  Java Java  Adobe® Reader® Adobe® Reader®
* Plug-in information
Last published on: 2003-04-17
close
|

|
Analyzing Ocean Swell
description (click to show/hide) |
Quiz
|
 Description: Description:
This module describes the main elements to consider when analyzing wave model and buoy data. The module focuses on data products available from NOAA including spectral plots, maps, and text bulletins. East and West Coast wave-masking exercises conclude the module. The content in this module is an excerpt from the previously published COMET module Rip Currents: Forecasting .
Objectives:
At the end of this module, you should be able to do the following:
* Describe wave data available from the NDBC website and its limitations
* Using a spectral density plot for a buoy:
(1) Determine the number of wave groups
(2) Determine the peak period
* List the parameters that are determined by a wave model
* Describe a polar wave spectrum plot
* Describe the information available in a NWW3 text bulletin
* Use a polar wave spectrum plot to determine the following:
(1) direction and period of wind waves and swell groups
(2) number of wave/swell groups
* Use a NWW3 text bulletin to determine the following:
(1) direction, period, and significant wave height of wind waves and swell groups
(2) number of wave/swell groups
* Using buoy observations and wave model products determine the height and period of swell likely to strike a given coastline
* Describe what is meant by wave masking and how it might affect a surf forecast along the coast
* Using buoy observations and wave model products determine whether a wave model initialized well
* Describe the conditions under which a wave model simulation might be in error, and what errors might subsequently result
Estimated time to complete: 1 h
Includes audio: yes
Required plug-ins:  Flash Flash  RealPlayer RealPlayer  Java Java  Adobe® Reader® Adobe® Reader®
* Plug-in information
Last published on: 2008-08-13
close
|

|
Antarctica: Challenging Forecasts for a Challenging Environment
description (click to show/hide) |
Quiz
|
 Description: Description:
Antarctica: Challenging Forecasts for a Challenging Environment features two educational pieces. The first is the overview giving the general audience a broad look at Antarctica including some history, interesting facts, real-life experiences, climate, and the challenges inherent to this frozen continent. The second is the main presentation where experts in Antarctic research and forecasting, share their knowledge of the continent. They discuss forecasting challenges as well as present and future research topics while providing elaborations on the uniqueness in Antarctica’s location, topography, and forecasting techniques as compared to other parts of the globe.
Objectives:
1. Give the general audience a basic understanding of the uniqueness of Antarctica.
2. Give prospective Antarctic forecasters or meteorology students an understanding of the challenges in forecasting weather in Antarctica.
3. Provide students an overview of the tools used to monitor and forecast Antarctica’s weather.
4. Describe the connection of Antarctica with the rest of the earth’s climate system and the research that seeks to discover how it influences that system.
Estimated time to complete: 90 min
Includes audio: yes
Required plug-ins:  Flash Flash  RealPlayer RealPlayer  Java Java  Adobe® Reader® Adobe® Reader®
* Plug-in information
Last published on: 2007-08-14
close
|

|
Anticipating Convective Storm Structure and Evolution
description (click to show/hide) |
No Quiz
|
This module is not available on the Web. To order a CD, please see our contact information.
 Description: Description:
The primary purpose of the Anticipating Convective Storm Structure and evolution module is to provide forecasters a strategy for anticipating storm structures, their evolution, and the potential for severe weather, based on an understanding of the physical processes that control their development. Because convective storms develop rapidly, having the right set of expectations of what is possible and probable within the storm environment will allow forecasters to better manage their activities during a convective event.
A traditional approach to teaching about convective storms has been to discuss several classic storm types that reveal distinctive structural elements. However, these classic storm types are not the norm. In nature, thunderstorms exist along a continuous spectrum of possible structures rather than always falling into discrete categories. Storms often exhibit qualities of more than one classic type or evolve from one type into another during their life cycle. For this reason, this module examines convective storms based on the predominant physical processes involved in their development that tend to place them in a particular region of the spectrum.
Because forecasters also need to accurately monitor the evolution of convective storms in order to issue timely weather warnings and statements, this module will also demonstrate methods for monitoring storm evolution through the available data (in particular, modern radar data), based on a thorough understanding of the current conceptual models of convective storms. Numerous interactions and a set of summary exercises are included. Summary Page--Key Points to Remember are available online at http://meted.ucar.edu/convectn/mod8sumpag.pdf.
Subject matter expects for Anticipating Convective Storm Structure and Evolution include Dr. Morris Weisman, Steve Keighton, and Ed Szoke.
Estimated time to complete: 8-10 h
Includes audio: yes
Required plug-ins:  Flash Flash  RealPlayer RealPlayer  Java Java  Adobe® Reader® Adobe® Reader®
* Plug-in information
Last published on: 1997-04-29
close
|

|
Anticipating Hazardous Weather and Community Risk
description (click to show/hide) |
No Quiz
|
 Description: Description:
Hazardous weather affects us all. To help local emergency managers cope with weather hazards they may face, the Federal Emergency Management Agency (FEMA) and the National Oceanic and Atmospheric Administration's (NOAA) National Weather Service (NWS) offer a course titled Hazardous Weather and Flooding Preparedness. However, many people who make weather-related decisions are unable to attend this 2-3 day course.
The purpose of this Web-based course, Anticipating Hazardous Weather and Community Risk, is to provide background on weather and weather hazards for emergency managers and other decision makers. This course is intended to complement on-site courses offered by FEMA and NWS, so that they can focus on local hazards and community risk factors.
This course covers…
Weather: How and why it forms,
Hazardous weather: Fact sheets on different phenomena,
Forecasting weather: The forecast process and products issued by the NWS,
Warning Partnership: How the NWS and emergency managers generate and communicate warnings, and a
Desktop Exercise: An opportunity to apply what you have learned in a flash flood scenario.
FEMA Independent Study credit is available for those who complete the course and pass the exam. The subject matter experts for Anticipating Hazardous Weather and Community Risk are Randall C. Duncan, CEM - Sedgwick County (KS) Emergency Management, Bob Glancy - NWS, Bob Goldhammer - Polk County (IA) Emergency Management, Curt Nellis - County of Shenandoah (VA) Department of Fire and Rescue, John Ogren - NWS, and Bruce Sterling - Portsmouth (VA) Emergency Management.
Objectives:
• Explain basic processes that cause and/or signal hazardous weather
• List the main weather hazards and the factors that determine community risk
• Describe the basic weather forecasting process and its limitations
• Discuss various techniques for communicating information about weather hazards
• Distinguish which NWS forecast products are appropriate in various situations
• Analyze various source of information about a weather hazard and formulate a plan for dealing with a potential disaster
Estimated time to complete: 4-5 h
Includes audio: yes
Required plug-ins:  Flash Flash  RealPlayer RealPlayer  Java Java  Adobe® Reader® Adobe® Reader®
* Plug-in information
Last published on: 2001-03-08
close
|

|
Applying Diagnostic and Forecast Tools: Forecasting Fog and Low Stratus
description (click to show/hide) |
Quiz
|
 Description: Description:
This module discusses how to apply various observational data and remote sensing tools such as satellite, METARS, soundings, profilers, radar, and model analyses to diagnose the potential for fog and/or low stratus. Various forecast tools (such as model forecast fields, forecast soundings, and BUFKIT) used to assess fog and/or low stratus potential onset, intensity, and duration are also examined. This module is part of the Distance Learning Course 1: Forecasting Fog and Low Stratus.
Objectives:
• Apply various observational data and remote sensing tools such as satellite, METARS, soundings, profilers, radar, and model analyses to diagnose the potential for fog and/or low stratus
• Apply various forecast tools such as model forecast fields, forecast soundings, and BUFKIT to assess fog and/or low stratus potential onset, intensity, and duration
Estimated time to complete: 3 h
Includes audio: no
Required plug-ins:  Flash Flash  RealPlayer RealPlayer  Java Java  Adobe® Reader® Adobe® Reader®
* Plug-in information
Last published on: 2003-06-28
close
|

|
Assessing Climatology in Fog/Stratus Forecasting
description (click to show/hide) |
Quiz
|
 Description: Description:
This module addresses the local and regional climatological considerations and presents tools and methodologies that can be used to assess whether atmospheric conditions can foster fog or low stratus development. Knowing your local climatology and assessing whether it supports favorable conditions for fog or low stratus development is an important step in the forecast process. A number of physical conditions that determine fog or stratus development are largely dictated by climatological restraints, as well as the synoptic pattern. This module is part of the Distance Learning Course 1: Forecasting Fog and Low Stratus.
Objectives:
Understand how climate data can be applied to the forecast process
• Understand the strength and limitations of the various types of climate data and their application to fog and stratus forecasting
• Demonstrate an ability to correctly apply climate data to fog and stratus forecasting
Estimated time to complete: 2 h
Includes audio: no
Required plug-ins:  Flash Flash  RealPlayer RealPlayer  Java Java  Adobe® Reader® Adobe® Reader®
* Plug-in information
Last published on: 2003-06-28
close
|

|
Assessing Fire Danger
description (click to show/hide) |
Quiz
|
 Description: Description:
The “Assessing Fire Danger” distance learning module explores techniques for recognizing weather and fuel conditions contributing to fire danger. The module includes a matrix of data sources offering useful weather, fuels, and other information related to fire ignition, spread, and intensity. An overview of situational awareness practices provides information relevant to forecasters in the office or field. This module is part of the Advanced Fire Weather Forecasters Course.
Objectives:
At the end of this module you should be able to:
1. Describe the fire “setup” stage and identify weather patterns that lead to fuel dryness,
2. understand fuel dryness evolution and how it relates to the National Fire Danger Rating System (NFDRS),
3. describe specific fire weather and fuel data sources that aid in determining fuel susceptibility,
4. apply situational awareness concepts to fire weather forecasting operations.
Estimated time to complete: 1 h
Includes audio: no
Required plug-ins:  Flash Flash  RealPlayer RealPlayer  Java Java  Adobe® Reader® Adobe® Reader®
* Plug-in information
Last published on: 2008-03-31
close
|

|
Australian Severe Thunderstorm Case Studies
description (click to show/hide) |
No Quiz
|
 Description: Description:
In this Southern Hemisphere-focused module, the student can work through one major Australian severe thunderstorm event in detail and examine aspects of two other severe thunderstorm events as well. Follow a forecast time-line to assess data and make decisions from the pre-storm phase through the warning phase.
NOTE: The Bureau of Meteorology owns this modue, NOT the COMET Program.
Estimated time to complete: 4-6 h
Includes audio: no
Required plug-ins:  Flash Flash  RealPlayer RealPlayer  Java Java  Adobe® Reader® Adobe® Reader®
* Plug-in information
Last published on: 2003-04-23
close
|

|
Barrier Jet Forecasting: Eastern Foothills and High Plains of Colorado, 17-20 March 2003
description (click to show/hide) |
Quiz
|
 Description: Description:
This case exercise looks at a barrier jet event over central and eastern Colorado that took on historic significance in terms of snow amounts and variability in snow distribution. The module emphasizes the mechanisms for producing both very large accumulations and extreme small-scale variability. These mechanisms involved both dynamic and thermodynamic processes in this storm. Model and observed analyses and forecasts are considered in detail as the storm unfolds.
Objectives:
• Analyze a Rocky Mountain Front Range heavy precipitation event to determine the influence of a barrier jet on both precipitation type and amount.
• Forecast critical storm features in a barrier jet case, including winds and precipitation type and intensity.
• Monitor the development of the barrier jet features in the context of the larger-scale forcing.
• Examine the important processes governing the termination of the storm.
Estimated time to complete: 2-3 h
Includes audio: yes
Required plug-ins:  Flash Flash  RealPlayer RealPlayer  Java Java  Adobe® Reader® Adobe® Reader®
* Plug-in information
Last published on: 2006-07-27
close
|

|
Basic Hydrologic Sciences Course Orientation
description (click to show/hide) |
No Quiz
|
 Description: Description:
This brief presentation provides an overview of the COMET Basic Hydrologic Sciences course including: goal and target audiences, structure of the course and adapting it to your needs, and a brief description of course components.
Objectives:
1. Describe goal and target audiences of the COMET Basic Hydrologic Sciences course.
2. Be familiar with the structure of the Basic Hydrologic Sciences course and how to adapt it to your needs.
3. Briefly describe the course components of the Basic Hydrologic Sciences course.
Estimated time to complete: 15 min
Includes audio: yes
Required plug-ins:  Flash Flash  RealPlayer RealPlayer  Java Java  Adobe® Reader® Adobe® Reader®
* Plug-in information
Last published on: 2007-10-01
close
|

|
Basic Terminal Forecast Strategies
description (click to show/hide) |
Quiz
|
 Description: Description:
“Basic Terminal Forecast Strategies” is the first component of the Distance Learning Course 2, Producing Customer-Focused TAFs. Basic Terminal Forecast Strategies is comprised of two lessons that provide 1) an introduction to understanding aviation customers and their needs and 2) a technique to meet those needs by producing clear, concise, and consistent terminal aerodrome forecasts (TAFs).
Objectives:
1. Identify aviation customer groups and describe how they use TAFs.
2. Recognize common terminal forecast problems that adversely impact customers.
3. Analyze TAFs to determine which would be considered "good" or "poor" by customers.
4. Describe how overuse of conditional terms (e.g., TEMPO) lowers forecast verification scores and impedes effective customer decision-making.
5. Describe the relationship between aviation verification scores and customer satisfaction.
6. Create a Practically Perfect TAF (PP TAF) that meets common customer needs.
Estimated time to complete: 2 h
Includes audio: yes
Required plug-ins:  Flash Flash  RealPlayer RealPlayer  Java Java  Adobe® Reader® Adobe® Reader®
* Plug-in information
Last published on: 2006-09-22
close
|

|
Blowing Snow: Baker Lake, Nunavut, Canada 04-10 February 2003
description (click to show/hide) |
Quiz
|
 Description: Description:
This case exercise takes an in-depth look at a blowing snow event in the northern mainland of Canada. The case addresses specific low-level wind and snow conditions. Model data, satellite imagery, and observations are provided for assessing the potential for blowing snow and blizzard conditions as the event unfolds.
Objectives:
1. Review the winter climatology of this central Canadian region.
2. Recognize the specific low-level wind and snow conditions conducive to blowing snow/blizzard conditions.
3. Recognize the common synoptic patterns associated with a blowing snow event.
4. Consider the wind speed and direction forecasts for this event.
5. Examine the cessation of blowing snow conditions, from a forecasting standpoint.
Estimated time to complete: 60 min
Includes audio: yes
Required plug-ins:  Flash Flash  RealPlayer RealPlayer  Java Java  Adobe® Reader® Adobe® Reader®
* Plug-in information
Last published on: 2004-11-08
close
|

|
CAMEO/HYSPLIT
description (click to show/hide) |
Quiz
|
 Description: Description:
This Webcast is an introduction by Dr. Alan Czarnetski of the University
of Northern Iowa to the CAMEO and HYSPLIT Models. CAMEO is often used by emergency managers to estimate local impacts (within 10 km) from a
hazardous atmospheric release. It consists of three main modules: a
chemical database, a dispersion model, and a mapping application. The
HYSPLIT model is a long-range transport and dispersion model that is
commonly used to track releases from nuclear power plants and smoke plumes
from forest fires. The module assumes that the user has already viewed the
Webcast, "Dispersion Basics", available from the main menu under
Topics|Other.
Objectives:
• Describe the CAMEO model and its three components
• Explain the inputs required for a CAMEO run
• Describe the HYSPLIT model and its required inputs
• Explain the uses and limitations of both models
Estimated time to complete: 33 min
Includes audio: yes
Required plug-ins:  Flash Flash  RealPlayer RealPlayer  Java Java  Adobe® Reader® Adobe® Reader®
* Plug-in information
Last published on: 2003-02-17
close
|

|
Canadian EPV Charts
description (click to show/hide) |
No Quiz
|
 Description: Description:
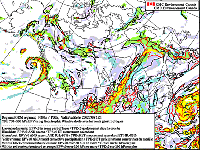
The goal of the EPV chart is to aid operational forecasters in predicting CSI and slantwise convection. The description includes links to the online chart, which is updated twice daily by the CMC, as well as a list of synoptic considerations that will support your use of the EPV chart in identifying regions favorable for CSI and slantwise convection.
Estimated time to complete: 20 min
Includes audio: no
Required plug-ins:  Flash Flash  RealPlayer RealPlayer  Java Java  Adobe® Reader® Adobe® Reader®
* Plug-in information
Last published on: 2002-01-05
close
|

|
Case Study: A New England Fog Event
description (click to show/hide) |
Quiz
|
 Description: Description:
This case examines an event that took place over New England and the Mid-Atlantic on 14 June 2001. As the culminating exercise for lessons 1 and 2 of the Distance Learning Aviation Course 1 (DLAC1) on Fog and Stratus Forecasting, its objectives are to 1) identify the preconditions favorable for fog or stratus development; 2) identify synoptic and local processes that influence the event; 3) assess onset time, duration, dissipation, and intensity; and 4) develop a TAF that reflects expected changes in ceiling and visibility. The module is a re-creation of several live teletraining sessions offered in 2003 as part of DLAC1.
Objectives:
• Identify the preconditions favorable for fog or stratus development
• Identify both the synoptic and local processes that will be influencing the event
• Determine the details of the forecast in terms of the onset time, the duration, and the time of dissipation, as well as the intensity of the event
• Assess how the fog or stratus event will affect ceiling and visibility
• Write a TAF forecast that reflects those changes in ceiling and visibility
Estimated time to complete: 2 h
Includes audio: yes
Required plug-ins:  Flash Flash  RealPlayer RealPlayer  Java Java  Adobe® Reader® Adobe® Reader®
* Plug-in information
Last published on: 2004-07-15
close
|

|
Case Study: A Northern Plains Cold-Air Outbreak Event
description (click to show/hide) |
Quiz
|
 Description: Description:
This case study focuses on making a forecast and writing a TAF so that it best represents the meteorological situation to aviation customers. During the exercise, the student prepares a forecast for Sioux Falls, South Dakota. As part of the Distance Learning Aviation Course 1 (DLAC1) on Fog and Stratus Forecasting, the exercise applies concepts taught in the rest of the course, with special emphasis on determining the impacts on airfield flight operations and creating a TAF that describes those impacts. The module is a re-creation of several live teletraining sessions offered in 2003 as part of DLAC1.
Objectives:
• Use model analyses, forecast products, soundings, and climatology to write a customer-friendly TAF
• Evaluate the impacts of forecasted ceiling and visibility conditions on the airfield operations
• Verify the accuracy and usefulness of your TAF
Estimated time to complete: 2 h
Includes audio: yes
Required plug-ins:  Flash Flash  RealPlayer RealPlayer  Java Java  Adobe® Reader® Adobe® Reader®
* Plug-in information
Last published on: 2004-07-15
close
|

|
Challenges of Forecasting in the West
description (click to show/hide) |
Quiz
|
 Description: Description:
During this presentation, Dr. Brad Colman (NOAA/NWS) covers both the philosophical and methodological approaches to weather forecasting in general, with a special emphasis on challenges introduced in areas of complex terrain. The insightful comments made by the presenter regarding recommended approaches to applying conceptual models, mesoscale model output, and decision trees in the forecast process are useful to anyone who predicts the weather.
Objectives:
• Review the forecast process.
• Become aware of the challenges of forecasting in the diverse terrain of the Western U.S.
• Review the characteristics of mesoscale circulations.
• Describe the impact of complex terrain on simple geostrophic flow.
• Compare and contrast objective and subjective forecasting techniques.
Estimated time to complete: 35 min
Includes audio: yes
Required plug-ins:  Flash Flash  RealPlayer RealPlayer  Java Java  Adobe® Reader® Adobe® Reader®
* Plug-in information
Last published on: 2003-12-22
close
|

|
Coastally Trapped Wind Reversals
description (click to show/hide) |
Quiz
|
 Description: Description:
This module starts with a forecast scenario that occurs along the California coast. The module then proceeds to describe the structure and climatology of these disturbances, as well as their synoptic and mesoscale evolution. The instruction concludes with a section on forecasting coastally trapped wind reversals. The module also includes a concise summary for quick reference and a final exam to test your knowledge. Like other modules in the Mesoscale Meteorology Primer, this module comes with audio narration, rich graphics, and a companion print version.
Objectives:
At the end of the module you should be able to do the following things:
With regard to characteristics of CTWRs
• Describe how pressure, temperature, and wind change with passage of a coastally trapped wind reversal (CTWR)
• Recall how quickly CTWRs propagate up the U.S. West Coast
• Recall why SLP rises after passage of a CTWR
• Locate areas likely to experience CTWRs on a physical map of the world
• Recall the frequency of CTWRs along the California coast
• Explain why CTWRs are best explained as a Kelvin wave, rather than a gravity wave
With regard to the structure of CTWRs
• Describe how the MBL changes with passage of a CTWR
• Recognize how a cross-coast profile of the MBL changes during a CTWR
• Recognize a CTWR on a wind profiler record
• Recall the height at which wind first reverses direction as a CTWR propagates
• Recall the association of stratus formation with CTWRs
With regard to the synoptic evolution of CTWRs
• Describe how MSLP, 850-mb heights, and 500-mb heights depart from climatologic norms during a CTWR
• Describe how changes in MSLP and 850-mb pressure force low-level offshore winds, and how this affects sensible weather along the coast
• Describe how variations in MSLP affect along-shore pressure gradients
With regard to the mesoscale evolution of CTWRs
• Recall how the synoptic setup forces the mesoscale offshore low
• Recall how the offshore low moves during a CTWR
• Describe how coastal mountains force ageostrophic flow
• Recall how coastal mountains contribute to warming of offshore winds
• Describe how and why a mesoscale high forms along the coast
• Recall the factors that cause northward propagation of the CTWR
With regard to forecasting CTWRs
• Recall the 3 best synoptic clues for forecasting a CTWR
• Recall where the offshore low forms with respect to the low-level offshore flow
• Recall where the stratus surge initiates with respect to the offshore low
• Describe the use and limitations of mesoscale NWP models in predicting CTWRs
Estimated time to complete: 1.5-2 h
Includes audio: yes
Required plug-ins:  Flash Flash  RealPlayer RealPlayer  Java Java  Adobe® Reader® Adobe® Reader®
* Plug-in information
Last published on: 2002-08-06
close
|

|
Cold Air Damming
description (click to show/hide) |
Quiz
|
 Description: Description:
Cold Air Damming is part of the Mesoscale Meteorology Primer series. This module first presents a Navy forecast scenario prior to the development of a major cold air damming (CAD) event along the east slopes of the Appalachian Mountains. Then, from a conceptual standpoint, the classic CAD scenario is described in detail, both from an observational and modeling standpoint.
Objectives:
After completing this module, the learner should be able to do the following things:
Characterize cold air damming
• Identify the elements that are required for a CAD event.
• Identify sensible weather phenomena associated with cold air damming.
• Describe the nature and importance of overrunning winds in a CAD event.
• Describe the conditions leading to a barrier jet during a CAD event.
• Identify the origin of precipitation particles in a CAD event.
• Locate the deepest part of the pool of cold air in a CAD event.
Classify CAD events
• Recognize the three different types of CAD events.
• Recall the different cooling processes important to cold air damming.
• Describe the role different cooling processes play in the different types of CAD events.
• Match cooling processes to their respective causes.
Describe the climatology of cold air damming
• Identify geographically where CAD events occur.
• Remember the climatology of CAD events for the following:
• Seasonal occurrence,
• Probability of occurrence, and
• Duration of events
Identify a CAD event
• Identify a CAD event from synoptic MSLP, 850 mb, and 500 mb pressure charts.
• Identify a CAD event from soundings.
• Identify a CAD event from surface observations.
Forecast the start of a CAD event
• Using MSLP charts, identify the synoptic conditions that lead to cold air damming for the Appalachians and other mountain ranges, including the Rocky Mountains, Alps, and Andes.
• Identify atmospheric conditions that lead to terrain blocking and cold air damming.
• Recognize the limitations of forecast models in a predicting a CAD event.
Forecast the end of a CAD event
• Using synoptic charts, choose the charts that indicate dissipation of a CAD event in a 24-hour time frame.
• From soundings, recognize the atmospheric conditions leading to dissipation of a CAD event.
• Identify surface observations that indicate the dissipation of a CAD event.
Estimated time to complete: 1-1.5 h
Includes audio: yes
Required plug-ins:  Flash Flash  RealPlayer RealPlayer  Java Java  Adobe® Reader® Adobe® Reader®
* Plug-in information
Last published on: 2001-06-18
close
|

|
Community Hurricane Preparedness
description (click to show/hide) |
No Quiz
|
 Description: Description:
The Federal Emergency Management Agency (FEMA) and the National Oceanic and Atmospheric Administration's National Weather Service (NWS) annually hold courses, called An Introduction to Hurricane Preparedness, at the National Hurricane Center in Miami, Florida. The number of students who can attend every year is far less than the number of people who are involved in making decisions during hurricanes.
The purpose of this computer-based course, Community Hurricane Preparedness, is to provide emergency managers and decision makers who cannot attend the course with basic information about
How hurricanes form
The hazards they pose
How the NWS forecasts future hurricane behavior
What tools and guiding principles can help emergency managers prepare their communities
Community Hurricane Preparedness is not intended to take the place of the Miami course or other courses sponsored by FEMA and/or state agencies. However, it will provide a good background for those who have not yet attended those courses.
The subject matter experts for Community Hurricane Preparedness are Max Mayfield – NWS, William Massey – FEMA, Dr. Robert Smith – FEMA, John Wilson – Lee County Division of Public Safety, and William Winn, Jr. – Beaufort County Emergency Management Department.
Objectives:
• Describe the basic processes and factors that contribute to the development, growth and demise of a hurricane
• Identify the parts of a hurricane
• List ways in which meteorologists monitor hurricane development
• Describe hazards from hurricanes
• Discuss the basic hurricane forecasting process and its limitations
• Analyze various source of information about a hurricane and formulate a plan for dealing with the potential disaster
Estimated time to complete: 4-5 h
Includes audio: yes
Required plug-ins:  Flash Flash  RealPlayer RealPlayer  Java Java  Adobe® Reader® Adobe® Reader®
* Plug-in information
Last published on: 1999-12-10
close
|

|
Conceptual Models of Tropical Waves
description (click to show/hide) |
Quiz
|
 Description: Description:
Tropical waves are prolific rainfall producers that sometimes form tropical cyclones. Conceptual models of tropical waves are used to help learners understand the dynamical characteristics and evolution of tropical waves. Users will learn about the vertical and horizontal structure of tropical waves and the typical weather changes that accompany the passage of a tropical wave. Four different methods of tracking tropical waves are also provided. The Webcast is presented by Mr. Horace Burton and Mr. Selvin Burton of the Caribbean Institute for Meteorology and Hydrology under the auspices of the MeteoForum Project.
Objectives:
After completing this Webcast, users should be able to:
- Define tropical waves and state why they are important
- Describe the typical wavelength, frequency, propagation speed, and direction of tropical waves
- Describe the horizontal structure and vertical structure of tropical waves in terms of winds, moisture and temperature
- Describe the lifecycle of Reihl's Classical easterly wave in terms of wind velocity, relative humidity, clouds, and precipitation
- Identify tropical waves based on Frank's Inverted 'V' model, i.e., banded clouds in the shape of an inverted 'V'
- Describe the relationship between the upper and lower troposphere flow in Frank's conceptual model
- Describe the characteristics of African waves including their origin, wavelength, and relative intensity between inland and the coast
- Describe the typical distribution of divergence in African waves
- Describe the distribution of vorticity in African waves
- Describe the distribution of clouds and precipitation in African waves
- Understand that inter-annual variations in the frequency and strength of African waves are correlated with the occurrence of intense Atlantic storms
- Detect and track tropical waves using satellite imagery, satellite-derived surface winds, wind profiles, and model output
Estimated time to complete: 35 min
Includes audio: yes
Required plug-ins:  Flash Flash  RealPlayer RealPlayer  Java Java  Adobe® Reader® Adobe® Reader®
* Plug-in information
Last published on: 2006-04-21
close
|

|
Creating a Local Climate Product Using Composite Analysis
description (click to show/hide) |
Quiz
|
 Description: Description:
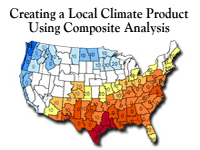
This Webcast features Heather Hauser of NOAA/ERH/SSD describing the utility of and introducing the methodology for conducting composite analysis as part of the NWS Climate Services program. This 30-minute presentation is intended to introduce climate focal points to the composite analysis process and will be a useful prerequisite to attending the Operational Climate Services residence courses, where the topic will be explored further. Composite analysis is the foundation of a forthcoming local climate-related product, the "3 Month Outlook of Local El Nino/La Nina Impacts."
Objectives:
1. To describe the rationale and utility of composite analysis
2. To identify other training available on composite analysis
3. To ensure that climate focal points know the operational roles and expectations at NWS field offices, and
4. To describe the general methodology for conducting composite analysis
Estimated time to complete: 30 min
Includes audio: yes
Required plug-ins:  Flash Flash  RealPlayer RealPlayer  Java Java  Adobe® Reader® Adobe® Reader®
* Plug-in information
Last published on: 2005-07-01
close
|

|
Creating Meteorological Products from Satellite Data
description (click to show/hide) |
Quiz
|
 Description: Description:
This module presents an overview of how satellite data are turned into the satellite products used by operational forecasters and the research and educational communities, etc. The module begins by describing the process of creating simple image products that use relatively simple image manipulation techniques to highlight properties such as wind-blown dust, vegetation, and cloud phase. The module then describes some of the more complex processes involved in generating quantitative products, such as cloud identification, atmospheric instability, wildfire characterization, and sea surface temperature. Finally, the module introduces advanced products that use the thousands of channels on hyperspectral instruments to derive a variety of geophysical parameters related to the characterization of aerosols, trace gases, cloud microphysics, and atmospheric profiling, etc. The discussion of quantitative products uses the example of the Meteosat cloud mask, which indicates whether a pixel in a satellite image is clear or cloudy. Cloud mask products are important to all environmental satellites in that they form the basis for many other derived products.
Objectives:
After completing this Webcast, learners will be able to:
* List the benefits of using satellite products.
* For the three levels of products (simple, quantitative, and “cutting edge”), define the type of product, describe its advantages and, on a very basic level, some of the production techniques and strategies, and identify several products generated by it.
* Describe the purpose and function of cloud mask products.
* Describe some of the sources of error in the product generation process.
Estimated time to complete: 1 h
Includes audio: yes
Required plug-ins:  Flash Flash  RealPlayer RealPlayer  Java Java  Adobe® Reader® Adobe® Reader®
* Plug-in information
Last published on: 2008-06-23
close
|

|
Customer Impacts: Forecasting Fog and Low Stratus
description (click to show/hide) |
Quiz
|
 Description: Description:
This module addresses issues surrounding the direct and indirect impacts of restricted ceilings and visibilities on aviation operations and also briefly examines their impacts on ground and marine transportation. The goal is improve forecaster awareness of how their forecasts of these events affect commercial and general aviation operation. This module is part of the Distance Learning Course 1: Forecasting Fog and Low Stratus.
Objectives:
• Increase awareness of the various users of ceilings and visibility forecasts and how forecasts of these conditions impact (both positively and negatively) aviation operations within each user group
o Improve forecaster understanding of the impacts of reduced visibility and ceilings on commercial and general aviation operations
o Improve forecaster understanding of the impact to aviation operations from forecasts (TAFs) of reduced ceiling and visibility due to fog and low stratus
o Provide recommendations on how and when to amend TAFs to best reflect current and forecast conditions
• Increase awareness of the need to be knowledgeable about supported airport configurations
• Increase knowledge of critical thresholds and their variations from one airport to another and one user group to another
Estimated time to complete: 1 h
Includes audio: no
Required plug-ins:  Flash Flash  RealPlayer RealPlayer  Java Java  Adobe® Reader® Adobe® Reader®
* Plug-in information
Last published on: 2003-06-28
close
|

|
Dams and Dam Failure - Module 1: Terminology and Open Channel Hydraulics
description (click to show/hide) |
Quiz
|
 Description: Description:
This is the first module of a two-part series offering an introduction to the science explaining catastrophic dam failure and flood-wave prediction methods associated with these events. Through use of rich illustrations, animations, and interactions, this module explains key terminology and concepts including dam types and purposes, failure statistics, the general dam failure process, open channel hydraulics, critical flow, Manning's equation, and conveyance. The information covered in this two module series will provide a scientific foundation for advanced course work needed to run dam break simulations and to conduct hydraulic modeling as a part of dynamic wave forecasting.
Objectives:
After completing this module you should be able to:
* Define dam-related terminology
* Identify dam types and purposes
* Be familiar with dam failure modes and statistics
* Comprehend the basic principles of open channel hydraulics
* Recognize subcritical, critical, and supercritical flow conditions
* Understand the elements of Manning’s equation
* Be familiar with the concept of conveyance
Estimated time to complete: 45 min
Includes audio: yes
Required plug-ins:  Flash Flash  RealPlayer RealPlayer  Java Java  Adobe® Reader® Adobe® Reader®
* Plug-in information
Last published on: 2008-03-19
close
|

|
Dams and Dam Failure - Module 2: St. Venant Equations, Modeling, and Case Study
description (click to show/hide) |
Quiz
|
 Description: Description:
This second module in the two-part series expands on the science explaining catastrophic dam failure and flood-wave prediction methods associated with these events. Through the use of rich illustrations and interactions, this module introduces the St. Venant equations for dynamic wave flow, and flood wave characteristics. It also explains the general dam failure modeling process along with advantages and limitations of dam failure models including model stability, accuracy, and sensitivity issues. Finally, it also provides an overview of the Teton River dam failure, one of the most famous hydrologic events in U.S. history. The two modules that comprise this series are designed to be taken consecutively and together provide a fundamental understanding of this complex hydrologic topic.
Objectives:
After completing this module you should be able to:
* Describe basic features of the dam failure modeling process
* Recognize terms within the St. Venant equation
* Describe flood wave characteristics
* Describe model stability, accuracy, and sensitivity issues
* Assess advantages and limitations of three dam failure models
* Describe issues surrounding input and output of hydraulic models, including input data and data sources, and use of modeling scenarios
* Compare features of hydraulic versus empirical models
* Describe key issues involved in the Teton River dam failure
Estimated time to complete: 1 h
Includes audio: yes
Required plug-ins:  Flash Flash  RealPlayer RealPlayer  Java Java  Adobe® Reader® Adobe® Reader®
* Plug-in information
Last published on: 2008-08-25
close
|

|
Definition of the Mesoscale
description (click to show/hide) |
Quiz
|
 Description: Description:
By the end of this module you will be able to answer...
* What is the mesoscale and how do we classify it?
* What is hydrostatic equilibrium?
* Why are non-hydrostatic processes so important to mesoscale meteorology?
* Why does forecasting mesoscale meteorology rely on model resolution?
* How might mesoscale processes impact fleet operations?
Objectives:
Terminal Objectives
By the end of this module you should be able to do the following:
1. Identify and classify mesoscale weather phenomena
2. Identify the NWP model characteristics required to forecast different mesoscale weather phenomena.
Enabling Objectives
By the end of this module you will be able to do the following:
1. Recall the horizontal and time scales of mesoscale-alpha, mesoscale-beta, and mesoscale-gamma weather phenomena.
2. Given a list of weather phenomena, correctly classify them as either mesoscale-alpha, mesoscale -beta, or mesoscale -gamma
3. Describe hydrostatic balance.
4. Recall why non-hydrostatic processes are so important to mesoscale meteorology?
5. Recall the relationship between mesoscale and synoptic scale NWP models.
6. Describe the relationship between grid spacing and model resolution for NWP models.
7. Correctly estimate the NWP model resolution required to accurately simulate several mesoscale weather phenomena, including topographically forced weather, development of fog and low stratus, and development of convective storms.
Estimated time to complete: 30 min
Includes audio: yes
Required plug-ins:  Flash Flash  RealPlayer RealPlayer  Java Java  Adobe® Reader® Adobe® Reader®
* Plug-in information
Last published on: 2001-01-01
close
|

|
Deformation Zone Analysis
description (click to show/hide) |
Quiz
|
 Description: Description:
The quick analysis of deformation zones provides an overview of system-relative atmospheric circulations. Since deformation is a primary factor in frontogenesis and frontolysis, understanding of these system-relative circulations is crucial to the diagnosis of atmospheric processes and weather prediction. This module is part of the series: "Dynamic Feature Identification: The Satellite Palette".
Objectives:
* Analyze the air masses and circulations
* Analyze the related paired and companion vorticity centers
* Analyze the related axis of maximum wind and wind maxima
* Analyze the location, orientation and shape of the deformation zone
Estimated time to complete: 75-90 min
Includes audio: no
Required plug-ins:  Flash Flash  RealPlayer RealPlayer  Java Java  Adobe® Reader® Adobe® Reader®
* Plug-in information
Last published on: 2007-03-22
close
|

|
Deformation Zone Diagnosis
description (click to show/hide) |
Quiz
|
 Description: Description:
Following an analysis of the main features of a deformation zone, the diagnosis of temporal and spatial changes in these features can be used to deduce underlying meteorological processes and their progression. In turn, this knowledge can then be used in the forecast process to adjust the forecast accordingly. This module takes 35-45 minutes to complete. It is part of the series: "Dynamic Feature Identification: The Satellite Palette".
Objectives:
* Diagnose the relative intensities of each vorticity center associated with a deformation zone
* Predict the evolution of each associated vorticity center
* Predict the evolution of the deformation zone's location, orientation and shape
* Based on the predicted evolution of a deformation zone, identify areas of frontolysis and frontogenesis and trends in the weather
Estimated time to complete: 35-45 min
Includes audio: no
Required plug-ins:  Flash Flash  RealPlayer RealPlayer  Java Java  Adobe® Reader® Adobe® Reader®
* Plug-in information
Last published on: 2007-11-05
close
|

|
Deformation Zone Distribution
description (click to show/hide) |
Quiz
|
 Description: Description:
The distribution of vorticity centres along an axis of maximum winds follows a fairly predictable pattern based on the characteristics of the flow. By diagnosing these characteristics, the meteorologist is able to quickly deduce the location and relative intensities of the associated vorticity centres as well as the relative sizes of the associated circulations. This information is summarized within the shape and orientation of the associated deformation zones. The deformation zones in turn reveal important details regarding feature motion and thermal advection and thus their diagnosis should be a critical part of the forecast process. This module takes 30-40 minutes to complete. It is part of the series: "Dynamic Feature Identification: The Satellite Palette".
Objectives:
* Compare the different characteristics of various flow patterns
* Locate the position and predict the relative intensities of vorticity centres along a flow
* Predict the position of the associated deformation zones based on the location and intensities of the vorticity centres
Estimated time to complete: 30-40 min
Includes audio: yes
Required plug-ins:  Flash Flash  RealPlayer RealPlayer  Java Java  Adobe® Reader® Adobe® Reader®
* Plug-in information
Last published on: 2008-03-21
close
|

|
Determining Visibility
description (click to show/hide) |
No Quiz
|
 Description: Description:
This 10-minute Webcast was developed from a presentation at the Naval Research Laboratory in April 2003 by LTJG Matt Henigin. LTJG Henigin reviews techniques for making visibility forecasts by combining surface observations with remote sensing data to estimate visibility in areas where no surface observations are available. Examples in the Webcast are drawn from southwest Asia.
Objectives:
• Describe the process for extrapolating visibility conditions in areas with no in-situ observations
• State the advantages of enhancing imagery for visibility forecasting
• State the reason for looping data for feature identification
Estimated time to complete: 10 min
Includes audio: yes
Required plug-ins:  Flash Flash  RealPlayer RealPlayer  Java Java  Adobe® Reader® Adobe® Reader®
* Plug-in information
Last published on: 2003-07-23
close
|

|
Diagnosing and Forecasting Extratropical Transition: A Case Exercise on Hurricane Michael
description (click to show/hide) |
Quiz
|
 Description: Description:
This exercise tracks Hurricane Michael as it moved into the Maritime region of the Canadian east coast in October, 2000. Analyze data and respond to questions focusing on forecasting the progression of the storm. This case exercise accompanies the Webcast, Hurricanes Canadian Style: Extratropical Transition.
Objectives:
• Distinguish between meteorological parameters favorable to tropical cyclone strengthening and weakening
• Identify meteorological parameters favorable for extratropical transition
• Apply the guidelines used for forecasting the motion of a tropical cyclone undergoing extratropical transition
Estimated time to complete: 30-45 min
Includes audio: yes
Required plug-ins:  Flash Flash  RealPlayer RealPlayer  Java Java  Adobe® Reader® Adobe® Reader®
* Plug-in information
Last published on: 2002-06-06
close
|

|
Dispersion Basics
description (click to show/hide) |
Quiz
|
 Description: Description:
A webcast presentation by Dr. Timothy Spangler (Director of the COMET Program and a former air quality consultant). This 25-minute lecture provides an overview of the basics of dispersion, the effects of different atmospheric conditions on dispersion, and how dispersion is commonly modeled after an accidental release of a hazardous material.
Objectives:
- Define what is meant by the terms “dispersion” and “exposure”
- List the main factors that determine dispersion and exposure
- Differentiate between the 5 main plume types
- Explain the factors involved in plume rise and why plume rise is important
- Discuss the main components involved in calculating concentration
- Describe the differences between a Gaussian model, a Gradient Transport Model, and a Puff Model
- List important situations in which common dispersion models may not provide good concentration estimates
Estimated time to complete: 25 min
Includes audio: yes
Required plug-ins:  Flash Flash  RealPlayer RealPlayer  Java Java  Adobe® Reader® Adobe® Reader®
* Plug-in information
Last published on: 2002-11-12
close
|

|
Dust Enhancement Techniques Using MODIS and SeaWiFS
description (click to show/hide) |
Quiz
|
 Description: Description:
The Dust Enhancement Techniques Using MODIS and SeaWiFS Webcast features Dr. Steven Miller of the Naval Research Laboratory (NRL) in Monterey, California and takes about one hour to complete. Dr. Miller explains two techniques for detecting blowing dust using multispectral satellite imagery from the MODIS and SeaWiFS instruments. He also provides guidelines for the best uses of these techniques. The Webcast includes several recent operational examples from southwest Asia. This presentation was originally given at a workshop hosted by NRL in April, 2003.
Objectives:
After completing the module the user will be able to:
• Describe the process for creating RGB or “true-color” enhancements
• State the limitations of the RGB enhancement for detecting dust
• Describe the process for creating “false-color” dust specific enhancements
• Identify dust plumes using the dust enhancement
• Identify surface features that mimic dust signatures using the dust enhancement
• Identify source regions for dust using dust enhancement imagery
• Distinguish smoke and clouds from dust using the dust enhancement
• State the limitations of the false-color dust enhancement
Estimated time to complete: 45 min
Includes audio: yes
Required plug-ins:  Flash Flash  RealPlayer RealPlayer  Java Java  Adobe® Reader® Adobe® Reader®
* Plug-in information
Last published on: 2003-07-16
close
|

|
Dynamic Feature Identification: The Satellite Palette
description (click to show/hide) |
No Quiz
|
 Description: Description:
This series addresses the use of satellite imagery and focuses attention on the identification of dynamic features using high-resolution satellite imagery with NWP verification. The series will eventually include more than 20 feature presentations on topics such as comma clouds, jet streaks, deformation zones, surface features, convection, and blocking.
Each feature presentation includes interactive identification exercises, analysis and diagnosis, conceptual models, and forecast implications.
Objectives:
• Analyze and diagnose dynamic features in satellite imagery
• Identify discrepancies between numerical model forecasts and atmospheric features
• Apply conceptual models to an atmospheric feature and correct for discrepancies between observed and numerical model analysis
Estimated time to complete: 20-90 min
Includes audio: no
Required plug-ins:  Flash Flash  RealPlayer RealPlayer  Java Java  Adobe® Reader® Adobe® Reader®
* Plug-in information
Last published on: 2006-01-10
close
|

|
Dynamically Forced Fog
description (click to show/hide) |
Quiz
|
 Description: Description:
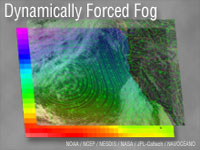
Fog frequently forms in response to dynamically forced changes in the boundary layer. This module examines dynamically forced fog in the coastal and marine environment, focusing on advection fog, steam fog, and west coast type fog. The focus of the module is on the boundary layer evolution of air parcels as they traverse trajectories over land and water. The module also examines mesoscale effects that impact the distribution of fog and low-level stratus over short distances. A general discussion of forecast products and methodologies concludes the module.
Objectives:
After completing this module, the learner should be able to do the following things:
With regard to the general features of dynamically forced fog and stratus:
• Describe the differences in boundary layer characteristics and evolution for advection, West Coast, and steam fog in a marine environment
• Describe the differences in synoptic environments for advection, West Coast, and steam fog in a marine environment
• Describe the relationship of sea surface temperature to fog formation for advection, West Coast, and steam fog in a marine environment
With regard to advection fog:
• Describe the general synoptic environment that is conducive to fog formation
• List at least 2 ways that subtropical high-pressure systems contribute to the formation of advection fog
• Describe the evolution of the boundary layer along an air parcel trajectory that leads to advection fog
• Describe how sea surface temperature changes along an air parcel trajectory that leads to advection fog
• Recall the origins of strong sea surface temperature gradients
• On a world map, identify areas prone to advection fog
• Recall the seasonality of advection fog
With regard to West Coast fog and low stratus:
• Describe the general synoptic environment that is conducive to fog formation
• List at least 2 ways that subtropical high-pressure systems contribute to the formation of West Coast fog and low stratus
• Describe the evolution of the boundary layer along an air parcel trajectory that leads to West Coast fog and low stratus
• List at least 2 ways that the boundary layer cools to saturation in a West Coast fog/stratus event.
• Recall the role of upwelling in the formation of West Coast fog and low stratus
• On a world map, identify areas prone to West Coast fog and low stratus
• Recall the seasonality of West Coast fog and low stratus
With regard to steam fog:
• Describe the general synoptic environment that is conducive to fog formation
• Describe the characteristics and evolution of the boundary layer along an air parcel trajectory that leads to steam fog
• On a world map, identify areas prone to steam fog
• Recall the seasonality of steam fog events
With regard to mesoscale influences upon dynamically forced fog:
• Describe the effects of coastal topography in fog formation
• Describe how coastal jets affect fog formation and dissipation
• Describe how sea breezes affect fog formation and dissipation
• Describe the impact of local variations in sea surface temperature on fog formation and dissipation
With regard to forecasting dynamically forced fog:
• Describe the general approach to forecasting fog
• List at least 4 critical atmospheric fields to monitor in plan view when forecasting fog
• List at least 4 critical atmospheric fields to monitor in vertical profiles when forecasting fog
• Describe the limitations of NWP models in fog forecasting
Estimated time to complete: 3 h
Includes audio: yes
Required plug-ins:  Flash Flash  RealPlayer RealPlayer  Java Java  Adobe® Reader® Adobe® Reader®
* Plug-in information
Last published on: 2005-03-01
close
|

|
Dynamics & Microphysics of Cool-Season Orographic Storms
description (click to show/hide) |
Quiz
|
 Description: Description:
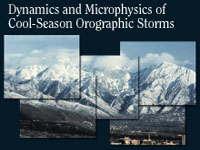
In this Webcast, Dr. James Steenburgh, working for the Department of Meteorology and the NOAA Cooperative Institute for Regional Prediction at the University of Utah, takes a look at cool-season orographic storms in western North America. He provides a brief microphysics review, an overview of cool-season orographic precipitation processes in several mountain ranges, and a look at forecasting tools and techniques. This Webcast is based on a classroom presentation given in Boulder, CO in December 2002.
Objectives:
• Improve knowledge of orographic precipitation processes and their geographical, climatological, and storm-to-storm variability.
• Build or enhance your orographic precipitation forecasting tool chest.
• Illustrate the strengths and weaknesses of quantitative precipitation forecasts by high-resolutions models in complex terrain.
Estimated time to complete: 1 h
Includes audio: yes
Required plug-ins:  Flash Flash  RealPlayer RealPlayer  Java Java  Adobe® Reader® Adobe® Reader®
* Plug-in information
Last published on: 2004-08-09
close
|

|
Ensemble Forecasting Explained
description (click to show/hide) |
Quiz
|
 Description: Description:
This module, the latest in our series on Numerical Weather Prediction, covers the theory and use of ensemble prediction systems (EPSs). The module will help forecasters develop an understanding of the basis for EPSs, the skills to interpret ensemble products, and strategies for their use in the forecast process. It contains six sections: an Introduction that briefly presents background theory; Generation, which describes how ensemble systems are constructed; Statistical Concepts, which provides a brief refresher on knowledge required for ensemble product interpretation; Summarizing Data, which describes common ensemble forecast products; Verification, which discusses how EPSs performance is assessed and documented; and Case Applications, which provides links to a number of forecast cases illustrating the use of EPSs in the forecast process. Questions and Exercises are offered throughout to help you test your learning and provide practical examples. The module also includes a pre-assessment and module final quiz.
Objectives:
Explain the basis for NWP ensemble prediction, and what we mean when we say that the atmosphere is chaotic (i.e. sensitive to initial conditions).
Describe the variety of methods used to generate the ensemble members of an ensemble prediction system, including perturbation of initial conditions, boundary conditions, and model configurations.
Understand the basic statistical concepts and methods used in the development of ensemble products, including probability distributions and their middleness, variability, and shape characteristics.
Recognize and interpret the variety of ensemble forecast products, including spatial and point forecast graphics, and including those that account for flow regimes (RMOP) and reveal NWP model bias and errors.
Interpret ensemble verification products, and apply them in using ensemble forecasts.
Estimated time to complete: 4-5 h
Includes audio: no
Required plug-ins:  Flash Flash  RealPlayer RealPlayer  Java Java  Adobe® Reader® Adobe® Reader®
* Plug-in information
Last published on: 2004-09-27
close
|

|
Ensemble Prediction System Matrix: Characteristics of Operational Ensemble Prediction Systems (EPS)
description (click to show/hide) |
No Quiz
|
 Description: Description:
This one-stop Ensemble Model Matrix provides information on the configurations of the NCEP Short-Range Ensemble Forecast (SREF) and Medium-Range Ensemble Forecast (MREF) systems. Information on ensemble perturbation methods; NWP model resolution, dynamics, physics (precipitation, radiation, land surface and turbulence); and ensemble post-processing and verification links are provided. As the ensemble prediction systems (EPSs) are improved, the information in the Ensemble Model Matrix will be updated. Additionally, as new EPSs are added to AWIPS, we will add new columns to the Ensemble Model Matrix.
Estimated time to complete:
Includes audio: no
Required plug-ins:  Flash Flash  RealPlayer RealPlayer  Java Java  Adobe® Reader® Adobe® Reader®
* Plug-in information
Last published on: 2006-04-05
close
|

|
ENSO and Beyond
description (click to show/hide) |
Quiz
|
 Description: Description:
This Webcast, presented by Dr. Marty Hoerling of NOAA/CIRES/Climate Diagnostic Center, discusses the impacts of El Niño and La Niña variability on both North American and tropical weather. The presentation shows that these two phenomena are not simple inverses of each other and that anticipating their varying intensities is key to making successful climate forecasts. Two other ocean impacts that affect North American climate almost as strongly as ENSO are also introduced.
Estimated time to complete: 40 min
Includes audio: yes
Required plug-ins:  Flash Flash  RealPlayer RealPlayer  Java Java  Adobe® Reader® Adobe® Reader®
* Plug-in information
Last published on: 2003-05-02
close
|

|
Feature Identification Exercises: Clouds, Snow, and Ice Using MODIS
description (click to show/hide) |
Quiz
|
 Description: Description:
This module consists of four exercises where users identify surface features, distinguish clouds from snow on the ground, and determine cloud phase using multispectral analysis. The module also includes an overview of multispectral techniques available on many operational and research polar-orbiting satellites. A page with links to real-time polar-orbiting data and information is also included.
Objectives:
• State the properties of the 1.6 micrometer channel used in feature identification
• State the properties channels in the 3.5 to 4 micrometer region in feature identification
• List the advantages and limitations of the 1.6 micrometer channel in cloud identification
• List the advantages and limitations of the 1.6 micrometer channel in identifying snow on the ground
• List the advantages and limitations of channels in the 3.5 to 4 micrometer region for cloud identification
• List the advantages and limitations of channels in the 3.5 to 4 micrometer region in identifying snow on the ground
• Apply the properties of the visible, IR Window, 1.6 micrometer, and 3.7 micrometer channels to:
o Distinguish clouds from snow on the ground
o Determine the phase (ice or water) of clouds
o Detect the presence of fog
o Distinguish open water from ice-covered areas of lakes and rivers
Estimated time to complete: 1-2 h
Includes audio: yes
Required plug-ins:  Flash Flash  RealPlayer RealPlayer  Java Java  Adobe® Reader® Adobe® Reader®
* Plug-in information
Last published on: 2002-07-03
close
|

|
Feature Identification Using Environmental Satellites
description (click to show/hide) |
Quiz
|
 Description: Description:
This Webcast, presented by Tom Lee of the Naval Research Laboratory, focuses on feature identification using a combination of high-resolution multispectral polar and geostationary satellite imagery products.
The Webcast is made up of five short sections focus on a set of particularly challenging feature identification problems including: clouds over snow; contrails/thin cirrus; fires, hot spots, and smoke; blowing dust; snow, icebergs, and pack ice. Examples are included from Asia, Europe, and North America. A table summarizes suggested detection strategies for each phenomena type, based on available polar and geostationary capabilities and whether the event occurs during daytime or nighttime.
Objectives:
Using multispectral imagery identify the following features:
• Contrails/thin cirrus
• Fires, smoke, and hot spots,
• Blowing dust
• Snow, icebergs, and pack ice
Use multispectral imagery to:
• Distinguish clouds from show on the ground
• Distinguish smoke from clouds
• Distinguish blowing dust from clouds
Estimated time to complete: 1 h
Includes audio: yes
Required plug-ins:  Flash Flash  RealPlayer RealPlayer  Java Java  Adobe® Reader® Adobe® Reader®
* Plug-in information
Last published on: 2002-10-24
close
|

|
Fire Behavior
description (click to show/hide) |
Quiz
|
 Description: Description:
This module provides a comprehensive overview of the three main dimensions of the fire environment triangle: fuels, topography, and weather. Five interactive case studies illustrate the interdependent influences these three dimensions have on fire behavior. A wide range of fire behavior is also discussed in terms of the environmental factors that support or suppress fire ignition and spread. As part of the Advanced Fire Weather Forecasters Course, this module is meant to introduce forecasters to science of fire behavior.
Objectives:
1. Identify key factors contributing to the fuels dimension of the fire environment triangle, including fuel properties, components, complexes, states, moisture levels, and continuity.
2. Identify key factors contributing to the topography dimension of the fire environment triangle, including slope, aspect, elevation, and soil moisture.
3. Identify key factors contributing to the weather dimension of the fire environment triangle, including temperature, humidity, winds, and instability.
4. Given a case situation including descriptions of fuels, topography, and weather, identify the fire behavior most likely to occur.
Estimated time to complete: 1.5 h
Includes audio: yes
Required plug-ins:  Flash Flash  RealPlayer RealPlayer  Java Java  Adobe® Reader® Adobe® Reader®
* Plug-in information
Last published on: 2008-03-19
close
|

|
Fire Model Matrix
description (click to show/hide) |
No Quiz
|
 Description: Description:
The Fire Model Matrix is an on-line resource that presents four fire community models in a matrix that facilitates the exploration of the characteristics of each model. As part of the Advanced Fire Weather Forecasters Course, this matrix is meant to sensitize forecasters to the use of weather data in these fire models to forecast potential fire activity.
Estimated time to complete: 45 min
Includes audio: no
Required plug-ins:  Flash Flash  RealPlayer RealPlayer  Java Java  Adobe® Reader® Adobe® Reader®
* Plug-in information
Last published on: 2008-02-05
close
|

|
Fire Weather Climatology
description (click to show/hide) |
Quiz
|
 Description: Description:
The “Fire Weather Climatology” module provides a comprehensive look at fire regions across the United States and characteristics of typical fire seasons in each region. In addition, critical fire weather patterns are described in terms of their development, duration and impact on fire weather. Numerous case studies provide examples and opportunities to practice recognizing these critical patterns and how they can affect fire ignition and spread. This module is part of the Advanced Fire Weather Forecasters Course.
Objectives:
At the end of this module you should be able to:
1. Identify critical fire weather patterns across North America and describe:
* Basic set-up, effects on fire weather elements, and typical duration of each pattern
* Characteristics of each pattern that contribute to fire ignition, spread and intensification.
2. Describe locations of key large-scale air-mass source regions and the air mass characteristics that impact fire weather.
3. Identify typical fire seasons for fire climatological regions of the United States and Canada and the critical fire weather patterns that affect these regions.
Estimated time to complete: 3-4 h
Includes audio: no
Required plug-ins:  Flash Flash  RealPlayer RealPlayer  Java Java  Adobe® Reader® Adobe® Reader®
* Plug-in information
Last published on: 2008-04-28
close
|

|
Fire Weather Forecasting: Clear Communications
description (click to show/hide) |
Quiz
|
 Description: Description:
The “Fire Weather Forecasting: Clear Communications” distance learning module offers best practices for Fire Weather Forecasters needing to communicate weather information when deployed in the field. The 30-minute module defines strategies for communicating with Weather Forecast Offices and with customers. Examples include writing a useful fire weather forecast discussion and undertaking proper planning to quickly and accurately disseminate information. This distance learning module is part of the Advanced Fire Weather Forecasters Course.
Objectives:
At the end of this module you should be able to:
1. Identify audiences of fire weather forecasts, forecast discussions, and spot forecasts
2. Demonstrate an understanding of the importance of IMET/WFO coordination
3. Describe best practices for writing an effective and useful fire weather forecast discussion
Estimated time to complete: 30 min
Includes audio: no
Required plug-ins:  Flash Flash  RealPlayer RealPlayer  Java Java  Adobe® Reader® Adobe® Reader®
* Plug-in information
Last published on: 2008-03-05
close
|

|
Fire Weather Grid Techniques: Relative Humidity and Dewpoint Temperature
description (click to show/hide) |
Quiz
|
 Description: Description:
Fire Weather Grid Techniques: Relative Humidity and Dewpoint describes techniques and best practices for creating scientifically consistent grids of fire weather parameters. A case study is used to apply Smart Tools to model guidance to edit relative humidity and dew point temperature grids, and to demonstrate the advantages of editing dew point temperature rather than relative humidity to best represent the moisture in the atmosphere.
Objectives:
1. State how calculating 24-hour “change grids” can help forecasters generate more realistic forecast grids.
2. Explain the need to carefully check trends and values when forecasting changes to parameters used for calculating other grids.
3. Explain how examining recent observational data – either via observational grids or point observations – is essential to making realistic forecast grids.
Estimated time to complete: 30 min
Includes audio: yes
Required plug-ins:  Flash Flash  RealPlayer RealPlayer  Java Java  Adobe® Reader® Adobe® Reader®
* Plug-in information
Last published on: 2007-09-19
close
|

|
Flash Flood Case Studies
description (click to show/hide) |
Quiz
|
 Description: Description:
This module takes the learner through seven case studies of flash flood events that occurred in the conterminous U.S. between 2003 and 2006. The cases covered include:
* 30-31 August 2003: Chase & Lyon Counties, KS
* 16-17 September 2004: Macon County, NC
* 31 July 2006: Santa Catalina Mountains near Tucson, AZ
* 25 December 2003: Fire burn area near San Bernardino, CA
* 30 August 2004: Urban flash flood in Richmond, VA
* 19-20 August 2003: Urban flash flood in Las Vegas, NV
* 9 October 2005: Cheshire County, NH
This module assists the learner in applying the concepts covered in the foundation topics of the Basic Hydrologic Sciences course. Some of the specific topics pertinent to these cases are the physical characteristics that make a basin prone to flash floods, basin response to precipitation, flash flood guidance (FFG), the relationship between wildfire and flash floods, and the relationship between urban development and flash floods. Related topics brought out in the cases include radar quantitative precipitation estimation (QPE), the National Weather Service Flash Flood Monitoring and Prediction (NWS FFMP) products, debris flows, impounded water, and interagency communications. The core foundation topics are recommended prerequisite materials since this module assumes some pre-existing knowledge of hydrologic principles. In particular, the Runoff Processes and Flash Flood Processes modules contain material directly related to these cases.
Objectives:
1. Understand the hydrologic response to intense rainfall that leads to rapid runoff and flash floods.
2. Recognize the utility and limitations in NWS flash flood forecasting tools (FFMP, FFG, Radar QPE).
3. Understand that flash flood prone basins can be very small.
4. Identify the LEC (Low Echo Centroid) storm signature and realize its implications on rainfall production.
5. Understand the utility and limitations of different Z-R relationships.
6. Recognize the information provided by FFMP's (Flash Flood Monitoring and Prediction) upstream/downstream tool.
7. Recall how and why FFMP basin rainfall can mask radar problems such as terrain blocking.
8. Think about how one may use other data in areas with terrain blocking of the radar beam.
9. Understand the impact that fire may have on basin hydrology.
10. Recall how debris flows can occur with flash floods.
11. Understand how changing the FFG values may be appropriate in some situations.
12. Recognize the important information provided by FFMP's difference and ratio fields.
13. Be aware of important collaborative efforts between the NWS and other agencies, such as the USGS.
14. Understand the dramatic impact that urban and suburban development can have on basin response.
15. Understand how and why FFG may need to be altered in urbanized areas.
16. Anticipate the very short time lag between peak rainfall and peak flooding in urbanized areas.
17. Recognize that flash flooding may occur downstream of basins that receive the greatest rainfall.
18. Recognize the potential of flash flooding from the sudden release of water impounded by human engineered structures.
19. Recognize the importance of interagency communication prior to and during flash flood events, especially those that involve structural failures.
Estimated time to complete: 1 h
Includes audio: yes
Required plug-ins:  Flash Flash  RealPlayer RealPlayer  Java Java  Adobe® Reader® Adobe® Reader®
* Plug-in information
Last published on: 2007-06-26
close
|

|
Flash Flood Processes
description (click to show/hide) |
Quiz
|
 Description: Description:
According to NOAA’s National Weather Service, a flash flood is a life-threatening flood that begins within 6 hours--and often within 3 hours--of a causative event. That causative event can be intense rainfall, the failure of a dam, levee, or other structure that is impounding water, or the sudden rise of water level associated with river ice jams.
The “Flash Flood Processes” module offers an introduction to the distinguishing features of flash floods, the underlying hydrologic influences and the use of flash flood guidance (FFG) products. Through use of rich illustrations, animations, and interactions, this module explains the differences between flash floods and general floods and examines the hydrologic processes that impact flash flooding risk. In addition, it provides an introduction to the use of flash flood guidance (FFG) products including derivation from ThreshR and rainfall-runoff curves as well as current strengths and limitations.
Objectives:
Define a flash flood:
• Distinguish a flash flood from a general flood
• Identify the different physical processes leading to flash floods
• Recognize the connection between precipitation intensity and runoff characteristics associated with flash floods
Explain hydrologic influences on flash floods:
• Apply information about the runoff processes to the flash flood problem
• Explain why certain soil textures and soil profiles may result in greater flash flood risks
• Which physical characteristics make a basin more prone to flash flooding
• How quickly and frequently flash floods can occur in urban environments
• How fires and deforestation impact the flash flood risk
Understand key issues underlying the use of flash flood guidance (FFG) products:
• The definition of flash flood guidance
• How threshold runoff (ThreshR) and rainfall-runoff curves are used to derive flash flood guidance
• How flash flood guidance is generated for different spatial entities (headwater, county, gridded) and time durations
• Recognize when and how limitations can impact forecasts
Estimated time to complete: 1 h
Includes audio: yes
Required plug-ins:  Flash Flash  RealPlayer RealPlayer  Java Java  Adobe® Reader® Adobe® Reader®
* Plug-in information
Last published on: 2006-11-08
close
|

|
Flood Frequency Analysis
description (click to show/hide) |
Quiz
|
 Description: Description:
The Flood Frequency Analysis module offers an introduction to the use of flood frequency analysis for flood prediction and planning. Through use of rich illustrations, animations, and interactions, this module explains the basic concepts, underlying issues, and methods for analyzing flood data. Common concepts such as the 100-year flood and return periods as well as issues affecting the statistical representation of floods are discussed. Common flood data analysis methods as well as an overview of design events are also covered. As a foundation topic for the Basic Hydrologic Science course, this module may be taken on its own, but it will also be available as a supporting topic providing factual scientific information to support students in completion of the case-based forecasting modules.
Objectives:
- Explain key concepts in flood frequency analysis
- Define the meaning of return periods (i.e., the 100-year flood)
- Explain the exceedance probability and its relationship to return period
- Understand the two primary applications of flood frequency analyses
- Understand key issues impacting the statistical representation of floods
- Explain how the period of record impacts flood frequency guidance
- Calculate the probability of occurrence or non-occurrence for a given flood magnitude over a specified duration
- Understand how basin changes may impact the behavior and frequency of floods, thus reducing the length of the period of record
- Apply common methods for analyzing flood data
- Explain the basic concepts underlying both annual and partial duration time series
- Conduct a frequency analysis given peak flow data for a river
- Explain purpose and application of design events
- Identify the reason for using design events
- Understand the usefulness of design events and their limitations and constraints
- Explain the concept of probable maximum event
- Understand the concept of standard project floods
Estimated time to complete: 1-2 h
Includes audio: yes
Required plug-ins:  Flash Flash  RealPlayer RealPlayer  Java Java  Adobe® Reader® Adobe® Reader®
* Plug-in information
Last published on: 2006-10-10
close
|

|
Flow Interaction with Topography
description (click to show/hide) |
Quiz
|
 Description: Description:
This is a foundation module in the Mesoscale Meteorology Primer series. Topics covered include an overview of factors that control whether air will go up and over a mountain or be forced around it, the role of potential and kinetic energy, the Froude number and what it tells you, and air flow blocked by topography.
Objectives:
Terminal Objectives
By the end of this module you will be able to do the following:
1. Describe how flow interacts with topography.
2. List the factors that determine the interaction.
Enabling Objectives
By the end of this module you will be able to do the following:
1. List the factors that determine the interaction of flow with topography.
2. Describe the Froude number in terms of wind speed, wind direction, static stability, and mountain height.
3. Describe flow interactions with a long, straight mountain ridge for high-Froude-number and low-Froude-number flows.
4. Recall how flow responds to a single, tall mountain.
5. List the factors that determine the upstream distance that flow will be affected by topography.
Estimated time to complete: 30 min
Includes audio: yes
Required plug-ins:  Flash Flash  RealPlayer RealPlayer  Java Java  Adobe® Reader® Adobe® Reader®
* Plug-in information
Last published on: 2001-01-01
close
|

|
Fog and Stratus Forecast Approaches
description (click to show/hide) |
Quiz
|
 Description: Description:
This module deals with identifying the characteristics of radiation versus advection fog events, determining which process is dominating, and applying that understanding when making ceiling and visibility forecasts. A forecast approach using a decision tree is also discussed. This decision tree outlines the basic steps involved in applying a thorough forecast approach to fog and stratus events. The module is based on live teletraining sessions offered in 2003 as part of the Distance Learning Aviation Course 1 (DLAC1) on Fog and Stratus Forecasting.
Objectives:
1. Describe the differing processes that lead to radiation fog and advection fog
2. State the two key ingredients for the formation of fog or low stratus: increasing moisture in the boundary layer or decreasing boundary layer temperatures.
3. Properly identify which processes are dominating a particular fog or low stratus event. You can do this by:
• Examining the characteristics of the processes involved,
• Examining the low-level factors that are influencing the event, and
• Comparing these to the known characteristics, processes, and factors that distinguish a radiation event from an advective event.
Estimated time to complete: 2 h
Includes audio: Yes
Required plug-ins:  Flash Flash  RealPlayer RealPlayer  Java Java  Adobe® Reader® Adobe® Reader®
* Plug-in information
Last published on: 2004-07-15
close
|

|
Forecast Process
description (click to show/hide) |
No Quiz
|
This module is not available on the Web. To order a CD, please see our contact information.
 Description: Description:
Weather agencies and forecast organizations everywhere are trying to keep pace with the ongoing modernization of both sensing and data acquisition systems. More than ever, forecasters require a coherent framework within which to master this rapidly increasing supply of new data formats in order to properly observe, organize, analyze, diagnose, and forecast meteorological conditions and events. Forecast Process is designed to meet that need.
The instructional goal of Forecast Process is to assist the learner in developing and applying a systematic approach to operational forecasting. Following the Forecast Funnel theory, this module represents the scales of interaction (hemispheric, synoptic, mesoscale, and local) that influence the onset of and changes in weather events for a particular forecast area. Clear representative examples of these scale interactions establish a context for demonstrating essential forecasting skills.
Because it serves as a general reference for the other COMET modules, we recommend taking Forecast Process as a prerequisite for all modules. We also recommend as background for this module, familiarity with numerical weather prediction products, short/long wave and blocking patterns, surface and constant pressure charts, cyclonic/anticyclonic flows, and satellite imagery, as well as general experience in identifying and conceptualizing basic weather patterns.
The subject matter experts for Forecast Process are Mr. Len Snellman and Mr. Eric Thaler.
Estimated time to complete: 3-5 h
Includes audio: yes
Required plug-ins:  Flash Flash  RealPlayer RealPlayer  Java Java  Adobe® Reader® Adobe® Reader®
* Plug-in information
Last published on: 1996-01-01
close
|

|
Forecasting Aviation Icing: Icing Type and Severity
description (click to show/hide) |
Quiz
|
 Description: Description:
This module discusses the current theories of atmospheric conditions associated with aircraft icing and applies the theories to the icing diagnosis and forecast process. The contribution of liquid water content, temperature, and droplet size parameters to icing are examined. Identification of icing type, icing severity, and the hazards associated with icing features are presented. Tools to help diagnose atmospheric processes that may be contributing to icing and the special case of supercooled large drop (SLD) icing are examined and applied in short exercises.
The use of graphics, animations, and interactive exercises in Forecasting Aviation Icing: Icing Type and Severity helps the forecaster to gain an understanding of icing processes, to identify icing hazards, and to apply diagnosis and forecast tools as aids to evaluate and anticipate potential aircraft icing threats.
The subject matter expert for this module is Dr. Marcia Politovich of
NCAR/Research Applications Program.
This module is also available in French.
Objectives:
The goal of this training module is to help you improve your icing forecasts by
1. Becoming more familiar with the types, conditions, and hazards of aircraft icing.
2. Learning what factors determine icing type and severity, and how they interrelate.
3. Knowing what physical processes create favorable icing conditions.
4. Recognizing the types of mesoscale environments that generate such physical processes.
5. Learning some techniques to apply and patterns to look for when diagnosing data products for possible icing threats.
Performance Objectives
A. Aircraft Icing
1. Name and distinguish between the main types of in-flight aircraft icing; rank them in terms of potential hazard to aviation.
2. Describe the conditions under which the main types of in-flight aircraft icing form.
3. Name and distinguish between the four icing severity reporting categories used by pilots.
B. Icing Factors
1. Name the main factors that determine the type and severity of icing to expect in a given environment.
2. Identify ranges of values for liquid water content, temperature, and altitude that are most favorable to icing.
3. Describe the influence of droplet size on ice collection efficiency and accretion pattern.
4. Predict the most likely icing type and severity level to expect for given ranges of cloud liquid water content, temperature, and droplet size.
C. Icing Environments and Physical Processes
1. Describe the impact to icing of each of the six categories of water phase transitions.
2. Describe several of the most favorable synoptic and mesoscale environments for development of hazardous icing conditions:
• Three patterns that enhance cloud formation and hence icing potential
• Three environments that are especially conducive to supercooled large drop formation
• Two physical processes that support supercooled large drop formation
• Cloud-top conditions most favorable to supercooled large drop formation
D. Data Assessment
1. Assess the icing threat in various layers of skew T-log p diagrams.
2. Identify favorable areas and layers for supercooled large drop formation integrating:
• GOES 3.9 micron imagery
• Skew-T diagrams
• Profiler data
• WSR-88D reflectivity and velocity
• Surface precipitation observations
Estimated time to complete: 3-5 h
Includes audio: no
Required plug-ins:  Flash Flash  RealPlayer RealPlayer  Java Java  Adobe® Reader® Adobe® Reader®
* Plug-in information
Last published on: 1998-03-13
close
|

|
Forecasting Dust Storms
description (click to show/hide) |
Quiz
|
 Description: Description:
Forecasting Dust Storms is the latest module in the Mesoscale Meteorology Primer. The module starts by discussing the conditions required for a dust storm, including an appropriate source of dust, sufficient wind and turbulence, and an unstable atmosphere. The module then explores the fate of dust in the atmosphere including dispersion, advection, and settling. The concluding section on forecasting examines a case in the Middle East and demonstrates the use of a mesoscale NWP model, as well as next-generation dust forecasting models.
Objectives:
After completing this module, the learner should be able to do the following things:
With regard to dust storm characteristics:
• Describe how visibility varies near severe dust storms
• Recall the average height of dust storms
With regard to sources of dust:
• Describe the soil types in appropriate source regions for dust storms
• Recall that blowing dust usually does not occur for at least 24 hours after a rainfall
• Identify potential source regions with satellite imagery
With regard to atmospheric conditions required for dust storms:
• Recall the threshold wind speed for lifting fine dust particles.
• Describe the atmospheric conditions that promote lofting of dust in terms of stability and turbulence
• List the 3 ways that turbulence typically arises in the atmosphere
• Describe the effect of nightfall on dust storms
With regard to the dissipation and dispersion of dust storms:
• Describe the atmospheric factors that influence the dispersion of dust
• Describe the effect of precipitation on suspended dust and why this occurs
• Recall how quickly dust settles once winds die down
With regard to the climatology of dust storms:
• List the most common synoptic patterns for raising dust in the Middle East
• Define Shamal
• List at least 3 mesoscale weather phenomena that result in dust storms
• Describe how haboobs and dust devils originate
• Describe how winter dust storms differ from summer dust storms
With regard to the satellite detection of blowing dust:
• Describe how dust appears on IR images, during both day and night and over both land and water
• Describe how dust appears on visible images, during both day and night and over both land and water
• Describe the advantages of imagery from polar orbiting and geostationary satellites
• With regard to forecasting dust storms:
• List the tools available for observing dust storms.
• Describe how mesoscale NWP models can help with a dust storm prediciton
• List the dust storm forecasting models and describe their respective advantages
Estimated time to complete: 2 h
Includes audio: yes
Required plug-ins:  Flash Flash  RealPlayer RealPlayer  Java Java  Adobe® Reader® Adobe® Reader®
* Plug-in information
Last published on: 2003-10-23
close
|

|
Forecasting Radiation Fog
description (click to show/hide) |
Quiz
|
 Description: Description:
This is the second module in the Mesoscale Meteorology Primer series. This module starts with a forecast scenario that occurs during a winter radiation fog event in the Central Valley of California. After that, a conceptual section covers the physical processes of radiation fog through its life cycle. Operational sections addressing fog detection and forecasting conclude the module
Objectives:
At the end of the module you should be able to do the following things:
With Regard to the Preconditioning Environment:
• Identify key conditions and ingredients necessary for development of radiation fog
• Discriminate between large-scale low-level environments that are favorable and unfavorable for development of radiation fog
• Describe the sequence of key surface and boundary layer processes that prepare the low-level environment for development of radiation fog
• Demonstrate an understanding of how surface cooling dries the micro-boundary layer and prevents low-level condensation from being deposited onto the surface
• Rank various surface and surface cover types in terms of the relative speed with which low-level air in contact with them will reach saturation
With Regard to Initiation and Growth:
• Identify levels at which radiative cooling is most active at various stages of the fog initiation and growth process
• Demonstrate an understanding of the effects that various condensation nuclei types and concentrations have on fog formation
• Sequence the key processes and events that occur during formation of a layer of radiation fog
• Demonstrate an understanding of how the fog-top inversion is created by the fog itself
• Demonstrate an understanding of influences that heat flux from the surface have on a fog layer during its initiation and growth
With Regard to Maintenance Phase:
• Describe key processes that balance one another to allow a fog layer to maintain a relatively constant depth
• Identify conditions in and above a fog-top layer that support continued condensate production
• Identify conditions in and above a fog-top layer that restrict further deepening
• Demonstrate an understanding of the effects that various condensation nuclei types and concentrations have on fog maintenance
• Demonstrate an understanding of the effects that introduction of an overlying cloud layer have on a mature fog layer at the surface
• Demonstrate an understanding of influences that heat flux from the surface have on a mature fog layer
• Identify the typical level of a fog-top inversion
• Demonstrate an understanding of how the fog-top inversion is maintained by various processes at and above the top of the fog layer
With Regard to Dissipation Phase:
• Identify key processes that contribute to the dissipation of a fog layer
• Apply a droplet settling rate calculation to predict the time required for a given depth of fog layer to settle to the ground in the absence of any new condensate production
• Demonstrate an understanding of how radiative heating contributes to dissipation of a fog layer
• Demonstrate an understanding of how turbulent mixing contributes to dissipation of a fog layer
• Demonstrate an understanding of how changes in low-level winds can contribute to dissipation of a fog layer
• Demonstrate an understanding of how introduction of an overlying cloud layer can contribute to dissipation of a fog layer
With Regard to Detecting Fog:
• Identify surface observations that show atmospheric conditions conducive to radiation fog
• Identify soundings that show atmospheric conditions conducive to radiation fog
• Identify fog in satellite images
• Describe the limitations of infrared satellite images for detecting radiation fog
With Regard to Forecasting Fog:
• Describe the diurnal cycle of radiation fog occurrence
• Demonstrate and understanding of the strong seasonal dependence of radiation fog occurrence in at least two localities
• Describe which forecast products best show the atmospheric conditions conducive to radiation fog
• Describe the limitations of numerical forecast models in predicting radiation fog
Estimated time to complete: 2 h
Includes audio: yes
Required plug-ins:  Flash Flash  RealPlayer RealPlayer  Java Java  Adobe® Reader® Adobe® Reader®
* Plug-in information
Last published on: 2002-02-04
close
|

|
FORMOSAT-3/COSMIC
description (click to show/hide) |
Quiz
|
 Description: Description:
The FORMOSAT-3 (Taiwan's Formosa Satellite Mission #3)/COSMIC (Constellation Observing System for Meteorology, Ionosphere & Climate) mission involves deployment of six satellites. Using the radio occultation technique, these satellites will interact with GPS satellites and Earth systems to gather data on our planet’s atmosphere. This mission not only has great value for weather, climate, and space weather research and forecasting, but also geodesy, gravity research, and other applications. Assimilation schemes are being developed to effectively integrate the data into existing operational weather forecasting models.
Objectives:
After completing the module the learner will be able to:
1) Describe the history of radio occultation.
2) State the principle of radio occultation and why it is so effective for Earth.
3) Describe the inversion of radio occultation data and the information derived.
4) State how radio occultation data has been validated with other data sources.
5) Describe the advantage of the open-loop versus phased-locked-loop tracking method.
6) State how radio occultation aids in the measurement of the planetary boundary layer.
7) List significant satellite missions and explain their contributions to radio occultation.
8) Describe the main features of the FORMOSAT-3/COSMIC mission.
9) List the payloads of FORMOSAT-3/COSMIC mission and describe what each does.
10) Explain how radio occultation will help monitoring and forecasting of weather.
11) Explain how radio occultation will help monitoring and forecasting of climate.
12) Explain how radio occultation will help monitoring and forecasting of space weather.
13) Describe the responsibilities of the CDAAC in the processing and flow of data.
14) Explain how and where to get archived or real-time radio occultation data.
Estimated time to complete: 75 min
Includes audio: yes
Required plug-ins:  Flash Flash  RealPlayer RealPlayer  Java Java  Adobe® Reader® Adobe® Reader®
* Plug-in information
Last published on: 2006-07-07
close
|

|
Freezing and Melting, Precipitation Type, and Numerical Weather Prediction
description (click to show/hide) |
Quiz
|
 Description: Description:
This Webcast is based on a COMET classroom presentation by Dr. Gary Lackmann at the 2nd MSC Winter Weather Course held in Boulder, Colorado on 22 February 2002. Dr. Lackmann reviews the basic thermodynamics of freezing and melting and how operational models represent these processes. He also touches upon the biases that occur in the models by looking at examples of melting snow aloft, melting snow at the surface, freezing aloft (ice pellets), and freezing rain. Dr. Lackmann is a faculty member in the Department of Marine, Earth, and Atmospheric Sciences at North Carolina State University.
Objectives:
1. Examine four thermodynamic scenarios closely, each of which produces a different precipitation situation.
2. Compare sounding, radar, and model signatures associated with these scenarios.
3. Compare the representation of these thermodynamic processes in operational models at and near the surface.
4. Become aware of potential problems with the model forecasts.
5. Examine the limiting processes and requirements for freezing rain.
Estimated time to complete: 35 min
Includes audio: yes
Required plug-ins:  Flash Flash  RealPlayer RealPlayer  Java Java  Adobe® Reader® Adobe® Reader®
* Plug-in information
Last published on: 2002-07-03
close
|

|
From mm to cm... Study of snow/liquid water ratios in Quebec
description (click to show/hide) |
No Quiz
|
 Description: Description:
In a detailed 130 page report, Ivan Dubé of the Meteorological Service of Canada reviews the factors that contribute to snow density, and presents a new and improved algorithm based on data from Québec for diagnosing and predicting snow density. A verification of the algorithm is included, along with a few case examples. This document is in English as a .pdf file. A French version is also available: http://meted.ucar.edu/norlat/snowdensity/rapportneigeeau.pdf
Estimated time to complete: 10 h
Includes audio: no
Required plug-ins:  Flash Flash  RealPlayer RealPlayer  Java Java  Adobe® Reader® Adobe® Reader®
* Plug-in information
Last published on: 2003-12-18
close
|

|
Frontogenetical Circulations and Stability
description (click to show/hide) |
Quiz
|
 Description: Description:
“Frontogenetical Circulations and Stability” is a Webcast by Dr. James T. Moore that focuses on an overview of different stability types, including convective, potential, inertial, conditional and symmetric, the concept of frontogenesis and associated circulations. The webcast concludes with a discussion of the role of stability in determining the character of frontogenetical circulations.
Objectives:
1. Understand various types of stability, including convective, potential, inertial, conditional and symmetric, and recognize when they might occur for a given forecast situation.
2. Understand the concept of frontogenesis/frontolysis and associated circulations that result.
3. Recognize the impact of stability on the character of frontal circulations.
Estimated time to complete: 45 min
Includes audio: yes
Required plug-ins:  Flash Flash  RealPlayer RealPlayer  Java Java  Adobe® Reader® Adobe® Reader®
* Plug-in information
Last published on: 2007-10-24
close
|

|
Gap Winds
description (click to show/hide) |
Quiz
|
 Description: Description:
This module provides a basic understanding of why gap winds occur, their typical structures, and how gap wind strength and extent are controlled by larger-scale, or synoptic, conditions. You will learn about a number of important gap flows in coastal regions around the world, with special attention given to comprehensively documented gap wind cases in the Strait of Juan de Fuca and the Columbia River Gorge. Basic techniques for evaluating and predicting gap flows are presented. The module reviews the capabilities and limitations of the current generation of mesoscale models in producing realistic gap winds. By the end of this module, you should have sufficient background to diagnose and forecast gap flows around the world, and to use this knowledge to understand their implications for operational decisions. Other features in this module include a concise summary for quick reference and a final exam to test your knowledge. Like other modules in the Mesoscale Meteorology Primer, this module comes with audio narration, rich graphics, and a companion print version.
Objectives:
After completing this module, the learner should be able to do the following:
With regard to the description of gap winds:
• Recall where in a gap the strongest wind speeds are typically observed.
• Describe the different kinds of topographic gaps and their effect on gap flow.
• List at least 3 natural hazards that may be associated with gap winds.
With regard to the structure of gap winds:
• Describe how wind speed varies through the gap during a gap flow event.
• Describe the temperature profile through a gap during a gap flow event.
• Describe the pressure profile through a gap during a gap flow event.
With regard to the origin of gap flows:
• Describe the conditions required for geostrophic flow.
• Recall that gap winds are typically non-geostrophic.
• Describe the origin of the pressure gradients that occur across gaps.
• Recall that the thinning of low-level cool air at a gap exit can increase the pressure gradient across a gap.
• Recall that adiabatic warming of downslope winds can increase the pressure gradient across a gap.
With regard to forecasting gap winds:
• Qualitatively describe how varying the following factors affects wind speed through a gap:
* Pressure gradient
* Surface roughness
* Gap length
* Temperature
• Describe the horizontal resolution of a mesoscale model required to accurately forecast flow through a gap.
Estimated time to complete: 1.5-2 h
Includes audio: yes
Required plug-ins:  Flash Flash  RealPlayer RealPlayer  Java Java  Adobe® Reader® Adobe® Reader®
* Plug-in information
Last published on: 2003-03-20
close
|

|
Heavy Banded Snow
description (click to show/hide) |
Quiz
|
 Description: Description:
This webcast is based on a presentation by Dr. Moore MSC/COMET Winter Weather Workshop in Boulder, CO, 4 December 2002. In it, he covers the definition of the TROWAL and its role in heavy snow production in the form of bands primarily located to the northwest of the surface low. The various conveyor belts associated with mature winter cyclones are emphasized. The roles of mid-level frontogenesis and conditional symmetric instability in these systems are discussed in the context of heavy snow development.
Objectives:
1. Examine the structure of a mature midlatitude cyclone from the conveyor belt standpoint.
2. Understand how areas where equivalent potential vorticity < 0 are conducive to conditional symmetric instability and snowbands.
3. Demonstrate the positive interaction between frontogenesis and zones favorable for CSI.
4. Compare these features in two CONUS case studies.
Estimated time to complete: 45 min
Includes audio: yes
Required plug-ins:  Flash Flash  RealPlayer RealPlayer  Java Java  Adobe® Reader® Adobe® Reader®
* Plug-in information
Last published on: 2003-09-23
close
|

|
History of the Incident Meteorologist Program
description (click to show/hide) |
Quiz
|
 Description: Description:
The “History of the Incident Meteorologist Program” describes the evolution of fire weather support by National Weather Service meteorologists, including the more recent expansion to other hazardous incidents and significant national events. This webcast also reviews the evolution of the Air-Transportable Meteorological Unit (ATMU) into today’s AMRS/FxNet system used by Incident Meteorologists today. This short webcast is part of the Advanced Fire Weather Forecasters Course.
Objectives:
At the end of this module you should be able to:
• Identify key events and milestones in the NWS Fire Weather and IMET program
• Describe the ATMU and its evolution into today's AMRS/FxNet system used by IMETs today
• Describe important customer issues that arose in the 1990s and steps made in recent years to resolve these issues and improve/expand IMET services
Estimated time to complete: 15 min
Includes audio: yes
Required plug-ins:  Flash Flash  RealPlayer RealPlayer  Java Java  Adobe® Reader® Adobe® Reader®
* Plug-in information
Last published on: 2008-02-29
close
|

|
How Mesoscale Models Work
description (click to show/hide) |
Quiz
|
 Description: Description:
The goal of this training module is to help you increase your understanding of how mesoscale models work. Such understanding, in turn, can help you more efficiently and accurately evaluate model-generated forecast products.
Objectives:
Terminal Objectives
By the end of this module you will be able to do the following:
1. Describe how mesoscale models work
2. Evaluate the strengths and weaknesses of different NWP models
Enabling Objectives
By the end of this module you will be able to do the following:
1. Describe the benefits and limitations of mesoscale NWP models.
2. Describe the relationship between grid spacing and model resolution for NWP models.
3. Describe the pros and cons of increasing model resolution
4. Describe hydrostatic balance and how hydrostatic NWP models differ from non-hydrostatic NWP models
5. Define Eta, sigma, and pressure vertical coordinates schemes and describe their respective advantages.
6. Define parameterization and describe the benefits of its use in NWP models
7. List at least 3 processes that are typically parameterized.
8. Describe limited area model (LAM), spin-up, and warm start, and how they are all related.
9. Describe the benefits and limitations of a warm start.
Estimated time to complete: 30 min
Includes audio: yes
Required plug-ins:  Flash Flash  RealPlayer RealPlayer  Java Java  Adobe® Reader® Adobe® Reader®
* Plug-in information
Last published on: 2002-04-22
close
|

|
How Models Produce Precipitation & Clouds
description (click to show/hide) |
Quiz
|
 Description: Description:
Part of the Numerical Weather Prediction Professional Development Series, this module explores how NWP models handle precipitation and cloud processes through parameterizations and/or explicit methods, with an emphasis on how a model's treatment of these processes affects its ability to depict and forecast precipitation and other related forecast variables.
The subject matter expert for this module is Dr. Ralph Petersen of the National Centers for Environmental Prediction, Environmental Modeling Center (NCEP/EMC).
Estimated time to complete: 3-6 h
Includes audio: no
Required plug-ins:  Flash Flash  RealPlayer RealPlayer  Java Java  Adobe® Reader® Adobe® Reader®
* Plug-in information
Last published on: 2000-07-27
close
|

|
Hurricane Strike!™
description (click to show/hide) |
No Quiz
|
 Description: Description:
Designed primarily for middle school students and funded by FEMA and the NWS, this module creates a scenario to frame learning activities that focus on hurricane science and safety.
Over the course of seven days, Hurricane Erin forms in the Atlantic Ocean, crosses the Florida peninsula, and then makes another landfall at Fort Walton Beach. During these days, the learner is introduced to many basic concepts of atmospheric science, climate, and geography, while also learning some important and possibly life-saving safety and preparedness skills. The module includes several interactive games and activities that address hurricane meteorology and hurricane safety.
Teachers and others who use the module for public education will find the "Information for Teachers" section particularly useful. This section provides information about all of the main learning objects in the module, as well as access to them as stand-alone activities. Links to numerous hurricane-related Web sites are also included, as are links to expert advice about helping children deal with trauma. Worksheets that test the learner's understanding of the module's content are provided in this section, as well as throughout the module. Versions are also available for hearing, motor, and visually impaired students.
Estimated time to complete: 2-3 h
Includes audio: yes
Required plug-ins:  Flash Flash  RealPlayer RealPlayer  Java Java  Adobe® Reader® Adobe® Reader®
* Plug-in information
Last published on: 2002-05-10
close
|

|
Hurricanes Canadian Style: Extratropical Transition
description (click to show/hide) |
Quiz
|
 Description: Description:
This Webcast is based on a presentation delivered by Jim Abraham of MSC at the Winter Weather Course in February 2001. The presentation discusses how, under the right synoptic conditions, hurricanes and tropical storms undergo a transition process to extratropical cyclones as they move into northern latitudes. During the transition process these "hybrid" systems can bring damaging weather conditions to Eastern Canada and the Northeastern States. It uses several case examples to demonstrate the process.
Objectives:
• Identify meteorological parameters favorable for tropical cyclone formation
• Identify meteorological parameters that inhibit hurricane intensification
• Describe the characteristics of a tropical cyclone prior to extra-tropical transition
• Describe the characteristics of transitioning tropical cyclones
• Detail the regions of a tropical cyclone and extratropical low that generate the greatest rainfall and winds
Estimated time to complete: 45 min
Includes audio: yes
Required plug-ins:  Flash Flash  RealPlayer RealPlayer  Java Java  Adobe® Reader® Adobe® Reader®
* Plug-in information
Last published on: 2002-05-02
close
|

|
Icing Assessment Using Observations and Pilot Reports
description (click to show/hide) |
Quiz
|
 Description: Description:
This Web-based learning module is the second title in a series of modules about the use of diagnostic tools to evaluate icing type and severity. Marcia Politovich of the NCAR Research Applications Program (RAP) is the principle subject matter expert. The module teaches how to assess surface observations, upper-air charts, and pilot reports (PIREPs) in order to diagnose the aviation icing environment. Topics include strengths, weaknesses, and appropriate uses of these data, data assessment methods, interpretation and evaluation of PIREPs, and a bottom-up procedure for integrated icing diagnosis at a particular location. This module includes numerous practice exercises allowing learners to improve their skills in icing assessment using these basic observational tools.
Objectives:
The goal of this training module is to help you improve your skill in using observational and pilot report data to locate areas and layers that are likely to have favorable conditions for in-flight aircraft icing.
Performance Objectives
Use surface observations to evaluate:
• precipitation location & type
• temperatures
• cloud cover & type, ceiling heights
• air mass configurations (indicated by fronts, low pressure centers, etc.)
Use upper-air charts and analyses to evaluate:
• cloud layers, cloud tops, likely cloud phase
• temperature structure
And interpret PIREPs to:
• identify location, altitude and time of icing reports
• identify icing type & severity reported
• assess the spatial extent of icing based on reports
Based on these:
• infer likely precipitation and temperature structure above a location
• locate likely areas and layers containing supercooled liquid water (SLW) & freezing precipitation
• assess applicability of PIREPs
• identify areas without icing PIREPs that are likely to contain icing conditions
• track trends and changes in icing conditions
Estimated time to complete: 1-2 h
Includes audio: no
Required plug-ins:  Flash Flash  RealPlayer RealPlayer  Java Java  Adobe® Reader® Adobe® Reader®
* Plug-in information
Last published on: 1999-04-08
close
|

|
Icing Assessment Using Soundings and Wind Profiles
description (click to show/hide) |
No Quiz
|
 Description: Description:
Marcia Politovich of the NCAR Research Applications Program (RAP) is the principle subject matter expert for this
Web-based learning module. The module teaches how to assess vertical profiles of wind, temperature, dewpoint, and frost point in order to diagnose airmass characteristics, cloud layers, and possible aviation icing layers. Topics include strengths, weaknesses, and appropriate uses of rawinsonde and profiler data for assessment of aviation icing, icing characteristics of the different extratropical cyclone air masses, identification of dry and saturated layers and possible zones of favorable conditions for aircraft icing, and ice seeding and glaciation processes. If you wish, you may launch the module from this location. Note: This module requires use of the companion CD-ROM called The Icing Event of 6 March 1996.
Objectives:
The goal of this training module is to help you improve your skill in using sounding and profiler data to locate areas and layers that are likely to have favorable conditions for in-flight aircraft icing.
Performance Objectives
• Analyze skew-T diagrams and wind profile time series to identify the likely extratropical cyclone air masses influencing them.
• Describe the typical characteristics of the different extratropical cyclone air masses as they relate to aviation icing conditions.
• Analyze profiles of temperature, dewpoint, frost point, and winds in skew T-log p diagrams to identify dry and saturated layers and possible zones of favorable conditions for aircraft icing.
• Apply knowledge of ice seeding and glaciation processes to various cloud layer configurations to anticipate the evolution of icing conditions.
• Describe strengths, weaknesses, and appropriate uses of rawinsonde and profiler data for assessment of aviation icing.
Estimated time to complete: 1-2 h
Includes audio: no
Required plug-ins:  Flash Flash  RealPlayer RealPlayer  Java Java  Adobe® Reader® Adobe® Reader®
* Plug-in information
Last published on: 1999-04-08
close
|

|
Imaging with NPOESS VIIRS: A Convergence of Technologies and Experience
description (click to show/hide) |
Quiz
|
 Description: Description:
This module introduces the NPOESS VIIRS imager that will fly on the NPOESS Preparatory Project and the NPOESS satellites. The VIIRS imager has many advanced features that will improve both spectral and temporal resolution. Ninety-five percent of VIIRS data will be available within 28 minutes of overpass time, providing consistent, high-quality, high-resolution data to users. This module covers the improvements to VIIRS by examining the systems that contributed to its development. Special attention is paid to the Day/Night Visible channel as VIIRS will be the first civilian satellite to image atmospheric and terrestrial features with and without moonlight.
Objectives:
• Name the important heritage instruments that led to the development of NPOESS
• State the advantages of multispectral imagery in fire and hot spot detection/interpretation
• Use true color imagery to identify surface, atmospheric, and ocean
surface features and characteristics
• Discriminate between nadir and edge of scan passes from AVHRR
• Describe the difference between fine and smooth OLS data
• State the advantages of the nighttime visible channel on OLS
• State features that can be seen during no-moon, half-moon, and full-moon illuminations
• Identify features in no-moon, half-moon, and full-moon illuminations
Estimated time to complete: 45 min
Includes audio: yes
Required plug-ins:  Flash Flash  RealPlayer RealPlayer  Java Java  Adobe® Reader® Adobe® Reader®
* Plug-in information
Last published on: 2004-10-25
close
|

|
Impact of Model Structure & Dynamics
description (click to show/hide) |
Quiz
|
 Description: Description:
Impact of Model Structure & Dynamics, part of the Numerical Weather Prediction Professional Development Series and the NWP Distance Learning Course, provides operationally significant information about model type, horizontal resolution, vertical coordinate systems, vertical resolution, and domain and boundary conditions, with an emphasis on how each aspect can affect a model's ability to depict and forecast weather.
The subject matter expert for this module is Dr. Ralph Petersen of the National Centers for Environmental Prediction, Environmental Modeling Center (NCEP/EMC).
Estimated time to complete: 3-5 h
Includes audio: no
Required plug-ins:  Flash Flash  RealPlayer RealPlayer  Java Java  Adobe® Reader® Adobe® Reader®
* Plug-in information
Last published on: 2000-09-21
close
|

|
In-depth Physics Lessons
description (click to show/hide) |
No Quiz
|
 Description: Description:
This collection of four condensed physics lessons is offered as a companion to our Physics of the Aurora: Earth Systems learning module, and has been developed especially for use by university physics educators. The lesson topics are Charged Particle Motions, Magnetic Force, the Frozen-field Theorem, and Static Atmospheres. Each short, self-contained lesson can be accessed independently and includes interactive formula derivations, exercises, and open-ended questions suitable for classroom discussion or out-of-class assignments.
Estimated time to complete: 1-2 h
Includes audio: yes
Required plug-ins:  Flash Flash  RealPlayer RealPlayer  Java Java  Adobe® Reader® Adobe® Reader®
* Plug-in information
Last published on: 2004-12-28
close
|

|
Influence of Model Physics on NWP Forecasts
description (click to show/hide) |
Quiz
|
 Description: Description:
This module describes model parameterizations of sub-surface, boundary-layer,and free atmospheric processes, such as surface snow processes, soil characteristics, vegetation, evapotranspiration, PBL processes and parameterizations, and trace gases, and their interaction with the radiative transfer process. It specifically addresses how models treat these physical processes and how they can influence forecasts of sensible weather elements.
Objectives:
Working through the material will help you to
• Develop a basic understanding of how radiation and associated processes are emulated in NWP models
• Understand when model physics are most important to the model forecast (versus model dynamics)
• Understand that model physics are specifically tuned to work best in certain situations and specific models
• Understand that model physics parameterizations affect other parameterizations, model dynamics, and data assimilation, which may result in feedbacks
• Identify impacts of model physics and their errors on model forecasts both at and around the forecast location
• Identify effects that are smaller than the model can emulate (for example, the resolution of surface characteristics is coarse but real effects occur at fine resolution)
Estimated time to complete: 1.5 h
Includes audio: no
Required plug-ins:  Flash Flash  RealPlayer RealPlayer  Java Java  Adobe® Reader® Adobe® Reader®
* Plug-in information
Last published on: 2000-11-17
close
|

|
Intelligent Use of Model-Derived Products
description (click to show/hide) |
Quiz
|
 Description: Description:
This module was developed and released in three sections: Postprocessing/Products, Statistical Guidance, and Assessment Tools. Specific topics covered include the impact of postprocessing and how to account for it, the statistical methods used to enhance raw model output including how statistical guidance products like MOS are generated, as well as NWP verification methodologies and use of daily model diagnostics.
The subject matter expert for this module is Dr. Ralph Petersen of the National Centers for Environmental Prediction, Environmental Modeling Center (NCEP/EMC), and J. Paul Dallavalle of the National Weather Service (NWS), Meteorological Development Laboratory, Statistical Modeling Branch (MDL/SMB). The primary content author was Kirby Cook, NWS, Western Region Headquarters (WRH)/Scientific Services Division (SSD).
Estimated time to complete: 1-2 h
Includes audio: no
Required plug-ins:  Flash Flash  RealPlayer RealPlayer  Java Java  Adobe® Reader® Adobe® Reader®
* Plug-in information
Last published on: 2000-10-02
close
|

|
Introduction to Distributed Hydrologic Modeling
description (click to show/hide) |
Quiz
|
 Description: Description:
In this webcast, Diane Cooper, with the Southern Region Headquarters of NOAA’s National Weather Service, provides a basic scientific description of the physical processes, mathematical equations, and data issues with respect to distributed hydrologic models. Ms. Cooper first explains the background of hydrologic modeling and how that influences the current state-of-the-art for distributed hydrologic modeling. She then describes the physical process that distributed hydrologic models are attempting to capture and covers a few basic mathematical equations related to these models. She also identifies modeling challenges related to the complexity, calibration, and large data requirements, and gives an overview of the results to date of distributed hydrologic models used at the NWS. The target audience for this module is NWS forecasters who have little or no training in hydrology but can benefit from knowing how distributed hydrologic models work.
Objectives:
* Explain the attributes of current operational lumped models
* Describe the basic attributes of and reasons for using a distributed model
* Describe the implementation process of Distributed Hydrologic Modeling System (DHMS) in the National Weather Service
* Describe preliminary results of Distributed Hydrologic Modeling
* Explain sample Distributed Hydrologic Modeling (DHM) graphical output & other potential products
* Describe expected future development of Distributed Hydrologic Modeling within the NWS
Estimated time to complete: 1 hr
Includes audio: yes
Required plug-ins:  Flash Flash  RealPlayer RealPlayer  Java Java  Adobe® Reader® Adobe® Reader®
* Plug-in information
Last published on: 2008-08-04
close
|

|
Introduction to Ensemble Prediction
description (click to show/hide) |
Quiz
|
 Description: Description:
This webcast is a shorter companion to the Ensemble Prediction Explained module, focusing more directly on immediate operational needs. Introductory content includes the role of ensemble forecasts, presentation of basic ensemble forecasting terms, and discussion of how ensemble prediction systems (EPSs) are created. The largest section is focused on common ensemble forecast products, including how they differ from traditional NWP products, how we interpret ensemble forecast products, the advantages and limitations of each product, how EPS products are verified, and how to use ensemble products in conjunction with one another to increase your understanding of forecast uncertainty. Finally, three brief cases from cold and warm seasons illustrate the use of ensemble products in the forecast process.
Objectives:
1. State the benefits of including ensemble model forecasts in the NWP product suite.
2. Define the following terms used in ensemble forecasting:
* Ensemble perturbation
* Ensemble member
* Control forecast
* Perturbation forecast
* Ensemble Prediction System (EPS)
3. Describe three methods commonly used to produce the members of an EPS.
4. Describe how ensemble forecast products differ from traditional NWP products.
5. Interpret ensemble forecast products to determine the probabilistic EPS forecast.
* Interpret spaghetti plots, mean and spread plots, probability of exceedance plots, most likely or dominant event plots, plume diagrams, box and whisker diagrams, and ensemble soundings.
* State advantages and limitations to each of the above products.
6. Use ensemble products in conjunction with one another to increase your understanding of forecast uncertainty.
7. Use ensemble verification products to evaluate the performance of an EPS, including reliability and Talagrand diagrams.
Estimated time to complete: 59 min
Includes audio: yes
Required plug-ins:  Flash Flash  RealPlayer RealPlayer  Java Java  Adobe® Reader® Adobe® Reader®
* Plug-in information
Last published on: 2005-06-27
close
|

|
Introduction to Fire Behavior: Influences of Topography, Fuels, and Weather on Fire Ignition and Spread
description (click to show/hide) |
Quiz
|
 Description: Description:
This website provides an overview of factors that affect the ignition and spread of wildfire. Information is presented with 3-dimensional graphics and animations as well as audio descriptions and commentary provided by a fire behavior expert. You don't need extensive background in fire science or weather forecasting to use this site.
Estimated time to complete:
Includes audio: yes
Required plug-ins:  Flash Flash  RealPlayer RealPlayer  Java Java  Adobe® Reader® Adobe® Reader®
* Plug-in information
Last published on: 2002-08-21
close
|

|
Introduction to Ocean Currents
description (click to show/hide) |
Quiz
|
 Description: Description:
This module discusses the origin of ocean currents in both the open ocean and in coastal areas. The module focuses on the driving mechanisms for currents, along with influences that modify existing currents. Driving mechanisms include wind, horizontal density differences, and tides, while modifying effects include friction, bathymetry, and the Ekman spiral. The module concludes with a demonstration of data products and a brief overview of forecast considerations.
Objectives:
After completing this module, the learner should be able to do the following things:
1. Identify the locations of the major and minor ocean currents and describe their origin
1. List the factors that cause ocean currents
2. Describe how each factor influences ocean currents
2. Characterize open-ocean currents in terms of temperature, volume (transport), and speed.
3. Describe the origin of strong horizontal and vertical temperature, salinity, and density gradients in both open ocean and coastal ocean environments.
4. Describe the effects of friction, bathymetry, and Coriolis force on ocean currents in both open ocean and coastal ocean environments.
5. Explain the role of ocean currents in the global distribution of heat (i.e., the earth's heat budget).
1. Define global meridional overturning circulation (MOC)
2. Describe the origin of North Atlantic Deep Water and Antarctic Bottom Water
6. Describe current prediction methods and forecast considerations
Estimated time to complete: 2 h
Includes audio: yes
Required plug-ins:  Flash Flash  RealPlayer RealPlayer  Java Java  Adobe® Reader® Adobe® Reader®
* Plug-in information
Last published on: 2007-10-04
close
|

|
Introduction to Ocean Models
description (click to show/hide) |
Quiz
|
 Description: Description:
Oceans cover over 70% of the surface of the earth, yet many details of their workings are not fully understood. To better understand and forecast the state of the ocean, we rely on numerical ocean models. Ocean models combine observations and physics to predict the ocean temperature, salinity, and currents at any time and any place across the ocean basins. This module will discuss what goes into numerical ocean models, including model physics, coordinate systems, parameterization, initialization, and boundary conditions.
Objectives:
1. Explain the similarities and differences between ocean and atmospheric modeling.
2. Explain the physical laws and processes that must be considered in developing an ocean model.
3. Explain how the physical properties of the ocean differ from those of the atmosphere.
4. Explain the processes that are built into a numerical ocean model.
5. Explain how resolution and scale are important to global, regional, and local ocean models.
6. Describe a numerical model and how it can be used as a prediction tool.
7. Explain how real-time observations and climatology contribute to ocean models.
Estimated time to complete: 1-2 h
Includes audio: yes
Required plug-ins:  Flash Flash  RealPlayer RealPlayer  Java Java  Adobe® Reader® Adobe® Reader®
* Plug-in information
Last published on: 2007-08-06
close
|

|
Introduction to Ocean Tides
description (click to show/hide) |
Quiz
|
 Description: Description:
Ocean tides profoundly impact coastal maritime operations. This module provides an introduction to the origin, characteristics, and prediction of tides. After introducing common terminology, the module examines the mechanisms that cause and modify tides, including both astronomical and meteorological effects. A discussion of tide prediction techniques and products concludes the module. This module includes rich graphics, audio narration, embedded interactions, and a companion print version.
Objectives:
1. List and define terms used to describe tides.
2. List and define the forces that cause and modify tides.
3. Define tidal constituents.
4. Describe tidal datum and why it is important.
5. Describe tide prediction methods
6. Explain when to use tidal observations vs. models
Estimated time to complete: 45 min
Includes audio: yes
Required plug-ins:  Flash Flash  RealPlayer RealPlayer  Java Java  Adobe® Reader® Adobe® Reader®
* Plug-in information
Last published on: 2006-09-22
close
|

|
Introduction to Tropical Meteorology, Chapter 10: Tropical Cyclones
description (click to show/hide) |
Quiz
|
 Description: Description:
Chapter 10, Tropical Cyclones, is the third published chapter of the online textbook, Introduction to Tropical Meteorology. Tropical cyclones are the deadliest tropical weather systems. This chapter describes their seasonal and geographic variability and controls, decadal cycles, and history of naming conventions. Tropical cyclogenesis is explored in depth and the core and balance solutions for regions of the cyclone are examined. Intensity is considered in terms of inner-core dynamics, large-scale environmental controls, limits on potential intensity, satellite interpretation techniques, and classification by wind speed. Factors that influence motion are investigated. Extratropical transition is described in terms of structural changes, preceding mechanisms, and impact on high latitudes. Societal impacts and mitigation are also covered.
Objectives:
At the end of this chapter, you should understand and be able to:
* Describe tropical cyclone global climatology (where and when they form, where most form, least, or none form)
* Identify distinguishing features of tropical cyclones (eye, eyewall, spiral bands, surface inflow, upper outflow)
* Identify inner core features such as eye-wall vortices
* Describe ingredients needed for formation or genesis (including subtropical genesis)
* Define the stages of a tropical cyclone lifecycle (wave, depression, tropical storm, tropical cyclone, severe tropical cyclone, decay)
* Using satellite remote sensing, describe how you could detect changes in intensity of tropical cyclones
* Describe the links found between inner core dynamics and changes in cyclone structure and intensity
* Describe the mechanisms that influence tropical cyclone motion from its precursor tropical wave to its landfall in a midlatitude continent
* Describe various mechanisms that lead to extratropical transition
* Describe the hazards of tropical cyclones particularly those at landfall (storm surge, heavy rain and floods, strong winds, tornadoes, ocean waves) and understand the basic mechanisms for each type of hazard
Estimated time to complete: 5 h
Includes audio: no
Required plug-ins:  Flash Flash  RealPlayer RealPlayer  Java Java  Adobe® Reader® Adobe® Reader®
* Plug-in information
Last published on: 2007-08-21
close
|

|
Introduction to Tropical Meteorology, Chapter 3: Tropical Remote Sensing Applications
description (click to show/hide) |
Quiz
|
 Description: Description:
Chapter 3: Tropical Remote Sensing Applications, is the first published chapter of the online textbook, "Introduction to Tropical Meteorology." It covers remote sensing—the primary method of observing weather and climate across the global tropics. Learners will become familiar with the scientific basis and applications of radar and satellite remote sensing from examples in which clouds and precipitation are observed by measuring microwave signals using ground-based radar, spaceborne radar, and satellite radiometers. Wind estimation, dust and volcanic ash tracking, vertical sounding techniques, and remote measurement of sea-surface, soil and land surface properties are also covered. The online textbook has many special features, including individual chapter review questions and quiz, topic focus sections, direct access to operational forecasting topics, box sections that elaborate on theoretical concepts, links to resources for further study, critical thinking questions interspersed throughout the text, icons that identify resource links and critical thinking exercises, and science biographies.
Objectives:
At the end of this chapter, users should understand and be able to describe:
* Why remote sensing is important in the tropics
* Several tropical applications of ground-based radars
* The advantages and limitations of airborne and spaceborne radar
* Several tropical meteorology applications of satellite radar and microwave remote sensing
* The benefits and weaknesses of satellite estimates of water vapor content
* How GPS satellite signals are used to derive temperature and humidity profiles and how this benefits tropical meteorology
* The benefits and weaknesses of satellite precipitation estimates
* How lightning is detected by satellite
* The benefits and weaknesses of satellite wind estimation
* Why microwave sensors are useful for identifying surface moisture
* How vegetation and other land use/land cover changes are monitored by satellite
* How meteorologically important features, such as cloud properties, are monitored with satellite imagery
* How satellites are used for air quality assessment, such as dispersion of volcanic ash, chemical pollutants, dust, and smoke
Estimated time to complete: 100-110 mins
Includes audio: no
Required plug-ins:  Flash Flash  RealPlayer RealPlayer  Java Java  Adobe® Reader® Adobe® Reader®
* Plug-in information
Last published on: 2007-08-31
close
|

|
Introduction to Tropical Meteorology, Chapter 6: The Distribution of Moisture and Precipitation
description (click to show/hide) |
Quiz
|
 Description: Description:
Chapter 6, The Distribution of Moisture and Precipitation, is the second published chapter of the online textbook, Introduction to Tropical Meteorology. Moisture and precipitation distribution governs life in the tropics. Surplus heating and rising motion in the tropics ignites the global water and energy cycles and influences weather in the midlatitudes. Chapter 6 presents the horizontal and vertical distribution of water vapor, tropical cloud formation and distribution, the lifecycle and precipitation characteristics of tropical mesoscale convective systems, and the variability of tropical precipitation on yearly, seasonal, and hourly time-scales. The online textbook has many special features including individual chapter review questions and quiz, topic focus sections, direct access to operational forecasting topics, box sections that elaborate on theoretical concepts, links to resources for further study, critical thinking questions interspersed throughout the text, icons that identify resource links and critical thinking exercises, and science biographies.
Objectives:
At the end of this chapter, you should understand and be able to describe:
* Why water vapor is important to weather and climate in the tropics
* The range and distribution of water vapor content in the tropics
* The distribution of evaporation and evapotranspiration rates in the tropics
* The formation of tropical clouds by convection
* The general pattern of cloud distribution in the tropics
* The typical profiles of potential temperature (Theta) and equivalent potential temperature (Theta-e) in the tropical atmosphere
* How the Saharan Air Layer and other dry intrusions changes the vertical distribution of moisture thermodynamic energy
* The concept of moist and dry static (thermodynamic) energy and its vertical distribution in the tropics
* How the vertical distribution of moist static energy varies with different modes of convection
* The differences between convective and stratiform rain in tropical mesoscale convective systems
* The effects of continental and maritime aerosols on tropical precipitation
* The geographic distribution of annual tropical precipitation and its variability
* The factors that influence the geographic distribution of tropical precipitation
* The seasonal distribution of precipitation in the tropics and unique regional patterns
* The differences between the diurnal cycle of tropical precipitation over land and over ocean, including the influential factors
* Unique characteristics of the diurnal cycle during the equatorial transition seasons (spring and autumn)
* The factors that influence the amount and location of rainfall on yearly and multi-year time scales
You should also be able to identify and describe:
* The factors that influence evaporation and evapotranspiration rates
* The dominant cloud types in the tropics
* The typical zonal and meridional distribution of cloud depth over the tropical oceans
Estimated time to complete: 1.5-2 h
Includes audio: yes
Required plug-ins:  Flash Flash  RealPlayer RealPlayer  Java Java  Adobe® Reader® Adobe® Reader®
* Plug-in information
Last published on: 2008-03-19
close
|

|
Introduction to Verification of Hydrologic Forecasts
description (click to show/hide) |
Quiz
|
 Description: Description:
This module offers a comprehensive description of a set of common verification measures for hydrologic forecasts, both deterministic and probabilistic. Through use of rich illustrations, animations, and interactions, this module explains how these verification measures can provide valuable information to users with varying needs. In addition to providing a measure of how well a forecast matches observations, verification measures can be used to help forecasters and users learn about the strengths and weaknesses of a forecast.
Objectives:
• Explain key reasons for performing hydrologic verification and explain important concepts and terminology.
o Define key motivations and purposes of performing forecast verification.
o Explain the need for multiple measures, and why the concept of a “good” forecast is problematic.
o Define and explain the concepts of deterministic and probabilistic forecasts.
o Recognize the seven topics for hydrologic verification and their associated verification measures as created by the NWS Verification Systems Requirements Team.
• Describe key concepts related to the distribution properties of forecasts and observations.
o Define and apply concepts of mean, variance, and standard deviation.
o Describe the purpose of Cumulative Distribution Functions and Probability Density Functions and interpret them.
o Describe the use of the Interquartile Range (IQR) and explain its appropriateness for hydrologic forecast verification.
o Describe the application of a rank histogram to provide useful information about ensemble forecasts.
• Describe key concepts related to measures of forecast confidence.
o Describe how sample size relates to forecast confidence.
o Explain information provided by the confidence interval.
o Define the relationship between confidence level and confidence interval.
o Describe how the confidence interval might be used for statistics.
• Describe key concepts related to correlation measures for forecasts and observations.
o Define correlation.
o Interpret scatter plots to obtain information on correlation.
o Explain use of correlation coefficients.
• Describe key concepts related to categorical forecasts.
o Explain how categorical forecast verification can be applied to either deterministic or probabilistic forecasts.
o Construct and interpret a simple contingency table.
o Describe the meaning of verification statistics that are computed from a contingency table.
o Describe how more complex contingency tables can be used to compute statistics for forecasts associated with more than two categories.
o Explain under what circumstances one would use a Brier Score versus the Ranked Probability Score.
o Explain application of a Brier Score.
o Describe purpose of a Ranked Probability Score.
o Interpret the plot of a Ranked Probability Score.
o Describe key concepts related to error statistics
o Describe use of the Continuous Ranked Probability Score (CRPS).
o Describe the appropriate uses for Mean Absolute Error (MAE), Root Mean Square Error (RMSE) and Mean Error (ME).
o Define forecast bias and explain how it is measured.
• Describe key concepts related to forecast skill and how it provides additional information over error statistics
o Describe the general formulation of a skill score.
o Demonstrate the computation of skill scores associated with Root Mean Squared Error, Brier Score, and Ranked Probability Score.
• Describe key concepts related to conditional verification measures.
o Explain the difference between forecast reliability and forecast discrimination.
o Describe how reliability measures and diagrams can help with verifying conditional forecasts.
o Explain what reliability diagrams show.
o Define forecast sharpness.
o Explain what an attributes diagram shows.
o Interpret a discrimination diagram.
o Interpret a Relative Operating Characteristic (ROC) diagram.
Estimated time to complete: 2h
Includes audio: yes
Required plug-ins:  Flash Flash  RealPlayer RealPlayer  Java Java  Adobe® Reader® Adobe® Reader®
* Plug-in information
Last published on: 2008-06-30
close
|

|
Inverted Troughs and Their Associated Precipitation Regimes
description (click to show/hide) |
Quiz
|
 Description: Description:
This Webcast features Phil Schumacher, NWS Sioux Falls, South Dakota discussing the conditions that dictate the location of precipitation relative to inverted troughs. Phil presents a composite case study based on collaborative research with Dr. R. Weisman and others, as well as two examples of inverted trough events in the Central Plains. This presentation is based on his presentation at the MSC Winter Weather Course, December 2002, in Boulder, Colorado. The webcast is accompanied by a case exercise, Inverted Trough Case Exercise.
Objectives:
1. Describe inverted troughs and their associated precipitating features.
2. Present the results of a composite inverted trough study, based on the differences between inverted troughs that produce precipitation ahead vs. behind the trough.
3. Demonstrate the use of isentropic techniques in diagnosing important inverted trough features.
4. Look at several case studies demonstrating the impact of inverted troughs on precipitation distributions.
Estimated time to complete: 60 min
Includes audio: yes
Required plug-ins:  Flash Flash  RealPlayer RealPlayer  Java Java  Adobe® Reader® Adobe® Reader®
* Plug-in information
Last published on: 2004-01-29
close
|

|
Inverted Troughs Case Exercise
description (click to show/hide) |
No Quiz
|
 Description: Description:
This exercise follows the progression of a winter weather event across the Central Plains states beginning 1200 UTC on 7 March 1999. Each forecast question is accompanied by Eta model data and includes a forecast discussion by Phil Schumacher, NWS Sioux Falls, South Dakota. This exercise compliments the Webcast, Inverted Troughs and their Associated Precipitation Regimes, based on a presentation by Phil Schumacher at the MSC Winter Weather Course, December 2002, in Boulder Colorado.
Objectives:
1. Identify whether precipitation will be primarily ahead or behind an inverted by applying the conceptual model of inverted trough precipitation organization.
2. Use isentropic analysis to view the affect inverted troughs have on moisture transport and the implied lift associated with inverted troughs.
3. Use the conceptual model of inverted trough precipitation organization to determine the approximate beginning and ending time for significant precipitation associated with inverted troughs.
Estimated time to complete: 45 min
Includes audio: no
Required plug-ins:  Flash Flash  RealPlayer RealPlayer  Java Java  Adobe® Reader® Adobe® Reader®
* Plug-in information
Last published on: 2004-01-29
close
|

|
Isentropic Analysis
description (click to show/hide) |
Quiz
|
 Description: Description:
This Webcast, presented by Dr. Jim Moore of St. Louis University, covers the advantages and applications of diagnosis and visualization of large-scale flow and vertical motion on surfaces of constant potential temperature. The movement of moisture along these surfaces is emphasized, as is the diagnosis of the components of vertical motion. Background mathematical concepts are presented, then illustrated with soundings, cross sections, and plan view analyses of data from multiple cases.
Objectives:
1. Understand the concepts of pressure advection and system relative flow.
2. Understand dynamic destabilization and associated environmental moistening.
3. Diagnose static stability, upper fronts and CSI in this framework.
4. Examine at frontogenesis and transverse jet streak circulations on vertical cross sections with analyzed potential temperature fields.
5. Examine the components of vertical motion in an isentropic framework.
6. Compare the advantages and disadvantages of isentropic analysis.
7. Examine a wintertime case study utilizing isentropic analysis.
Estimated time to complete: 1 h
Includes audio: yes
Required plug-ins:  Flash Flash  RealPlayer RealPlayer  Java Java  Adobe® Reader® Adobe® Reader®
* Plug-in information
Last published on: 2002-11-19
close
|

|
Jet Streak Circulations
description (click to show/hide) |
Quiz
|
 Description: Description:
This Webcast is based on a presentation given by Dr. James T. Moore of Saint Louis University at the 5th Annual MSC/COMET Winter Weather Workshop on 30 November 2004 in Boulder, Colorado. Dr. Moore reviews many aspects of jet streak dynamics including convergence/divergence, ageostrophic winds, propagation, and coupled jets.
Objectives:
• Define "jetstreak"
• Note the divergence associated with upper-level waves
• Describe the relationship of divergence with vertical windshear
• Describe the relationship of the ageostrophic wind components with upper-level and low-level jets
• Compare the direct thermal circulation in the entrance region with the indirect thermal circulation in the exit region of an upper-level jet
• Identify how the curvature of an upper-level jet affects divergence and convergence
• Describe the impact thermal advection has on vertical motion and entrance and exit circulations
• Gain an understanding of the characteristics of unbalanced jets and coupled jets
Estimated time to complete: 50 min
Includes audio: yes
Required plug-ins:  Flash Flash  RealPlayer RealPlayer  Java Java  Adobe® Reader® Adobe® Reader®
* Plug-in information
Last published on: 2005-04-25
close
|

|
Landfalling Fronts and Cyclones
description (click to show/hide) |
Quiz
|
 Description: Description:
Landfalling cyclones and their attendant fronts significantly impact the structure of mesoscale wind and precipitation fields along the west coast of North America. This module focuses on the complex interaction of the wind field with topography and the resulting effects on nearshore winds and precipitation. For example, prefrontal conditions may lead to flow blocking, development of a barrier jet, and seaward displacement of the maximum precipitation. Postfrontal conditions tend to promote windward ridging and lee troughing, which enhance along-coast flow.
Objectives:
Performance Objectives
After completing the module, the learner should be able to do the following tasks:
- Describe the conditions under which flow becomes blocked by topography.
- Given the wind speed, stability (Brunt-Vaisala Frequency), and mountain height, determine whether flow will be blocked by topography.
- Describe how the angle between a landfalling front and the coastline
affects the flow/topography interaction.
- Describe how the prefrontal environment may experience enhanced stability.
- Describe the conditions that lead to formation of a barrier jet.
- Describe the change in the pressure field as cold fronts make landfall.
- Given a landfalling front under conditions conducive to flow blocking,
describe the anticipated effects on the motion of the cold front, the
wind field, and the precipitation field.
- Given a landfalling front under conditions that are not conducive
to flow blocking, describe the anticipated effects on the motion of
the cold front, the wind field, and the precipitation field.
- Describe the advantages in using a high-resolution model to forecast the
effects of landfalling fronts, compared to lower-resolution models.
Estimated time to complete: 1.5 h
Includes audio: yes
Required plug-ins:  Flash Flash  RealPlayer RealPlayer  Java Java  Adobe® Reader® Adobe® Reader®
* Plug-in information
Last published on: 2006-05-24
close
|

|
Lectures on Radar Applications in Mesoscale Meteorology
description (click to show/hide) |
No Quiz
|
 Description: Description:
This website provides access to the streaming presentations and PowerPoint source files for the 11 lectures delivered during the AMS Educational Forum “A Primer on Radar Analysis Techniques Used in Mesoscale Meteorology” held on 23 October 2005 in Albuquerque, NM. The presentations discuss how many advanced techniques for the analysis of meteorological radar data can be used to improve understanding of the structure, dynamics, and evolution of mesoscale circulations. The Forum was organized into four sections: 1) Microphysical Characterization of Precipitation Systems Using Dual-Polarization Radar Measurements, 2) Single Doppler Retrieval and Assimilation Techniques for Use in Mesoscale Models, 3) Analysis of Mesoscale Processes Using Wind Profiling Radars and Velocity Azimuth Display and 4) Airborne Doppler Radar Analysis of Tropical and Extratropical Mesoscale Systems.
Objectives:
The objective of the Forum was primarily to introduce graduate students to important radar analysis techniques as they are used in atmospheric science research with the goal of improving our understanding of the structure, dynamics, and evolution of mesoscale circulations. A basic, formal understanding of both radar and mesoscale meteorology is necessary to gain the most from the lectures. Each individual presentation is rated as either intermediate or advanced level content.
Estimated time to complete: 8 h
Includes audio: yes
Required plug-ins:  Flash Flash  RealPlayer RealPlayer  Java Java  Adobe® Reader® Adobe® Reader®
* Plug-in information
Last published on: 2006-02-07
close
|

|
Local Influences on Fog and Low Stratus
description (click to show/hide) |
Quiz
|
 Description: Description:
Local and mesoscale influences can make or break your fog or stratus forecast. Influences of local water bodies, terrain, vegetation, soil characteristics, and coastal features on the lower atmosphere can play a vital role in the development, duration, and intensity of these events. As part of the Distance Learning Course 1: Forecasting Fog and Low Stratus, this module examines several of these influences and discusses how they enhance or inhibit a fog or stratus event.
Objectives:
• Identify three local factors that can enhance fog or stratus development and be able to explain why
• Identify and describe the processes external to the boundary layer that influence duration, intensity, and dissipation
• Identify and describe the processes internal to the boundary layer that influence duration, intensity, and dissipation
Estimated time to complete: 2-3 h
Includes audio: no
Required plug-ins:  Flash Flash  RealPlayer RealPlayer  Java Java  Adobe® Reader® Adobe® Reader®
* Plug-in information
Last published on: 2003-06-28
close
|

|
Low-Level Coastal Jets
description (click to show/hide) |
Quiz
|
 Description: Description:
Low-level coastal jets occur along many coastlines. Winds may exceed 35 knots and lead to high waves and significant low-level vertical wind shear. Thus, low-level coastal jets present a hazard to both marine and aviation operations in the coastal zone. This core module describes the features of coastal jets and explores the conditions under which they form. Like other foundation modules in the Mesoscale Primer, this module starts with a forecast scenario and concludes with a concise summary and a final exam. By the end of this module, you should have sufficient background to diagnose and forecast coastal jets around the world and to use this knowledge to understand the implications for operational decisions.
Objectives:
After completing this module, the learner should be able to do the following things.
With regard to the features of coastal jets:
• Describe a coastal jet; its location, size, strength, and operational impacts
• Describe the synoptic conditions that lead to a coastal jet
• Describe the boundary layer structure that results in a coastal jet
• Describe the role of coastal mountains in the formation of coastal jets
With regard to the thermal structure and forcing of coastal jets:
• Describe how a cool, well-mixed marine boundary layer leads to a baroclinic structure
• Identify an appropriate baroclinic structure for a coastal jet in a vertical cross section of potential temperature
• Given a global plot of sea level pressure, identify locations that are prone to coastal jets
• Recall the difference in conditions that lead to a coastal jet as opposed to a sea breeze
• Recall the origins of cool sea surface temperatures (SSTs)
• On a world map, identify areas prone to cold ocean currents and coastal upwelling
With regard to along-coast variations of coastal jets:
• Given a map of California or Oman, identify local regions of maximum and minimum wind speeds within a coastal jet
• Recall the correlation of wind speed with mesoscale variations in sea level pressure and thickness of the marine boundary layer
• Describe how hydraulic theory can explain variations in the thickness of the marine boundary layer
With regard to forecasting coastal jets:
• On a synoptic scale, recognize the structure that leads to a coastal jet at the surface and at 850 hPa
• On the mesoscale, recognize areas that are prone to local wind maxima within a coastal jet
• Recall which satellite sensors will help detect coastal jets
Estimated time to complete: 1-2 h
Includes audio: yes
Required plug-ins:  Flash Flash  RealPlayer RealPlayer  Java Java  Adobe® Reader® Adobe® Reader®
* Plug-in information
Last published on: 2004-08-16
close
|

|
Marine Wave Model Matrix
description (click to show/hide) |
No Quiz
|
 Description: Description:
The Marine Wave Model Matrix provides information on the formulation of wave models developed by the National Centers for Environmental Prediction (NCEP) and other modeling centers, including how these models forecast the generation, propagation, and dissipation of ocean waves using NWP model forecasts for winds and near-surface temperature and stability. Additionally, information is provided on data assimilation, post-processing of data, and verfication of wave models currently in operation. Within the post-processing pages are links to forecast output both in graphical and raw form, including links for data downloads. Links to COMET training on wave processes are also provided.
Estimated time to complete: 30 min
Includes audio: no
Required plug-ins:  Flash Flash  RealPlayer RealPlayer  Java Java  Adobe® Reader® Adobe® Reader®
* Plug-in information
Last published on: 2006-05-16
close
|

|
Mesoscale Aspects of Winter Weather Forecasting Topics
description (click to show/hide) |
No Quiz
|
 Description: Description:
The Mesoscale Aspects of Winter Weather Forecasting effort is comprised of a growing series of in-depth case exercises bundled with supporting topics. This site provides access to the supporting topics seperate from the case exercises.
Estimated time to complete:
Includes audio: yes
Required plug-ins:  Flash Flash  RealPlayer RealPlayer  Java Java  Adobe® Reader® Adobe® Reader®
* Plug-in information
Last published on: 2003-10-12
close
|

|
Mesoscale Banded Precipitation
description (click to show/hide) |
Quiz
|
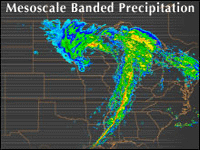 Description: Description:
Precipitation frequently falls and accumulates in discrete bands with accumulations that vary markedly over short distances. This module examines several mechanisms that result in mesoscale banded precipitation, focusing primarily on processes at work in midlatitude cyclones. The module starts with a review of the Norwegian and conveyor belt cyclone models. Then several banding processes are examined in detail, including deformation/frontogenesis, the Trowal (Trough of Warm Air Aloft), frontal merger, CSI/slantwise convection, and melting/evaporation-induced circulations. The module concludes with discussions of the representation of banded precipitation by NWP models and the detection of banded precipitation with satellite sensors.
Objectives:
After completing this module, the learner should be able to do the following things.
With regard to the general features of mesoscale banded precipitation:
* Recall the operational definition of a precipitation band
* Describe the relationship between instantaneous and accumulated bands of precipitation
* Recall the basic requirements for precipitation and the role of atmospheric stability
With regard to the association between midlatitude cyclones and mesoscale banded precipitation:
* Recall and describe the different types of fronts in the Norwegian cyclone model
* Describe the typical precipitation field associated with each kind of front
* Distinguish an anafront from a katafront in forecast products
* Distinguish a cold occluded front from a warm occluded front in forecast products
* Recall and describe the types of air streams in the conveyor belt model of midlatitude cyclones
* Describe the relationship between air streams and fronts
* Describe the relationship between air streams and mesoscale banded precipitation
* Recognize different air streams in satellite images and forecast products
* Recall what a trowal is and where it occurs
* Describe the relationship between the trowal and banded precipitation
* Describe the trowal signature in forecast products
* Locate a trowal on satellite images and forecast products
With regard to processes that lead to mesoscale banded precipitation.
* Define the terms: deformation, frontogenesis, frontolysis
* Describe how deformation leads to frontogenensis
* Describe the vertical motions associated frontogenesis
* Describe how frontogenesis leads banded precipitation
* Recognize and diagnose deformation and frontogenesis in forecast products
* Describe circulations induced by melting and evaporation in the lower tropsphere
* Describe the relationship between melt/evaporation-induced circulations, frontogenesis, and banded precip
* Recognize and diagnose banded precipitation forced by melt/evaporation-induced circulations in forecast products
* Define frontal merger
* Describe the difference between frontal merger and frontal occlusion
* Describe a typical synoptic setting for frontal merger and its relationship with midlatitude cyclones
* Describe the relationship between frontal merger and banded precipitation
* Recognize and diagnose frontal merger in forecast products
* Describe the relationship between CSI and slantwise convection
* Describe the atmospheric conditions conducive to CSI
* Describe what atmospheric conditions lead to low inertial stability
* Recognize and diagnose CSI and slantwise convection with cross-sectional analysis.
With regard to the simulation of mesoscale banded precipitation by NWP models:
* Given the grid spacing determine the grid resolution
* Describe the characteristics of a hydrostatic atmosphere
* State why high-resolution NWP models need to be non-hydrostatic
* Describe the need for parameterization in NWP models
* Describe the pros and cons of parameterization versus explicit treatment of processes
* Describe the difference between prognostic and diagnostic moisture physics and the benefits of each
* Characterize COAMPS and NOGAPS
With regard to the detection of mesoscale banded precipitation by satellite sensors:
* Describe the benefits and drawbacks of satellite estimates of precipitation
* Recall at least 4 satellite sensors that measure precipitation
* Describe the benefits and drawbacks of the GOES Precipitation Index
* Describe the benefits and drawbacks of precipitation estimates derived from microwave sensors
* Describe how a blended precipitation product is derived
Estimated time to complete: 3 h
Includes audio: yes
Required plug-ins:  Flash Flash  RealPlayer RealPlayer  Java Java  Adobe® Reader® Adobe® Reader®
* Plug-in information
Last published on: 2005-06-24
close
|

|
Mesoscale Convective Systems: Squall Lines and Bow Echoes
description (click to show/hide) |
Quiz
|
 Description: Description:
This module presents current conceptual models of several MCS types and provides explanations for the structures and behavior of MCSs based on the physical processes underlying their evolution. An understanding of the physical processes and conceptual models of MCSs will help forecasters to predict the most likely locations of severe weather within existing systems and to forecast the longevity, areal extent, and path of the system.
Accompanied by conceptual animations, numerical simulations, and case studies, Mesoscale Convective Systems: Squall Lines and Bow Echoes presents strategies with which the forecaster can identify the potential for long-lived MCSs and attendant severe weather.
Estimated time to complete: 4-6 h
Includes audio: no
Required plug-ins:  Flash Flash  RealPlayer RealPlayer  Java Java  Adobe® Reader® Adobe® Reader®
* Plug-in information
Last published on: 1999-05-28
close
|

|
Mesoscale Meteorology Effects on Fire Behavior
description (click to show/hide) |
Quiz
|
 Description: Description:
The “Mesoscale Meteorology Effects on Fire Behavior” module reviews the development of thermally forced winds in complex terrain and explores how these winds combine with the effects of terrain to influence fire spread. Three-dimensional conceptual animations illustrate these effects through a 24-hr period, as members of the team working this theoretical fire describe different aspects of weather, fire behavior, and operational fire fighting decisions at specific times during this day. This module is part of the Advanced Fire Weather Forecasters Course.
Objectives:
At the end of this module you should be able to:
1. Describe the effects of thermally forced winds in complex terrain on fire behavior
2. Identify how suppression operations are related to fire and smoke conditions in complex terrain
Estimated time to complete: 30 min
Includes audio: yes
Required plug-ins:  Flash Flash  RealPlayer RealPlayer  Java Java  Adobe® Reader® Adobe® Reader®
* Plug-in information
Last published on: 2008-04-28
close
|

|
Mesoscale Meteorology: A Primer (A Module Collection)
description (click to show/hide) |
No Quiz
|
 Description: Description:
The Primer of Mesoscale Meteorology is a web-based training program designed to improve forecasting of mesoscale weather. The primer is collection of web-based modules that use advanced multimedia features now available over the web, including streaming audio, conceptual animations, and frequent interactions. The courses, or modules, that comprise the primer fall into two types: short conceptual foundation modules and longer, more elaborate modules that address specific mesoscale weather phenomena. The conceptual foundation modules are linked to as appropriate to provide a level of elaboration that might otherwise disrupt the flow of the larger module.
Estimated time to complete:
Includes audio: yes
Required plug-ins:  Flash Flash  RealPlayer RealPlayer  Java Java  Adobe® Reader® Adobe® Reader®
* Plug-in information
Last published on: 2002-01-01
close
|

|
Microwave Remote Sensing Resources
description (click to show/hide) |
Quiz
|
 Description: Description:
This module provides background information on microwave remote sensing with polar-orbiting satellites. It reviews coverage, orbits, and data latency issues of current operational and selected research satellites and notes improvements expected in the NPP and NPOESS era. The module contrasts active vs. passive remote sensing, discusses advantages and limitations of different microwave instrument scanning strategies, and addresses viewing geometry with implications for spatial resolution and swath coverage. Finally, it offers a review of the microwave spectrum and special characteristics of microwave energy important for understanding microwave imagery and derived products. This module takes about 1 hour to complete.
Objectives:
* Describe the orbits and coverage of current polar-orbiting environmental satellites.
* Describe improvements in data latency with the implementation of pipeline processing and the NPOESS SafetyNet© ground system.
* State the differences between active and passive microwave remote sensing.
* Describe crosstrack, conical, and fan beam scanning strategies, the advantages and limitations of each, and their impacts on viewing geometry and spatial resolution.
* Describe the difference between window regions and absorption regions of the electromagnetic spectrum.
* State the relationship between observed microwave energy, sensor field-of-view, and spatial resolution.
* Describe the basic principle of polarization, how it can affect emitted microwave radiation, and its importance for characterizing surface features and atmospheric constituents.
* Describe why water surfaces generally appear relatively cold and land surfaces appear relatively warm in the microwave.
* Describe how passive microwave observations can be used to infer ocean surface wind speed and direction.
* Describe the relationship between dielectric effect, scattering, and emissivity and its importance for microwave remote sensing.
* Name some of the remote sensing applications that rely on the dielectric effect on observed microwave radiation.
Estimated time to complete: 1 h
Includes audio: yes
Required plug-ins:  Flash Flash  RealPlayer RealPlayer  Java Java  Adobe® Reader® Adobe® Reader®
* Plug-in information
Last published on: 2007-04-20
close
|

|
Microwave Remote Sensing: Clouds, Precipitation, and Water Vapor
description (click to show/hide) |
Quiz
|
 Description: Description:
This module provides an introduction to polar-orbiting-satellite-based microwave remote sensing products that depict moisture and precipitation in the atmosphere. The module begins with definitions and descriptions of total precipitable water and cloud liquid water products, contrasting each with more familiar infrared water vapor and window channel products. This is followed by an overview of microwave precipitation estimation and a discussion of how polar-satellite products compare with those from geostationary satellites and ground-based radar. A series of case examples highlights potential weather forecasting applications for total precipitable water and precipitation products. The module also includes an introduction to the Global Precipitation Monitoring Mission to which future NPOESS satellites will be an important contributor. This module takes about 75 minutes to complete.
Objectives:
After completing this module, learners will be able to:
• State the definition of total precipitable water
• State the definition of cloud liquid water
• Describe the difference between window regions and absorption regions of the electromagnetic spectrum
• Describe how precipitation rates are derived over land and ocean
• Describe the goals of the Global Precipitation Monitoring Program
• Interpret total precipitable water, cloud liquid water, and precipitation products presented in case examples
Estimated time to complete: 75 min
Includes audio: yes
Required plug-ins:  Flash Flash  RealPlayer RealPlayer  Java Java  Adobe® Reader® Adobe® Reader®
* Plug-in information
Last published on: 2006-10-06
close
|

|
Microwave Remote Sensing: Land and Ocean Surface Applications
description (click to show/hide) |
Quiz
|
 Description: Description:
This module introduces the concepts and principles basic to retrieving important land and ocean surface properties using microwave remote sensing observations from polar-orbiting satellites. Section one reviews the advantages of microwave remote sensing from polar-orbiting platforms and briefly highlights some of the unique spectral characteristics that allow for differentiation between various surface types and properties. Subsequent sections present a more in-depth look at the derivation and application of microwave products that quantify four different land and ocean surface properties and their characteristics, including snow cover and water equivalent, sea ice, surface wetness and soil moisture, and sea surface temperature. The module reviews both past and current satellite missions and also discusses the future NPOESS constellation that is expected to include a passive microwave sensing capability beginning with the second NPOESS satellite. This module takes about 120 minutes to complete.
Objectives:
After completing this module learners will be able to:
• Describe the benefits of microwave remote sensing for observing various surface properties when compared to visible and infrared approaches
• Describe the key application areas and users that benefit from characterization of snow cover, sea ice, sea surface temperature, and surface wetness and soil moisture
• Understand the basic principles that enable the microwave remote sensing of the various surface properties described in the module
• Describe the limitations common to the retrieval of surface properties covered in the module
• Describe some of the limitations unique to each of the four surface properties covered in the module
• Name the polar-orbiting satellite systems currently available and those planned for future implementation
Estimated time to complete: 2 h
Includes audio: yes
Required plug-ins:  Flash Flash  RealPlayer RealPlayer  Java Java  Adobe® Reader® Adobe® Reader®
* Plug-in information
Last published on: 2008-05-23
close
|

|
Microwave Remote Sensing: Overview
description (click to show/hide) |
Quiz
|
 Description: Description:
This module presents an overview of space-based microwave remote sensing for environmental applications. It provides basic information on polar-orbiting satellite characteristics, current microwave instruments, and the imagery and products currently available from these sensors. Special attention is given to the improvements expected in the NPOESS era. This module is an introduction to other, more in-depth modules covering the science and application of cloud, precipitation, water vapor, land and sea surface observations.
Objectives:
- Describe how microwave remote sensing compliments visible and infrared observations
- Describe the general spatial and temporal coverage characteristics of microwave observations from polar-orbiting satellites
- Define data latency and explain why it occurs
- Describe the improvements to data latency coming in 2006, and then in the NPOESS era
- List several products that rely on microwave remote sensing
- Explain the fundamental difference between active versus passive remote sensing
- State the six “key” NPOESS Environmental Data Records (EDRs) considered essential to weather and climate monitoring and prediction
- Describe the importance and impact of microwave observations on numerical weather prediction models
- State the key differences between microwave and radiosonde sounding of atmospheric temperature and moisture
- Describe radio frequency interference as it relates to microwave observations, its geographical distribution, and potential impact on products
Estimated time to complete: 40 min
Includes audio: yes
Required plug-ins:  Flash Flash  RealPlayer RealPlayer  Java Java  Adobe® Reader® Adobe® Reader®
* Plug-in information
Last published on: 2006-04-03
close
|

|
Model Fundamentals
description (click to show/hide) |
Quiz
|
 Description: Description:
Model Fundamentals, part of the Numerical Weather Prediction Professional Development Series and the NWP Distance Learning Course, describes the components of an NWP model and how they fit into the forecast development process. It also explores why parameterization of many physical processes is necessary in NWP models.
The module covers background concepts and terminology necessary for learning from the other modules in this series on NWP.
The subject matter expert for this module is Dr. Ralph Petersen of the National Centers for Environmental Prediction, Environmental Modeling Center (NCEP/EMC).
Estimated time to complete: 1 h
Includes audio: no
Required plug-ins:  Flash Flash  RealPlayer RealPlayer  Java Java  Adobe® Reader® Adobe® Reader®
* Plug-in information
Last published on: 1999-06-01
close
|

|
Mountain Waves and Downslope Winds
description (click to show/hide) |
Quiz
|
 Description: Description:
Mountain waves form above and downwind of topographic barriers and frequently pose a serious hazard to mountain aviation because of strong-to-extreme turbulence. This foundation module describes the features of mountain waves and explores the conditions under which they form. Like other foundation modules in the Mesoscale Primer, this module starts with a forecast scenario and concludes with a final exam. Rich graphics, audio narration, and frequent interactions enhance the presentation.
Objectives:
After completing this module, the learner should be able to do the following things.
With regard to the hazards, features, and climatology of mountain waves and downslope winds:
* Identify at least 2 hazards associated with mountain wave activity
* Recall at least 3 atmospheric and topographic requirements for a mountain wave system
* Describe the major features of a mountain wave system
* Recall when and where mountain waves and downslope winds occur
* Recall the location of the following winds: Chinook, Santa Ana, Bora, and Foehn
With regard to downslope winds:
* Recall characteristics of downslope winds
* Describe why downslope winds are warm
With regard to the origin of mountain waves and downslope winds:
* Describe why air displaced over a mountain range starts to oscillate
* Recall the conditions that lead to topographically-blocked flow in terms of mountain height, wind speed, stability, and Froude number
* Describe the effects of wind shear and inversions on mountain wave activity
* Define critical level
* Discriminate between a self-induced critical level and a mean-state critical level
* Describe the different types of rotors and their associated atmospheric conditions
* Identify which type of rotor is associated with more turbulence
With regard to forecasting mountain waves and downslope winds:
* Recall the 1.6 rule-of-thumb
* Recall what NWP model resolution is required to accurately depict mountain waves
* Describe how a model's vertical coordinate system affects its ability to forecast mountain waves
* Describe how radiosondes and pilot reports (PIREPs) can help with short-range forecasting of mountain waves
* Describe how satellite imagery can be used to detect mountain wave activity with or without either daylight or clouds
Estimated time to complete: 2-3 h
Includes audio: yes
Required plug-ins:  Flash Flash  RealPlayer RealPlayer  Java Java  Adobe® Reader® Adobe® Reader®
* Plug-in information
Last published on: 2004-01-07
close
|

|
Multispectral Satellite Applications: Monitoring the Wildland Fire Cycle
description (click to show/hide) |
Quiz
|
 Description: Description:
This module describes current and future satellite instruments and products used for monitoring the fire cycle, with an emphasis on polar-orbiting satellites. Product information is presented in the context of the fire cycle: from assessing the pre- and post-fire environment to detecting and monitoring active fires, smoke, and aerosols. Product information is also consolidated in the Fire Product Suite, available in the module and as a PDF file. The module concludes with an interactive fire case study, supplemented with observations from a National Weather Service forecaster who experienced the fire. The module is intended for a wide range of users involved with wildfire detection and monitoring, including land use managers, hydrologists, weather forecasters, and researchers.
Objectives:
* Demonstrate the advantages and limitations of using multi-sensor multispectral analysis for monitoring the fire cycle.
* Describe some of the remote sensing products and systems used for detecting and monitoring the wildland fire cycle. For each product, identify its capabilities, limitations, and applications.
* Identify the common thermal emission regions used to detect fires in both polar-orbiting and geostationary satellites.
* Identify the capabilities and limitations of geostationary vs. polar-orbiting satellites, shortwave vs. longwave imagery, and true vs. false color products in detecting and monitoring the fire cycle.
* Identify the essential steps in automated and semi-automated smoke forecasting.
* Identify the capabilities of the upcoming NPOESS VIIRS sensor with regard to the fire cycle.
Estimated time to complete: 1.5 – 2 h
Includes audio: yes
Required plug-ins:  Flash Flash  RealPlayer RealPlayer  Java Java  Adobe® Reader® Adobe® Reader®
* Plug-in information
Last published on: 2007-11-14
close
|

|
NexSat: Preparing Users for the NPOESS/VIIRS Era
description (click to show/hide) |
No Quiz
|
 Description: Description:
This Webcast, NexSat: Preparing Users for the NPOESS/VIIRS Era, describes the NexSat Website (http://www.nrlmry.navy.mil/nexsat_pages/nexsat_home.html), a public educational resource provided by the Naval Research Laboratory and the Integrated Program Office. The NexSat Website offers near real-time access to polar-orbiting satellite imagery and derived products over the lower 48 states and Hawaii from several research and operational satellites. Model data from FNMOC and data from the National Lightning Detection Network are also accessible from the site. Additionally, the wide variety of imagery and derived products available from current polar-orbiting satellites and previews the capabilities of the VIIRS instrument on NPP and NPOESS are also highlighted. In many cases VIIRS will provide the same imagery and derived products at significantly higher spatial and temporal resolution. This tour takes about 8 minutes to complete.
Estimated time to complete: 8 min
Includes audio: yes
Required plug-ins:  Flash Flash  RealPlayer RealPlayer  Java Java  Adobe® Reader® Adobe® Reader®
* Plug-in information
Last published on: 2005-05-06
close
|

|
North Wall Effects on Winds and Waves
description (click to show/hide) |
Quiz
|
 Description: Description:
North Wall events refer to high wind and wave events that occur along the north edge of warm, fast, western boundary currents. These events occur along the Gulf Stream off the mid-Atlantic states of the U.S. and along the Kuroshio Current near Japan and Taiwan. This module explores the relationships between atmospheric stability, winds, waves, and ocean currents during North Wall events. Using three different case studies, we examine the relevant aspects of several topics, including the synoptic setting, ocean currents, evolution of the marine boundary layer, growth of ocean waves, and potential wave-current interactions.
Objectives:
After completing the module, you should be able to do the following:
With regard to Synoptic conditions:
* Identify the synoptic weather pattern that may result in a North Wall event.
* Identify the oceanographic setting that favors a North Wall event.
With regard to the marine boundary layer (MBL):
* Describe the evolution of the MBL during a cold season North Wall event.
* Describe the evolution of the MBL during warm and cold air advection.
* Describe the synoptic and oceanographic conditions that lead to an unstable MBL.
With regard to winds in the MBL:
* Describe how the SST-air temperature difference affects MBL stability.
* Describe how MBL stability affects wind speeds at the surface.
* Describe why NWP models may have difficulty forecasting accurate surface wind speeds during a North Wall event.
With regard to ocean waves during a North Wall event:
* List the 3 basic factors that contribute to wave growth.
* Assess the reliability of a model wave forecast using a wave nomogram.
* Assess the reliability of a model wave forecast using ship and buoy observations.
With regard to wave-current interactions:
* Describe the wave-current interactions that increase wave heights.
* Estimate the changes to swell that occur when it runs into an opposing current.
* Describe how waves refract in the presence of current loops and meanders.
* Describe conditions leading to rogue waves.
Estimated time to complete: 3-3.5 h
Includes audio: yes
Required plug-ins:  Flash Flash  RealPlayer RealPlayer  Java Java  Adobe® Reader® Adobe® Reader®
* Plug-in information
Last published on: 2008-09-09
close
|

|
NPOESS: The Next Generation Polar-orbiting Operational Environmental Satellite Program
description (click to show/hide) |
No Quiz
|
 Description: Description:
On 6 June 2006 NPOESS sponsoring agencies announced that the NPOESS Program is being restructured to meet the recommendations contained in the Nunn-McCurdy certification report to Congress. As a result the outdated Webcast, “NPOESS: The Next Generation Polar-orbiting Operational Environmental Satellite Program,” is no longer available.
Estimated time to complete:
Includes audio: no
Required plug-ins:  Flash Flash  RealPlayer RealPlayer  Java Java  Adobe® Reader® Adobe® Reader®
* Plug-in information
Last published on: 2003-10-06
close
|

|
NWS Support During Hazardous Materials Emergencies
description (click to show/hide) |
Quiz
|
 Description: Description:
NWS Support During Hazardous Materials Emergencies will help forecasters develop operational competence with atmospheric dispersion support by teaching:
1. What types of weather data inputs are required for the short-range dispersion models typically used by emergency managers
2. What types of weather data inputs are required for the medium- and long-range dispersion models run by outside agencies (that is, not by the emergency managers themselves)
3. What required and supplemental data inputs should or can be supplied to NCEP Central Operations for special HYSPLIT runs
4. The types and scales of events that are appropriate and inappropriate for modeling by NCEP's HYSPLIT model
5. What key uncertainties can cause misleading dispersion model forecasts
6. The processes and limitations of CAMEO/ALOHA and HYSPLIT, the main two dispersion models NWS forecasters will likely have contact with on the job
7. How to read and interpret CAMEO/ALOHA and HYSPLIT output
Objectives:
The following learning objectives specifically addressed by this module were extracted from the above document:
1.1.3 Emergency management officers will know what types of information and services can be provided by NWS offices during hazardous release events.
1.4 Forecasters will know what types of weather data inputs are required for short-range dispersion modeling software (CAMEO/ALOHA) typically used by emergency managers.
1.5 Forecasters will know what required and supplemental data inputs should/can be supplied to NCEP Central Operations for special HYSPLIT runs.
2.1.1 Forecasters will be able to distinguish between short and medium/long-range release events.
2.1.2 Forecasters will be able to describe the overlap zone between short and medium/long-range models, where both should be consulted and compared.
2.2 Forecasters will be able to describe the range of temporal and spatial scales for which HYSPLIT is appropriate.
2.3 Forecasters will be able to identify events and release types that are inappropriate for HYSPLIT.
3.1 Forecasters will be able to state or list the key uncertainties that can cause misleading dispersion model forecasts.
4.2 Forecasters will be able to explain (in simple terms) the processes and limitations associated with basic gaussian dispersion models such as ALOHA.
4.3 Forecasters will be able to explain (in simple terms) the processes and limitations associated with more complex transport and dispersion models such as HYSPLIT.
4.4 Forecasters will be able to explain the significance of the different confidence contours and possible countour shapes (oblong, oval, circular) plotted by CAMEO-ALOHA.
4.5 Given a normalized concentration plot and a set of recommended concentration hazard thresholds, forecasters will be able to explain how to convert normalized concentrations to actual concentrations.
4.6 Given HYSPLIT output, forecasters will be able to identify and interpret concentration, exposure, and deposition results.
Estimated time to complete: 2-3 h
Includes audio: yes
Required plug-ins:  Flash Flash  RealPlayer RealPlayer  Java Java  Adobe® Reader® Adobe® Reader®
* Plug-in information
Last published on: 2004-09-28
close
|

|
Ocean Effect Snow: New England Snow Storm, 14 January 1999
description (click to show/hide) |
Quiz
|
 Description: Description:
This case study is the first in the Mesoscale Aspects of Winter Weather Forecasting module series. The case is presented as a series of challenging forecast questions followed by a more traditional case study presentation. Included in the exercise is a rich set of data products and a series of background materials on lake/ocean effect snow and winter microphysics processes.
Objectives:
• Recognize the necessary synoptic precursors for an ocean effect snow
event off the east coast of New England and Atlantic Canada.
• Identify the mesoscale factors that lead to the establishment of ocean effect snow bands.
• Recognize ocean effect snow bands from satellite and radar
displays.
• Recognize the potential for enhancement and eventual dissipation of ocean
effect snow bands with the changing synoptic conditions.
Estimated time to complete: 1-2 h
Includes audio: yes
Required plug-ins:  Flash Flash  RealPlayer RealPlayer  Java Java  Adobe® Reader® Adobe® Reader®
* Plug-in information
Last published on: 2003-05-29
close
|

|
Operational Models Matrix: Characteristics of Operational NWP Models
description (click to show/hide) |
No Quiz
|
 Description: Description:
Operational Models Matrix: Characteristics of Operational NWP Models, part of the Numerical Weather Prediction Professional Development Series, contains information about the characteristics and architecture of commonly used operational models, their operationally significant strengths and weaknesses, and model assessment tools. The information is updated whenever significant model changes are made.
The module is linked to the Impact of Model Numerics on Weather Depiction module (also in the NWP PDS), which provides background information about model components.
The subject matter expert for this module is Dr. Ralph Petersen of the National Centers for Environmental Prediction, Environmental Modeling Center (NCEP/EMC).
Estimated time to complete: 3-5 h
Includes audio: no
Required plug-ins:  Flash Flash  RealPlayer RealPlayer  Java Java  Adobe® Reader® Adobe® Reader®
* Plug-in information
Last published on: 2007-10-19
close
|

|
Operational Satellite Derived Tropical Rainfall Potential (TRaP)
description (click to show/hide) |
Quiz
|
 Description: Description:
The COMET Program and the Integrated Program Office are pleased to announce the publication of The Operational Tropical Rainfall Potential (TRaP) module. This module, developed by Sheldon Kusselson (Satellite Analysis Branch, NESDIS), traces the development of the present TRaP product and shows numerous examples from recent hurricane seasons comparing model precipitation forecast amounts, TRaP estimated rainfall amounts, and observed rainfall. Guidelines for using the TRaP product and future improvements are presented at the conclusion of the module.
Objectives:
• State the basis of the TRaP technique, its formulation, and inputs
• State the assumptions and the limitations of the technique
• Find and access TRaP products on the Internet
• Interpret TRaP imagery for use in precipitation estimation
Estimated time to complete: 1 h
Includes audio: yes
Required plug-ins:  Flash Flash  RealPlayer RealPlayer  Java Java  Adobe® Reader® Adobe® Reader®
* Plug-in information
Last published on: 2004-04-19
close
|

|
PBL in Complex Terrain - Part 1
description (click to show/hide) |
Quiz
|
 Description: Description:
This is part 1 of a 2-part Webcast based on a presentation by Dr. David Whiteman on August 11, 2004 in Boulder, CO. Dr. Whiteman presents conceptual and practical information regarding winds in the planetary boundary layer in complex terrain. Part 1 topics include diurnal wind systems, mountain-plain wind systems, and slope wind systems.
Objectives:
- Identify the characteristics of diurnal wind systems
- Identify the characteristics of mountain-plain wind systems
- Identify the characteristics of slope wind systems
Estimated time to complete: 1 h
Includes audio: yes
Required plug-ins:  Flash Flash  RealPlayer RealPlayer  Java Java  Adobe® Reader® Adobe® Reader®
* Plug-in information
Last published on: 2007-03-22
close
|

|
PBL in Complex Terrain - Part 2
description (click to show/hide) |
Quiz
|
 Description: Description:
This is part 2 of a 2-part Webcast based on a presentation by Dr. David Whiteman on August 11, 2004 in Boulder, CO. Dr. Whiteman presents conceptual and practical information regarding winds in the planetary boundary layer in complex terrain. Part 2 topics include valley wind systems, cross-valley wind systems, diurnal mountain-wind systems, and plateau-basin wind systems.
Objectives:
- Identify the characteristics of valley wind systems
- Identify the characteristics of cross-valley wind systems
- Identify the characteristics of diurnal mountain-wind systems
- Identify the characteristics of plateau-basin wind systems
Estimated time to complete: 75 min
Includes audio: yes
Required plug-ins:  Flash Flash  RealPlayer RealPlayer  Java Java  Adobe® Reader® Adobe® Reader®
* Plug-in information
Last published on: 2007-04-06
close
|

|
Physics of the Aurora: Earth Systems
description (click to show/hide) |
Quiz
|
 Description: Description:
This interactive learning module introduces the systems and processes through which the Earth's magnetic field and upper atmosphere are influenced by the sun, eventually leading to the magnificent auroral displays. Developed especially for university professors and students in the fields of physics and astronomy, this module includes sections on the history, lore, and science of the aurora, the magnetosphere, the thermosphere-ionosphere, basic electromagnetism, and upper-atmospheric physics.
Estimated time to complete: 2-6 h
Includes audio: yes
Required plug-ins:  Flash Flash  RealPlayer RealPlayer  Java Java  Adobe® Reader® Adobe® Reader®
* Plug-in information
Last published on: 2004-12-28
close
|

|
Polar Lows Ungava Bay 01 December 2000
description (click to show/hide) |
No Quiz
|
 Description: Description:
Polar lows are generally short-lived but intense events that occur over cold ocean waters, poleward of a baroclinic zone. The polar low in this case formed over the open waters of Ungava Bay, in northeastern Canada, on 2 December 2000. The case is presented as a series of challenging forecast questions followed by a more traditional case study presentation. Included in this exercise is a rich set of data products and access to background materials on polar low forecasting.
Objectives:
1. Recognize the synoptic scale precursors of polar lows
2. Recognize the low-level surface features that are conducive to the development of polar lows
3. Recognize the development of a polar low from observations. Identify polar lows using satellite imagery
4. Understand the limitations of model initialization and output for polar low forecasting
5. Apply understanding of polar low steering mechanisms to a tracking forecast
Estimated time to complete: 1-2 h
Includes audio: yes
Required plug-ins:  Flash Flash  RealPlayer RealPlayer  Java Java  Adobe® Reader® Adobe® Reader®
* Plug-in information
Last published on: 2004-04-02
close
|

|
Polar Satellite Products for the Operational Forecaster (POES) Module 1: POES Introduction
description (click to show/hide) |
Quiz
|
 Description: Description:
This Web-based module is a component of the Integrated Sensor Training (IST) Professional Development Series (PDS) Professional Competency Unit #6-Satellite Data and Products. Dr. Stan Kidder of the Cooperative Institute for Research in the Atmosphere (CIRA) at Colorado State University is the principal science advisor for this module with significant assistance from Dr. Gary Hufford (NWS Alaska Region). The module provides an overview of current polar satellite products and their applications in forecasting situations and also contains a summary of instruments currently in use and a short history of the U.S. polar satellite program. The module is the first in a series focusing on polar satellite products and applications.
Objectives:
• Describe polar satellite orbits
• List channels available from AVHRR on NOAA polar-orbiting satellites
• Describe multispectral imagery products for fog/stratus detection, volcanic ash detection, fire detection, and precipitation products
Estimated time to complete:
Includes audio: no
Required plug-ins:  Flash Flash  RealPlayer RealPlayer  Java Java  Adobe® Reader® Adobe® Reader®
* Plug-in information
Last published on: 1999-03-25
close
|

|
Polar Satellite Products for the Operational Forecaster (POES) Module 2: Microwave Products and Applications
description (click to show/hide) |
Quiz
|
 Description: Description:
This Web-based module is a component of the Integrated Sensor Training (IST) Professional Development Series (PDS) Professional Competency Unit #6-Satellite Data and Products. This module provides a closer look at the capabilities, products, and applications available to operational weather forecasting with the present suite of microwave instruments onboard both NOAA and DMSP satellites. If you wish, you may launch the module from this page.
Objectives:
• Identify the primary products available from current operational microwave sensors
• Compare and contrast the advantages and limitations of conical and cross-track scanning
• Describe the differences between ascending and descending satellite passes
• State the limitations of microwave data near coastlines
• Describe the differences in how emission and scattering channels sense microwave energy
• Compare and contrast TPW and CLW
• State the reason that TPW and CLW can’t be retrieved over land
• State the key advantage of microwave instruments over visible/infrared instruments
Estimated time to complete: 1-2 h
Includes audio: no
Required plug-ins:  Flash Flash  RealPlayer RealPlayer  Java Java  Adobe® Reader® Adobe® Reader®
* Plug-in information
Last published on: 1999-07-23
close
|

|
Polar Satellite Products for the Operational Forecaster (POES) Module 3: Case Studies
description (click to show/hide) |
No Quiz
|
 Description: Description:
POES 3: Case Studies contains two short case study examples that demonstrate different uses of polar satellite data. The first case example shows how AMSU microwave data can be used to supplement other datasets to improve precipitation forecasts. The second case example demonstrates the TRaP method for calculating rainfall from Hurricane Georges.
Objectives:
• State the advantages of using microwave data for precipitation forecasting
• Describe the method for comparing NWP forecasts with microwave moisture information
• Compare and contrast the information from GOES water vapor imagery with information from microwave TPW as it relates to Case 1.
• Describe the TRaP product
Estimated time to complete: 1-2 h
Includes audio: no
Required plug-ins:  Flash Flash  RealPlayer RealPlayer  Java Java  Adobe® Reader® Adobe® Reader®
* Plug-in information
Last published on: 1999-12-10
close
|

|
Polar Satellite Products for the Operational Forecaster (POES) Module 4: Soundings
description (click to show/hide) |
No Quiz
|
 Description: Description:
This module describes the different sounding products available from NOAA polar-orbiting satellites. The module provides guidance on integrating POES sounding data more effectively with observations from other platforms to improve operational forecasting activities. The ability to derive soundings in cloudy conditions increases the value of this data to operational forecasters. Forecasters with responsibilities outside the CONUS will also be able to use the global coverage that POES sounders offer.
Objectives:
• State the advantages of POES soundings over RAOB soundings
• Compare and contrast POES and GOES soundings
• Identify products currently generated and supported for operational use by NOAA’s sounding retrieval system
• State the spatial characteristics of ATOVS for moisture and temperature retrievals
• Describe how POES sounding retrievals compliment GOES and RAOB soundings
Estimated time to complete: 1-2 h
Includes audio: no
Required plug-ins:  Flash Flash  RealPlayer RealPlayer  Java Java  Adobe® Reader® Adobe® Reader®
* Plug-in information
Last published on: 2000-05-22
close
|

|
Polar Satellite Products for the Operational Forecaster: Microwave Analysis of Tropical Cyclones
description (click to show/hide) |
Quiz
|
 Description: Description:
This module introduces forecasters to the use of microwave image products for observing and analyzing tropical cyclones. Microwave data from polar-orbiting satellites is crucial to today’s operational forecasters, and particularly for those with maritime forecasting responsibilities where in situ observations are sparse. This module includes information on storm structure and techniques for improved storm positioning using the 37 and 85-91 GHz channels from several satellite sensors. Information on current sensors and on the product availability in the NPOESS era is also presented.
Objectives:
• Explain how single channel and multispectral microwave imagery can be used to locate centers of circulation and other features within tropical cyclones
• Explain how parallax error affects imagery from different microwave channels
• Identify satellites that carry microwave imagers and sounders
• Contrast active and passive microwave remote sensing strategies
• Contrast conical and cross-track scanning strategies
• Explain how clouds, precipitation, and the ocean surface interact with microwave
energy at different frequencies
• Associate storm characteristics with features observed in microwave imagery
Estimated time to complete: 60 min
Includes audio: yes
Required plug-ins:  Flash Flash  RealPlayer RealPlayer  Java Java  Adobe® Reader® Adobe® Reader®
* Plug-in information
Last published on: 2004-11-10
close
|

|
Precipitation Type: New Brunswick, 01-03 February 2003
description (click to show/hide) |
Quiz
|
 Description: Description:
This interactive case exercise covers a 24-hour forecast period that
includes the challenge of precipitation type forecasting. The case
exercise provides an overview of precipitation type forecasting based on
model algorithms, partial thickness analysis, and the top-down method.
Objectives:
• Understand the limitations of NWP models in precipitation type forecasts.
• Apply partial thickness analysis for forecasting precipitation type.
• Apply the top-down Method for forecasting precipitation type.
Estimated time to complete: 27-90 min
Includes audio: yes
Required plug-ins:  Flash Flash  RealPlayer RealPlayer  Java Java  Adobe® Reader® Adobe® Reader®
* Plug-in information
Last published on: 2005-09-27
close
|

|
Predicting Supercell Motion Using Hodograph Techniques
description (click to show/hide) |
Quiz
|
 Description: Description:
This Webcast features NWS forecaster Matthew J. Bunkers presenting the results of a study originally presented at the 19th AMS Conference on Severe Local Storms and published in the February 2000 issue of the AMS journal Weather and Forecasting. It is delivered as a streaming audio lesson with accompanying text and graphics.
In this presentation Mr. Bunkers presents a statistically superior method for predicting supercell motion regardless of the shape or location of the shear profile on the hodograph plot. The method is a modification of the method presented by Dr. Morris Weisman in the COMET Program CD module, Anticipating Convective Storm Structure and Evolution, and was developed based on 225 actual supercell events.
Estimated time to complete: 30 min
Includes audio: yes
Required plug-ins:  Flash Flash  RealPlayer RealPlayer  Java Java  Adobe® Reader® Adobe® Reader®
* Plug-in information
Last published on: 1999-06-10
close
|

|
Principles of Convection I: Buoyancy and CAPE
description (click to show/hide) |
Quiz
|
 Description: Description:
This module provides a brief overview of Buoyancy and CAPE. Topics covered include the origin of atmospheric buoyancy, estimating buoyancy using the CAPE and Lifted Index, factors that affect buoyancy including entrainment of mid-level air, water loading, convective inhibition, and the origin of convective downdrafts. This module delivers instruction with audio narration, rich graphics, and a companion print version.
Objectives:
Terminal Objectives
By the end of this module you will be able to do the following:
1. Describe how buoyancy contributes to formation of a convective storm and its related updrafts and downdrafts
2. Define CAPE, LI, and CIN and describe how they can be used to forecast convective activity
Enabling Objectives
By the end of this module you will be able to do the following:
1. Define buoyancy and list factors that tend to increase buoyancy
2. Describe the life cycle of a convective storm
3. Define CAPE and describe how CAPE is determined on a skew-T/log-P diagram
4. Define Lifted Index (LI) and describe how LI is determined on a skew-T/log-P diagram
5. Describe how CAPE differs from Lifted Index
6. Define Convective Inhibition (CIN) and list factors that tend to increase CIN
7. Given 2 soundings, choose the soundings that will give the stronger updraft or downdraft
Estimated time to complete: 1 h
Includes audio: yes
Required plug-ins:  Flash Flash  RealPlayer RealPlayer  Java Java  Adobe® Reader® Adobe® Reader®
* Plug-in information
Last published on: 2002-07-24
close
|

|
Principles of Convection II: Using Hodographs
description (click to show/hide) |
Quiz
|
 Description: Description:
This module provides a basic understanding of how to plot and interpret hodographs, with application to convective environments. Most of the material previously appeared in the CD module, Anticipating Convective Storm Structure and Evolution, developed with Dr. Morris Weisman. Principles of Convection II: Using Hodographs includes a concise summary for quick reference and a final exam to test your knowledge. The module comes with audio narration, rich graphics, and a companion print version.
Objectives:
Terminal Objectives
1. By the end of this module you will be able to plot and use a hodograph to determine wind shear
Enabling Objectives
By the end of this module you will be able to do the following:
1. Given a vertical profile of wind speed and direction, plot a hodograph on a polar coordinate chart
2. Describe how to use a hodograph to determine the vertical wind shear between two levels
3. Given a hodograph, determine the total magnitude of vertical wind shear, the mean shear direction, and the mean wind and storm motion from a hodograph
Estimated time to complete: 60 min
Includes audio: yes
Required plug-ins:  Flash Flash  RealPlayer RealPlayer  Java Java  Adobe® Reader® Adobe® Reader®
* Plug-in information
Last published on: 2003-10-28
close
|

|
Principles of Convection III: Shear and Convective Storms
description (click to show/hide) |
Quiz
|
 Description: Description:
This module discusses the role of wind shear in the structure and evolution of convective storms. Using the concept of horizontal vorticity, the module demonstrates how shear enhances uplift, leading to longer-lived supercell and multicell storms. The module also explores the role of shear in the development of mesoscale convective systems, including bow echoes and squall lines. Most of the material in this module previously appeared in the COMET modules developed with Dr. Morris Weisman. This version includes a concise summary for quick reference and a final exam to test your knowledge. The module comes with audio narration, rich graphics, and a companion print version.
Objectives:
Terminal Objectives
By the end of this module you will be able to describe the influence that vertical wind shear has on convective storm behavior
Enabling Objectives
By the end of this module you will be able to do the following:
1. Describe how and where interaction between a thunderstorm outflow (the cold pool) and the environmental wind shear lead to enhanced uplift and formation of new convective cells
2. Describe the vertical wind shear conditions that maximize the uplift along the downshear edge of the cold pool
3. Describe the origin of updraft tilt in a convective cell
4. Describe the different vertical shear characteristics for supercell storms and mesoscale convective systems (MCSs)
Estimated time to complete: 60 min
Includes audio: yes
Required plug-ins:  Flash Flash  RealPlayer RealPlayer  Java Java  Adobe® Reader® Adobe® Reader®
* Plug-in information
Last published on: 2003-11-18
close
|

|
Quantitative Precipitation Forecasting Overview
description (click to show/hide) |
Quiz
|
 Description: Description:
In this module, Wes Junker, retired Senior Branch Forecaster at NCEP/HPC provides an introduction to Quantitative Precipitation Forecasting, as well as two presentations targeted at QPF issues for the conterminous U.S. (1) east of the Rockies and (2) in and west of the Rockies.
Objectives:
Introduction
1. Recall the three main factors to use when composing a QPF.
2. Explain which meteorological factors affect the quantitative part of QPF.
3. Identify meteorological factors that affect precipitation intensity.
4. Apply pattern recognition skills for anticipating precipitation.
5. Anticipate the influences to QPF from both synoptic and mesoscale processes.
6. Use soundings and the associated instability measures in QPFs.
7. Explain the mechanisms of cell movement and propagation.
8. Identify important impacts on QPF from propagation characteristics.
9. Anticipate how jet dynamics may influence precipitation amount and distribution.
10. Understand some of the unique aspects of tropical systems when composing QPF.
East and West of the Rockies
1. Understand the meteorological processes that occur with the Maddox type events (synoptic, frontal, mesohigh, western types).
2. Recall the climatology of heavy rainfall events for your area.
3. Explain how theta-e is used in forecasting heavy precipitation.
4. Anticipate how terrain impacts heavy precipitation events.
5. Recall the general differences between warm- and cool-season QPF.
Estimated time to complete: 120 min
Includes audio: yes
Required plug-ins:  Flash Flash  RealPlayer RealPlayer  Java Java  Adobe® Reader® Adobe® Reader®
* Plug-in information
Last published on: 2007-11-01
close
|

|
Radiation Fog
description (click to show/hide) |
Quiz
|
 Description: Description:
This module presents the physical processes and life cycle of radiation fog, including its preconditioning environment, initiation, growth, and dissipation. The processes include radiation (both solar and longwave), soil-atmosphere thermal interactions, turbulent mixing, the roles of condensation nuclei, and droplet settling. Each section includes a set of interactive questions based on the learning content presented.
Tom Dulong of the National Weather Service Center Weather Service Unit (CWSU) in Longmont, Colorado is the Principal Science Advisor for this module, and Dr. Paul Croft, Meteorology Program Coordinator for Jackson State University, provided additional scientific review and guidance.
Objectives:
The goal of this training module is to help you increase your understanding of how radiation fog forms, grows, and dissipates. Such understanding, in turn, can help you more efficiently and accurately evaluate the ability of a given atmospheric environment to generate and/or maintain radiation fog.
Performance Objectives
With Regard to the Preconditioning Environment:
• Identify key conditions and ingredients necessary for development of radiation fog
• Discriminate between large-scale low-level environments that are favorable and unfavorable for development of radiation fog
• Describe the sequence of key surface and boundary-layer processes that prepare the low-level environment for development of radiation fog
• Demonstrate an understanding of how surface cooling dries the micro-boundary layer and prevents low-level condensation from being deposited onto the surface
• Rank various surface and surface cover types in terms of the relative speed with
which low-level air in contact with them will reach saturation
With Regard to Initiation and Growth:
• Identify levels at which radiative cooling is most active at various stages of the fog initiation and growth process
• Demonstrate an understanding of the effects that various condensation nuclei types and concentrations have on fog formation
• Sequence the key processes and events that occur during formation of a layer of radiation fog
• Demonstrate an understanding of how the fog-top inversion is created by the fog itself
• Demonstrate an understanding of influences that heat flux from the surface have on a fog layer during its initiation and growth.
With Regard to Maintenance Phase:
• Describe key processes that balance one another to allow a fog layer to maintain a relatively constant depth.
• Identify conditions in and above a fog-top layer that support continued condensate production
• Identify conditions in and above a fog-top layer that restrict further deepening
• Demonstrate an understanding of the effects that various condensation nuclei types and concentrations have on fog maintenance
• Demonstrate an understanding of the effects that introduction of an overlying cloud layer have on a mature fog layer at the surface
• Demonstrate an understanding of influences that heat flux from the surface have on a mature fog layer
• Identify the typical level of a fog-top inversion
• Demonstrate an understanding of how the fog-top inversion is maintained by various processes at and above the top of the fog layer
With Regard to Dissipation Phase:
• Identify key processes that contribute to the dissipation of a fog layer
• Apply a droplet settling rate calculation to predict the time required for a given depth of fog layer to settle to the ground in the absence of any new condensate production
• Demonstrate an understanding of how radiative heating contributes to dissipation of a fog layer
• Demonstrate an understanding of how turbulent mixing contributes to dissipation of a fog layer
• Demonstrate an understanding of how changes in low-level winds can contribute to dissipation of a fog layer
• Demonstrate an understanding of how introduction of an overlying cloud layer can contribute to dissipation of a fog layer
Estimated time to complete: 1-2 h
Includes audio: yes
Required plug-ins:  Flash Flash  RealPlayer RealPlayer  Java Java  Adobe® Reader® Adobe® Reader®
* Plug-in information
Last published on: 1999-12-10
close
|

|
Rain Gauges: Are They Really Ground Truth?
description (click to show/hide) |
Quiz
|
 Description: Description:
It is the first streaming video Webcast released by the COMET Program. This interactive and entertaining presentation serves as a helpful reminder of the problems that can plague rain gauge performance including specifics regarding the widely used ASOS rain gauge. The material is suitable for anyone who deploys gauges or routinely uses precipitation gauge data.
A version of this Webcast that can be installed on your computer for local playback is also provided.
Estimated time to complete: 40 min
Includes audio: yes
Required plug-ins:  Flash Flash  RealPlayer RealPlayer  Java Java  Adobe® Reader® Adobe® Reader®
* Plug-in information
Last published on: 2001-02-05
close
|

|
Real-Time Mesoscale Analysis (RTMA): What is the NCEP RTMA and how can it be used?
description (click to show/hide) |
Quiz
|
 Description: Description:
The NCEP Real-Time Mesoscale Analysis (RTMA), provides current conditions in digital form on the NWS National Digital Forecast Database (NDFD) 5-km grid. This product was upgraded in early July 2007 to the point where its use by forecast offices is now encouraged for situational awareness, creating short-term forecast grids, and evaluating recent forecast grids and forecast bias. Unique to the RTMA is an uncertainty or error estimate for some of its analysis parameters. These uncertainty estimates perhaps could be used to determine when a forecast is “good enough”. This Webcast discusses why the RTMA and its parent project, the Analysis of Record, were created, how the RTMA is generated, and its capabilities, limitations, and possible applications. The Webcast includes extensive discussion about how representative individual observations are and how they are handled by the analysis. The topics covered include:
* The context for developing the RTMA and related future developments
* Use of the RTMA in the human forecast process
* The steps in generating RTMA products: forecast, downscaling, observation data sets, quality control, two-dimensional variational analysis (2d-var), “uncertainty” estimates, multisensor precipitation analysis, and GOES Effective Cloud Amount
* Limitations related to how RTMA products are generated
* How an observation affects the 2d-var analysis
* Issues raised by the analysis using accurate observations which are not representative of their surrounding area
* Preliminary performance assessment over complex terrain
* Key changes under development for future RTMA implementations
Objectives:
- Big picture - Understand why RTMA was created and how it fits into the Analysis of Record project
- Be able to apply RTMA in your forecast operations
- Be aware of which data types are used/not-used
- Recognize that a perfect analysis should not exactly fit observations
- Be familiar with what products exist
- Be familiar with how the products are made and therefore understand their capabilities and limitations
- Be aware of how future changes already under development will affect the RTMA product suite
Estimated time to complete: 1 h
Includes audio: yes
Required plug-ins:  Flash Flash  RealPlayer RealPlayer  Java Java  Adobe® Reader® Adobe® Reader®
* Plug-in information
Last published on: 2007-08-14
close
|

|
Remote Sensing of Land, Oceans, and Atmosphere with MODIS
description (click to show/hide) |
Quiz
|
 Description: Description:
This Webcast is based on presentations given by Dr. W. Paul Menzel at several conferences. It is approximately 60 minutes in length and introduces the MODIS instrument on the Terra satellite. Dr. Menzel begins by providing background on MODIS channel selection and instrument calibration. He continues with a variety of examples that include both climatological and meteorological applications, including high-resolution data and derived-product imagery. The examples are divided into land, ocean, and atmosphere applications. Dr. Menzel concludes with a discussion of the new direct-broadcast capability of the Terra satellite that allows users all over the world to receive MODIS data.
Objectives:
• List the major land applications available from the MODIS sensor
• List the major ocean applications available from the MODIS sensor
• List the major atmospheric applications available from the MODIS sensor
• Describe the way that MODIS identifies features such as snow cover and vegetation cover
• Describe the way that cloud classification and/or phase can be determined using MODIS products
• State the channels used for detecting fires and hot spots
Estimated time to complete: 1 h
Includes audio: yes
Required plug-ins:  Flash Flash  RealPlayer RealPlayer  Java Java  Adobe® Reader® Adobe® Reader®
* Plug-in information
Last published on: 2002-02-11
close
|

|
Remote Sensing of Ocean Wind Speed and Direction: An Introduction to Scatterometry
description (click to show/hide) |
Quiz
|
 Description: Description:
This Webcast features Dr. Michael Freilich (Oregon State University, principal investigator on the QuikSCAT project for NSF) introducing and discussing the fundamentals of scatterometry and how they apply to the SeaWinds instrument on QuikSCAT. Dr. Freilich also describes how the model function is used to derive wind speed and direction from multiple collocated measurements.
Objectives:
• Describe the process of active remote sensing
• State the wavelengths used for deriving ocean surface wind speed and direction
• State the main variables that are used in the model function for deriving wind vectors (speed and direction)
• Define azimuth angle as it relates to satellite remote sensing geometry
• Define the incidence angle as it relates to satellite remote sensing geometry
• State the atmospheric conditions when wind vectors may be compromised
• Compare the scan strategies of fan beam and conical scatterometers
• Explain why certain parts of a conical scatterometer swath may have compromised accuracy
Estimated time to complete: 40 min
Includes audio: yes
Required plug-ins:  Flash Flash  RealPlayer RealPlayer  Java Java  Adobe® Reader® Adobe® Reader®
* Plug-in information
Last published on: 2004-07-14
close
|

|
Remote Sensing Using Satellites
description (click to show/hide) |
No Quiz
|
 Description: Description:
This Website was developed for undergraduate students enrolled in an introductory earth or atmospheric science course. It is designed to supplement lecture and textbooks. Its goal is to make you a better consumer of weather information by providing dynamic graphics, animations, and science content about remote sensing, visible and infrared satellite imagery, and hurricanes. As part of the module, you will apply what you've learned by exploring recent hurricanes through satellite imagery. When you have completed this module, you should be able to view satellite imagery in a typical weather forecast on TV or the Web and recognize the importance of some features.
Estimated time to complete: 2 h
Includes audio: yes
Required plug-ins:  Flash Flash  RealPlayer RealPlayer  Java Java  Adobe® Reader® Adobe® Reader®
* Plug-in information
Last published on: 1998-01-12
close
|

|
Rip Currents: Forecasting
description (click to show/hide) |
Quiz
|
 Description: Description:
This is the third and final part in a training series on rip currents. The topic of forecasting daily rip current risk can be explored by operational forecasters, many of whom do not have a physical oceanography background. The hazards of rip currents and a review of the factors that contribute to rip current development are discussed. To demonstrate the process of a rip current forecast and as an example of what can locally be developed at the user’s station, the module presents a rip current worksheet that is used operationally at some forecast offices. Various parts of this worksheet require the use of observed data and model output. These resources range from NOS Detailed Wave Summary reports to NOAA WAVEWATCH III model polar plots of wave spectral energy. The usage of these products in terms of rip current forecasting using the worksheet is explained in detail. In particular, the issue of “wave masking” in the 2-D model plots is illustrated. In order to practice with the products presented, the user is provided two cases (East and West Coasts). Other factors discussed include tide and lake levels as well as situational awareness. Lastly, a summary of important points from the module and experienced forecast offices is provided. Users are encouraged to examine the state of their office’s rip current program and develop a plan for improvement based on concepts and ideas presented in this module.
Objectives:
1. Describe the important elements that determine rip current risk.
2. Describe a process and resources that can be used to develop a local rip current forecast scheme.
3. Given wave data, determine whether wave masking is occurring and what the appropriate swell or wave components are to assess rip current risk.
4. Describe factors, other than swell and wind waves, that can alter rip current risk.
Estimated time to complete: 2-3 h
Includes audio: yes
Required plug-ins:  Flash Flash  RealPlayer RealPlayer  Java Java  Adobe® Reader® Adobe® Reader®
* Plug-in information
Last published on: 2006-08-11
close
|

|
Rip Currents: Nearshore Fundamentals
description (click to show/hide) |
Quiz
|
 Description: Description:
The Rip Currents: Nearshore Fundamentals module provides insight into how nearshore circulation and wave dynamics are involved in rip current formation. Topics covered in this module include: nearshore terminology, circulation and waves, rip current characteristics, and rip current forcing mechanisms. This module is the second of three modules covering the forecasting of rip currents.
Objectives:
After completing the module users will be able to:
- Describe the various zones, bathymetry features, and currents of the near shore environment.
- Describe shallow water, near shore process.
- Describe rip current characteristics.
- Describe rip current forcing mechanisms.
Estimated time to complete: 40 min
Includes audio: yes
Required plug-ins:  Flash Flash  RealPlayer RealPlayer  Java Java  Adobe® Reader® Adobe® Reader®
* Plug-in information
Last published on: 2004-12-13
close
|

|
Rip Currents: NWS Mission and Partnerships
description (click to show/hide) |
Quiz
|
 Description: Description:
This 20-minute webcast by Timothy Schott of the National Weather Service's Marine and Coastal Weather Services Branch discusses the basics of rip current formation and detection and the partnerships between the National Weather Service, National Sea Grant College Program, and the United States Lifesaving Association as they relate to rip current safety. Rip Currents is one of three modules on forecasting rip currents.
Estimated time to complete: 20 min
Includes audio: yes
Required plug-ins:  Flash Flash  RealPlayer RealPlayer  Java Java  Adobe® Reader® Adobe® Reader®
* Plug-in information
Last published on: 2004-08-16
close
|

|
River Forecasting Case Study
description (click to show/hide) |
Quiz
|
 Description: Description:
This module takes the learner through the considerations for the river forecasting decisions associated with the remnants of Hurricane Ivan on 17-19 September, 2004 for the Susquehanna River system in Pennsylvania and New York. The module assists the learner with applying the concepts covered in the foundation topics of the Basic Hydrologic Sciences course. Some of the specific topics pertinent to this case are soil conditions, the impact of QPF on runoff, runoff models, runoff processes, routed flow and stage-discharge relationships. Observations of upstream conditions and comparisons to historic crests are also examined to assist with operational flood forecast decisions. The core foundation topics are recommended as a prerequisite since this module assumes some pre-existing knowledge of hydrologic principles.
Objectives:
1. Describe hydrologic conditions in the Susquehanna River basin preceding the events associated with the remnants of Hurricane Ivan in the Susquehanna River Basin on the 17-19 September 2004.
a. Describe the local geography and its impact on storm runoff
b. Use climatology as a reference for potential storm impacts
c. Describe soil texture, soil profile, and ground cover conditions for the region
d. Analyze antecedent soil moisture levels for the area
2. Analyze the observed and forecast rainfall, current factors influencing runoff, and the initial river forecasts for the Susquehanna River preceding this event.
a. Analyze rainfall and soil information and anticipate the impact on runoff
b. Interpret runoff information from river models
c. Anticipate how errors in the QPF may impact the magnitude of runoff
3. Apply knowledge of runoff processes and river modeling to observed and historic streamflows to develop a forecast for the Susquehanna River at Wilkes-Barre for this event.
a. Analyze and anticipate dominant runoff mechanisms during a developing flood event
b. Examine the relative contributions from different components of the forecast hydrograph
c. Examine how changes in precipitation can influence the expected crest
d. Analyze how precipitation forecast errors impact runoff forecast errors
e. Anticipate the impact of runoff that is routed from upstream areas
f. Use observations and historic information to assess the likelihood of the predicted extreme event
g. Interpret and adjust guidance from river forecasting models
h. Issue a river forecast despite uncertainties
i. Appreciate how forecaster experience can play a very important role in the forecast process.
4. Assess lessons learned during the forecast process leading up to and during this flood event.
a. Validate how the river forecast model did for the peak stage
b. Interpret how the different components of the river model contributed to the forecast and its errors
c. Explain the important role of accurate stage-discharge relationships
d. Relate this event to previous major flood events
Estimated time to complete: 120 min
Includes audio: yes
Required plug-ins:  Flash Flash  RealPlayer RealPlayer  Java Java  Adobe® Reader® Adobe® Reader®
* Plug-in information
Last published on: 2007-06-12
close
|

|
River Ice Processes
description (click to show/hide) |
Quiz
|
 Description: Description:
The “River Ice Processes” module provides information on flooding associated with river ice jams. In this webcast, Dr. Kate White, nationally-recognized expert on river ice, explores basic river ice processes including the formation, growth, breakup, and transport of river ice and how it can become jammed, triggering floods. In addition, Dr. White covers the current, state-of-the-art ice jam forecasting, and current ice-modeling research and development being conducted by the U.S. Army Corps of Engineers. As a foundation topic for the Basic Hydrologic Science course, this module may be taken on its own, but it will also be available as a supporting topic providing factual scientific information to support students in completion of the case-based forecasting modules.
Objectives:
Describe factors leading to flash floods due to ice jams.
• Use standard language to describe ice jams.
• Describe basic ice processes including: formation, growth, breakup, and transport.
• Explain why ice jams form.
Describe methods and techniques used in prediction and forecasting of ice jams.
• Describe current modeling methods and tools used in ice jam prediction.
• Describe current research and development projects underway at the Cold Regions
Research and Engineering Laboratory (CRREL) of the U.S. Army Corps of Engineers.
• Describe other tools and resources available through CRREL.
Estimated time to complete: 1 h
Includes audio: yes
Required plug-ins:  Flash Flash  RealPlayer RealPlayer  Java Java  Adobe® Reader® Adobe® Reader®
* Plug-in information
Last published on: 2006-11-10
close
|

|
Runoff Processes
description (click to show/hide) |
Quiz
|
 Description: Description:
The Runoff Processes module offers a thorough introduction to the runoff processes critical for flood and water supply prediction. Through the use of rich illustrations, animations, and interactions, this module explains key terminology and concepts including paths to runoff, basin and soil properties and runoff modeling. It also provides an introduction to the National Weather Service River Forecast System (NWSRFS). As a foundation topic for the Basic Hydrologic Science course, this module may be taken on its own or used as a supporting topic to provide factual scientific information to students as they complete the case-based forecasting modules.
Objectives:
Explain basic runoff processes:
* Define rainfall runoff
* Identify the general movement of water both on the surface and in the ground
* Recognize the different terms associated with groundwater and runoff
* Understand the relationship between precipitation/snowmelt rate and infiltration
Describe the paths for runoff:
* Identify the different types of runoff that occur both at and below the surface
* Recognize the influence of surface and soil properties that influence surface runoff
* Understand the soil properties that influence subsurface runoff, or interflow
* Anticipate the types of runoff you may expect in your area given the rainfall/snowmelt rate and the soil properties
Explain basic basin issues related to runoff:
* Recognize basin characteristics and how the relate to runoff processes
* Explain the impact of urbanization on runoff characteristics
Describe how soil properties affect runoff:
* Anticipate water movement and runoff given soil characteristics
* Identify important soil properties in your area
* Understand how both natural and human factors influence the behavior of water in the soil
Describe basic concepts of runoff modeling:
* Understand the basic concepts in runoff modeling
* Recognize why complex versus simple models are used
* Describe how a lumped model works
* Describe how a semi-distributed model works
* Describe how a distributed model works and the potential advantages as well as limitations
Describe features of basic National Weather Service River Forecast System (NWRFS) models:
* The key components and subcomponents of the NWRFS
* Basic concepts behind and components of the SACSMA model
* Basic concepts behind and components of the API and Continuous API models
Estimated time to complete: 2-2.5 h
Includes audio: yes
Required plug-ins:  Flash Flash  RealPlayer RealPlayer  Java Java  Adobe® Reader® Adobe® Reader®
* Plug-in information
Last published on: 2006-06-13
close
|

|
Satellite Meteorology: Case Studies Using GOES Imager Data
description (click to show/hide) |
No Quiz
|
This module is not available on the Web. To order a CD, please see our contact information.
 Description: Description:
Satellite Meteorology: Case Studies Using GOES Imager Data is a continuation of the first module in the satellite meteorology series, Satellite Meteorology: Remote Sensing Using the New GOES Imager. This module includes a winter and summer severe storm case as well as a tutorial on tropical storms. It provides many opportunities to view and interpret GOES imager data and integrate those data with model, radar, and other data types. Additional material and exercises will be available on the COMET home page.
The subject matter experts for this module are Dr. James F. Purdom and Dr. Ray Zehr.
Estimated time to complete: 2-3 h
Includes audio: yes
Required plug-ins:  Flash Flash  RealPlayer RealPlayer  Java Java  Adobe® Reader® Adobe® Reader®
* Plug-in information
Last published on: 1997-01-01
close
|

|
Satellite Meteorology: GOES Channel Selection
description (click to show/hide) |
Quiz
|
 Description: Description:
This Web module was adapted from the CD-ROM module Satellite Meteorology: Using the New GOES Imager, and uses Macromedia® Flash to deliver audio over the Web.
The 60-minute presentation provides a review of the five GOES imager channels and their use, along with operational examples. The module also includes updated information on the 6.7 micrometer (water vapor) channel and the new 13.3 micrometer channel that will appear on the GOES N-P satellites.
Objectives:
• Identify sun glint in visible imagery
• State the advantages of adjusting enhancement tables in visible imagery for cloud feature identification
• Describe emissivity differences of cirrus and stratus clouds in the short-wave infrared channel (3.9 micron) and the infrared window channel (11 micron)
• Describe differences in how thick and thin cirrus clouds appear in the short-wave infrared channel (3.9 micron) and the infrared window channel (11 micron)
• Describe differences in how water and ice clouds appear in the short-wave infrared channel (3.9 micron) and the infrared window channel (11 micron)
• Describe how the fog/stratus product in derived
• State ways to distinguish low-level fog and stratus from higher water clouds
• Explain how the subpixel effect highlights fires and hot spots short-wave infrared channel (3.9 micron) imagery
• Explain the differences in appearance between ice clouds, stratus, and snow on the ground in short-wave infrared (3.9 micron), visible, and infrared window (11 micron) channel imagery
• Explain how the reflected component of the short-wave infrared channel (3.9 micron) channel affects imagery from this channel
• Explain how the reflected product is derived
• Describe advantages of using the reflected product in feature identification
• State the part of the atmosphere sensed by the water vapor (6.7 micron) channel
• Explain how storm relative loops are created
• State the improvements to the water vapor (6.7 micron) channel on the GOES N/O/P satellites
• List products derived using the split-window channel
• List the products derived from the carbon dioxide channel
Estimated time to complete: 1 h
Includes audio: yes
Required plug-ins:  Flash Flash  RealPlayer RealPlayer  Java Java  Adobe® Reader® Adobe® Reader®
* Plug-in information
Last published on: 2002-10-02
close
|

|
Satellite Meteorology: Introduction to Using the GOES Sounder
description (click to show/hide) |
Quiz
|
 Description: Description:
This module, adapted for the Web from the CD-ROM released in 1998, reviews GOES sounder characteristics, data products, and applications concurrent with the GOES I(8)-P satellites. Topics covered include the electromagnetic spectrum and sounder channel selection, weighting functions for temperature and moisture determination, and assessment of GOES sounder products. Sample imagery and products are provided along with several short case examples that demonstrate how these products are beneficial to meteorological analysis and forecasting applications.
Estimated time to complete: 1 h
Includes audio: no
Required plug-ins:  Flash Flash  RealPlayer RealPlayer  Java Java  Adobe® Reader® Adobe® Reader®
* Plug-in information
Last published on: 2006-12-06
close
|

|
Satellite Meteorology: Remote Sensing Using the New GOES Imager
description (click to show/hide) |
No Quiz
|
This module is not available on the Web. To order a CD, please see our contact information.
 Description: Description:
Satellite Meteorology: Remote Sensing Using the New GOES Imager is an introduction to the five-channel imager now available on GOES-8 and -9. After an introduction to the enhanced capabilities of these satellites, the module reviews remote sensing and radiative transfer theory through a series of conceptual models. These model discussions include explanations of how the different imager channels were chosen and the atmospheric, land, and oceanographic phenomena the channels can monitor both individually and in combination. The last section includes case study exercises and tutorials that provide opportunities to work with the new digital imagery.
The subject matter experts for this module are Dr. W. Paul Menzel and Dr. James F. Purdom.
Objectives:
• Identify sun glint in visible imagery
• State the advantages of adjusting enhancement tables in visible imagery for cloud feature identification
• Describe emissivity differences of cirrus and stratus clouds in the short-wave infrared channel (3.9 micron) and the infrared window channel (11 micron)
• Describe differences in how thick and thin cirrus clouds appear in the short-wave infrared channel (3.9 micron) and the infrared window channel (11 micron)
• Describe differences in how water and ice clouds appear in the short-wave infrared channel (3.9 micron) and the infrared window channel (11 micron)
• Describe how the fog/stratus product in derived
• State ways to distinguish low-level fog and stratus from higher water clouds
• Explain how the subpixel effect highlights fires and hot spots short-wave infrared channel (3.9 micron) imagery
• Explain the differences in appearance between ice clouds, stratus, and snow on the ground in short-wave infrared (3.9 micron), visible, and infrared window (11 micron) channel imagery
• Explain how the reflected component of the short-wave infrared channel (3.9 micron) channel affects imagery from this channel
• Explain how the reflected product is derived
• Describe advantages of using the reflected product in feature identification
• State the part of the atmosphere sensed by the water vapor (6.7 micron) channel
• Explain how storm relative loops are created
• State the improvements to the water vapor (6.7 micron) channel on the GOES N/O/P satellites
• List products derived using the split-window channel
• List the products derived from the carbon dioxide channel
Lake Effect Snow (LES)
• List the conditions that are favorable to the formation of LES
• Identify upper level shortwave troughs in water vapor (6.7 m) imagery
• Use water vapor (6.7 m) and IR window (10.7m) imagery to identify factors that contribute to LES
• Identify clouds producing LES
• Interpret vertical cross-section wind and temperate data
• State the effect that topography has on LES band formation and evolution
• Use the reflected energy product to identify snow on the ground
• Use appropriate GOES channels and the reflected energy product to identify ice clouds
• Use appropriate GOES channels and the reflected energy product to identify areas of unfrozen lake surface
• Describe the differences between Type 1 and Type 2 LES bands
• Describe the two forcing mechanisms for LES
• Identify LES convergence zones using appropriate GOES channels
• Explain the relationship between convergence and divergence as it relates to LES bands
• Estimate snowfall rates using Doppler radar and appropriate GOES channels and derived products
Convection Via Outflows:
• Identify NWP products used for predicting convective storms involving thunderstorm outflows
• Use appropriate GOES imager channels to track and monitor thunderstorm outflows
• Use appropriate GOES imager channels to characterize airmasss stability
• Explain the interaction between thunderstorm outflows, drylines, and airmasses
Tropical Cyclone Tutorial
• Identify the tropical storm formation regions in the Atlantic and Pacific oceans
• Identify cloud patterns that characterize tropical depressions in visible and IR Window (10.7 m) imagery
• Estimate tropical cyclone intensity from cloud pattern evolution
• Describe the structure of a developing tropical cyclone
• Describe the structure of a mature tropical cyclone
• State the mechanisms that weaken hurricanes and tropical storms
• Describe the diurnal cycle of tropical cyclones
17 Jan 1995 Case
• Use water vapor (6.7 m) and IR Window (10.7 m) imagery, to identify short waves, jet streaks, and vorticity centers
• Use vertical cross sections, to identify areas of subsidence, jet maxima, and areas of potential vorticity
• Use the fog stratus product, visible imagery, and IR Window (10.7 m) imagery to distinguish fog and stratus from cirrus clouds
• Explain how sunlight can affect the fog stratus product
• Use the fog stratus product, visible imagery, and IR Window (10.7 m) imagery to distinguish cloud from snow on the ground
• Use the fog stratus product, the reflected energy product, and IR Window (10.7 m) imagery to identify potential supercooled water clouds
17 April 1995 Case
• Use water vapor (6.7 m) and IR Window (10.7 m) imagery, to identify short waves, jet streaks, and vorticity centers
• Use visible, water vapor (6.7 m), and IR Window (10.7 m) imagery, to distinguish water clouds from ice clouds and areas of high humidity
• Use visible imagery loops and storm relative visible imagery loops, to identify areas of unstable air, convergence zones, outflow boundaries, and stationary fronts
Estimated time to complete: 5-6 h
Includes audio: yes
Required plug-ins:  Flash Flash  RealPlayer RealPlayer  Java Java  Adobe® Reader® Adobe® Reader®
* Plug-in information
Last published on: 1996-01-01
close
|

|
Satellite Meteorology: Using the GOES Sounder
description (click to show/hide) |
No Quiz
|
This module is not available on the Web. To order a CD, please see our contact information.
 Description: Description:
This module provides a review of GOES sounder characteristics and applications. Topics include a short history of satellite sounding, a review of infrared radiative transfer, GOES sounder spectral channel selection, weighting functions, atmospheric temperature and moisture profile retrievals, and assessment of GOES sounder products. Sample imagery and products are provided along with several mini-cases that show how these products are used for analysis and forecasting applications.
The subject matter experts for this module are Dr. W. Paul Menzel, NESDIS; Timothy Schmit, NESDIS; Gary Wade, NESDIS; Anthony Mostek, NWS Satellite Training Program Leader
Objectives:
Objectives for the case study portion of Using the GOES Sounder
• Use visible, water vapor (6.7 micron), IR Window (10.7 micron), precipitable water, and lifted index imagery to identify areas of potential severe convection
• Use precipitable water and lifted index imagery to track atmospheric moisture plumes
Estimated time to complete: 3-5 h
Includes audio: yes
Required plug-ins:  Flash Flash  RealPlayer RealPlayer  Java Java  Adobe® Reader® Adobe® Reader®
* Plug-in information
Last published on: 1998-01-01
close
|

|
Seasonal Forecast Problems Refresher Training
description (click to show/hide) |
No Quiz
|
 Description: Description:
This prototype module was originally intended as a review of seasonal weather regimes and hazards for regions that are of particular interest to the Air Force Weather Agency. Although the project was discontinued, the section on summer weather in the southeast U.S. is available as an forecaster's training aid and as an example of this type of training.
Estimated time to complete: 1 h
Includes audio: yes
Required plug-ins:  Flash Flash  RealPlayer RealPlayer  Java Java  Adobe® Reader® Adobe® Reader®
* Plug-in information
Last published on: 2002-05-08
close
|

|
Severe Convection II: Mesoscale Convective Systems
description (click to show/hide) |
Quiz
|
 Description: Description:
Mesoscale convective systems occur worldwide and year-round and are accompanied by the potential for severe weather and flooding. This module describes typical system evolution by examining squall line, bow echo, and MCC characteristics throughout their life cycles. This module has less emphasis on the physical processes controlling MCS structure and evolution than our previously released module, Mesoscale Convective Systems: Squall Lines and Bow Echoes. Instead, this newly updated module includes more material on tropical squall lines, MCC's, and on NWP’s ability to predict convective systems. The module starts with a forecast scenario and concludes with a final exam. Rich graphics, audio narration, and frequent interactions enhance the learning experience.
Objectives:
After completing this module, you should be able to do the following things.
Introduction to MCS Characteristics
• Recall the definition of an MCS
• Recall common types of MCS organization, especially squall lines and bow echoes
• List the potential weather hazards most likely associated with MCSs
• Identify key features associated with MCS initiation and evolution
• Recognize a likely MCS in radar imagery
Squall Lines
• Identify the various forms and compositions of squall lines
• Locate key squall line structures, including the cold pool, leading gust front, and rear-inflow jet
• Recall evolution of the surface pressure pattern during the lifetime of a squall line
• Explain the types of squall line formation
• Identify the phases of squall line evolution
• Using satellite and radar imagery, recognize the type and phase of a squall line
• Explain what determines if a squall line will be weak-to-moderate or moderate-to-strong
• Quantify low-level shear and identify which vertical wind shear most controls squall line strength
• Recall movement of long lines versus short lines, and movement of cells within a line
• Identify line back building and recognize conditions which support it
• Describe a line echo wave pattern and identify one from radar data
• List the differences between tropical and extratropical squall lines
Bow Echoes
• Define bow echoes and identify weather patterns conducive to their development
• Explain what a rear-inflow notch is and how to assess it with the MARC technique
• Discuss the factors that contribute to bow echoes being an especially severe form of MCS
• Describe the most likely time of onset and location of damaging winds from a bow echo
• Describe the characteristics of a derecho
Mesoscale Convective Complexes (MCCs)
• Recall how MCCs are defined via satellite imagery
• Describe where MCCs usually occur
• List the potential weather hazards associated with MCCs
• Explain what an MCV (or MVC) is and its relationship to an MCC
• Recognize the signature of an MCV from satellite imagery
• Recall why it is important to monitor an MCV
MCSs and Numerical Weather Prediction (NWP)
• List model convection issues and describe their impact on forecast elements
• Describe the difference between a model with convective parameterization and one without
• List the relative strengths and weaknesses of using a model with higher resolution (10 km WRF) versus one with lower resolution (22 km Eta)
• Describe common NWP limitations and errors related to forecasting large-scale convection
• Explain how model output should be applied to forecasting MCS occurrence
Estimated time to complete: 2-4 h
Includes audio: yes
Required plug-ins:  Flash Flash  RealPlayer RealPlayer  Java Java  Adobe® Reader® Adobe® Reader®
* Plug-in information
Last published on: 2004-09-24
close
|

|
Shallow Water Waves
description (click to show/hide) |
Quiz
|
 Description: Description:
This is the fourth module in our series on open water waves. As deep-water
waves approach the coastline, they encounter shallower water and begin to
interact with the sea floor while evolving into shallow water waves. This
module uses an interactive wave calculator to look at a variety of shallow-water wave behaviors, including shoaling, refraction, reflection, breaking, attenuation, and coastal
run-up and set-up. All are important considerations when forecasting for
small craft and other recreational interests in the near-shore
environment.
Objectives:
By the end of this module, you will have learned:
* What transformations waves undergo as they move from deep water into shallow water
* How to describe and predict the effects of shallow-water processes such as shoaling, refraction, and attenuation
* How to identify and distinguish between the various breaker types, matching them with their corresponding bathymetry
* How to predict the effects of interactions between waves and currents
* The difference between wave run-up and set-up, and how to estimate them
Estimated time to complete: 1.5 h
Includes audio: yes
Required plug-ins:  Flash Flash  RealPlayer RealPlayer  Java Java  Adobe® Reader® Adobe® Reader®
* Plug-in information
Last published on: 2006-08-01
close
|

|
Should Synopticians Worry About Climate?
description (click to show/hide) |
No Quiz
|
 Description: Description:
This lecture was presented during the ongoing workshops on Climate Variability that are part of the NWS Climate Professional Development Series. During the presentation, Dr. Sardeshmukh presents statistical evidence that demonstrates the impact that climate variability has on weather. The Webcast has an accompanying bibliography and climate glossary.
Estimated time to complete: 50 min
Includes audio: yes
Required plug-ins:  Flash Flash  RealPlayer RealPlayer  Java Java  Adobe® Reader® Adobe® Reader®
* Plug-in information
Last published on: 2003-02-26
close
|

|
Skew-T Mastery
description (click to show/hide) |
Quiz
|
 Description: Description:
Meteorologists typically examine atmospheric soundings in the course of preparing a weather forecast. The skew-T / log-P diagram provides the preferred method for analyzing these soundings. This module comprehensively examines the use of the skew-T diagram. It explores thermodynamic properties, convective parameters, stability assessment, and several forecast applications. The module is designed for both instruction and reference. It also comes with an interactive Web-based skew-T diagram that calculates several common forecast parameters.
Objectives:
Module Goal
The goal of this module is to teach the novice forecaster to effectively use the skew-T/log-P diagram. After completing the module, they should be able to read and interpret a sounding plotted on a skew-T/log P diagram and apply that information to a weather forecast.
Performance Objectives
- Given a skew-T/log-P diagram, identify and describe the various lines.
- Given a sounding plotted on a skew-T/log-P diagram:
- Read or calculate the thermodynamic properties at various levels.
- Determine the convective levels, including the LCL, CCL, LFC, MCL, EL, and MPL.
- Determine stability indices such as LI, SSI, KI, TT, and SWEAT and use them to assess the potential for severe weather.
- Describe how CAPE and CIN are determined.
- List and describe the different types of stability and identify them in a sounding plotted on a skew-T diagram
- List and describe the different types of lapse rates and relate them to stability.
- List and describe processes that alter stability and give examples of common cases where those processes occur.
- Given a suitable synoptic environment and a sounding plotted on a skew-T/log-P diagram, interpret the sounding with regard to common forecast problems.
Estimated time to complete: 6-8 h
Includes audio: no
Required plug-ins:  Flash Flash  RealPlayer RealPlayer  Java Java  Adobe® Reader® Adobe® Reader®
* Plug-in information
Last published on: 2006-10-04
close
|

|
Slantwise Convection Case Exercise
description (click to show/hide) |
No Quiz
|
 Description: Description:
This exercise examines an event that took place in the 24 hour time period beginning at 18Z, Dec 31, 2000 in southern British Columbia, Canada and northern Washington/Idaho, United States. This is a companion piece to the COMET Webcast, Slantwise Convection: An Operational Approach.
Objectives:
• Apply techniques for assessing and forecasting conditional symmetric instability and associated slantwise convection
Estimated time to complete: 45 min
Includes audio: no
Required plug-ins:  Flash Flash  RealPlayer RealPlayer  Java Java  Adobe® Reader® Adobe® Reader®
* Plug-in information
Last published on: 2002-06-17
close
|

|
Slantwise Convection: An Operational Approach
description (click to show/hide) |
Quiz
|
 Description: Description:
This Webcast is a recreation of a presentation on slantwise convection given by Kent Johnson in February, 2002 in Boulder, Colorado. It focuses on assessing the release of conditional symmetric instability as slantwise convection. It provides an overview of the characteristics and theory of CSI, assessment of CSI and slantwise induced precipitation in complex terrain, and operational challenges to assessing CSI.
Objectives:
1. Show that the atmosphere can be intertially and gravitationally stable, but unstable to a slantwise displacement when near or at saturation.
2. Demonstrate the vertical-cross section approach in diagnosing the potential for conditional symmetric instability (CSI).
3. Examine ways to improve forecasts that involve a potential slantwise convection situation.
4. Examine the typical characteristics of CSI in complex terrain.
5. Apply a slantwise convection analysis to a real world situation.
Estimated time to complete: 40 min
Includes audio: yes
Required plug-ins:  Flash Flash  RealPlayer RealPlayer  Java Java  Adobe® Reader® Adobe® Reader®
* Plug-in information
Last published on: 2002-06-17
close
|

|
Snowmelt Processes
description (click to show/hide) |
Quiz
|
 Description: Description:
This module helps the student develop an understanding of the contribution of snowmelt in the hydrologic forecasting process. The module first explains the influences of wind, sun, terrain, and vegetation on snow water distribution and then discusses the evolution of snowpack characteristics. From there, the student will learn about energy exchanges between the snow and the atmosphere and how that affects how quickly and how completely snow will melt. Finally, an explanation is presented of water flow through snow and the fate of that water when it reaches the ground surface. The lesson will be highlighted with brief examples of actual snowmelt cases.
Objectives:
Describe the development and evolution of snowpack:
- Explain the influences of terrain, wind, vegetation, and temperature.
- Describe how sublimation affects snowpack.
- Describe the process of snow metamorphism.
- Explain SLR and SWE.
- Describe why and how snow energy exchanges are important.
Describe the processes leading up to and during melting:
- Explain the importance of latent heat exchange.
- Describe what is necessary for rapid melting.
- Explain the importance of rainfall on the snowmelt process.
Describe the fate of melt water from snow:
- Describe how water can move through the snowpack.
- Explain what happens when melt water reaches the ground surface.
- Discuss a situation that would result in rapid runoff from snowmelt.
Estimated time to complete: 60 min
Includes audio: yes
Required plug-ins:  Flash Flash  RealPlayer RealPlayer  Java Java  Adobe® Reader® Adobe® Reader®
* Plug-in information
Last published on: 2007-02-02
close
|

|
Space Weather Basics
description (click to show/hide) |
Quiz
|
 Description: Description:
This Webcast presents an overview of the processes of space weather, its
impacts on the Earth and human activities and the technologies used for forecasting
space weather events. The Webcast goal is to provide NWS forecasters a basic
understanding of space weather and the operations of NOAA's Space
Environment Center (SEC). It will be of interest to a general audience as
well.
Objectives:
1. Identify the correct sequence of phases in the life cycle of a star.
2. State three types of space weather events. Describe their characteristics
and effects.
3. Describe the general pattern of sunspot migration during its 11-year
cycle.
4. State the characteristics of plasma.
5. List three types of solar energy release and describe their
characteristics.
6. Describe and explain the shape of the earth's magnetosphere, and describe
its role in space weather events.
7. State the space environment monitors used in GOES and POES satellites.
Estimated time to complete: 25 min
Includes audio: yes
Required plug-ins:  Flash Flash  RealPlayer RealPlayer  Java Java  Adobe® Reader® Adobe® Reader®
* Plug-in information
Last published on: 2005-11-11
close
|

|
Space Weather: Welcome, SEC
description (click to show/hide) |
No Quiz
|
 Description: Description:
This video presentation welcomes the Space Weather Prediction Center, formerly known as the Space Environment Center or SEC to the National Weather Service (NWS) as an operational entity of the National Centers for Environmental Prediction (NCEP) family. Describing the ways in which space weather affects global communications and power resources, it demonstrates the importance of space weather forecasting as a part of the NWS family of services. With the inclusion of SWPC, the NWS now provides environmental understanding from the sun to the sea.
Estimated time to complete: 15 min
Includes audio: yes
Required plug-ins:  Flash Flash  RealPlayer RealPlayer  Java Java  Adobe® Reader® Adobe® Reader®
* Plug-in information
Last published on: 2005-01-11
close
|

|
Stability, Smoke Management, and Fire Weather Forecasting
description (click to show/hide) |
Quiz
|
 Description: Description:
The “Stability, Smoke Management, and Fire Weather Forecasting” module examines the effects of atmospheric stability on fire behavior and the transport of smoke, as well as fire and smoke management operations. Topics covered include the impacts of the formation, persistence, and dissipation of inversions and how best to relate forecast information on these phases to customers. Calculation and application of the Haines Index is applied through the highly interactive Haines Game. In addition, the influence of stability on the transport and dispersion of fire related smoke is covered in the context of smoke management programs and the critical information provided by fire weather forecasters. This web module is part of the Advanced Fire Weather Forecasters Course.
Objectives:
At the end of this module you should be able to:
1. Describe various atmospheric stability profiles in terms of their potential influences on fire behavior
a. Characterize influences of stability on fire behavior
b. Describe impacts of inversion formation, persistence, weakening, and dissipation on fire behavior
c. Describe, interpret, and apply the Haines Index
d. Identify impacts of inversions on fire management operations
2. Demonstrate an understanding of the smoke management process and the forecaster's role in that process
a. Correctly identify statements describing the purposes for, and importance of smoke management
b. Identify consequences of accurate/inaccurate smoke management-related forecasts
c. Identify the factors that influence smoke-management decision-making
d. Calculate and interpret ventilation index values in support of smoke management operations
Estimated time to complete: 90 min
Includes audio: yes
Required plug-ins:  Flash Flash  RealPlayer RealPlayer  Java Java  Adobe® Reader® Adobe® Reader®
* Plug-in information
Last published on: 2008-03-28
close
|

|
Streamflow Routing
description (click to show/hide) |
Quiz
|
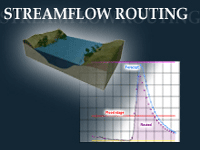 Description: Description:
This module offers a thorough introduction to streamflow routing methods and applications in the river forecasting process. Through the use of rich illustrations, animations, and interactions, this module explains key routing concepts, flow characteristics, and tools with a primary focus on hydrologic routing methods. As a foundation topic for the Basic Hydrologic Science Course, this module may be taken on its own or used as a supporting topic to provide factual scientific information to students as they complete the case-based forecasting modules.
Objectives:
1. Demonstrate an understanding of the streamflow routing process
2. Define streamflow routing:
a. Interpret stage and discharge graphs
b. Describe applications of streamflow routing
c. Explain how streamflow routing fits into the flood prediction process
d. Describe the major approaches used in streamflow routing
3. Describe the storage-release concept and the accounting budget approach
4. Describe flow categories and impact on the choice of routing method
5. Define common terms used to describe physical characteristics of streams
6. List the factors used in determining streamflow velocity and discharge via Manning’s equation
7. Use rating curves to determine the stage-discharge relationship, i.e., the expected discharge for a given depth of water at a given point for a given period
8. Explain concepts used in streamflow routing:
a. Describe how routing process is applied in river forecasting
b. Explain how storage concept is applied in routing
c. Describe wedge and prism storage approach as applied in the Muskingum method
9. Apply the Lag and K method for streamflow routing
10. Identify how hydraulic routing methods differ from hydrologic methods:
a. Describe when one might choose to use hydraulic over hydrologic methods
Estimated time to complete: 1.5-2 h
Includes audio: yes
Required plug-ins:  Flash Flash  RealPlayer RealPlayer  Java Java  Adobe® Reader® Adobe® Reader®
* Plug-in information
Last published on: 2006-03-17
close
|

|
Supporting Military Emergency Response During Hazardous Releases
description (click to show/hide) |
Quiz
|
 Description: Description:
This module is primarily intended for AFWA and other military forecasters. It explains the basics of how hazardous materials are dispersed in the atmosphere and how emergency responders and others model the transport and impact of the materials. The goal is to acquaint forecasters with the inputs needed for modeling and to encourage them to be proactive in providing their site-specific knowledge to improve dispersion predictions.
Objectives:
The module’s learning objectives are for forecasters to:
1. Describe the main factors that influence pollutant dispersion
2. Understand the basic inputs and outputs used in emergency response models
3. State or list the key uncertainties that can cause misleading dispersion model forecasts
4. Provide the meteorological inputs likely to be needed by an emergency responder
5. Use the forecasters’ local expertise to provide site-specific information that an emergency responder may not think to request
Estimated time to complete: 1.5 h
Includes audio: yes
Required plug-ins:  Flash Flash  RealPlayer RealPlayer  Java Java  Adobe® Reader® Adobe® Reader®
* Plug-in information
Last published on: 2006-10-16
close
|

|
Synoptic Weather Considerations: Forecasting Fog and Low Stratus
description (click to show/hide) |
Quiz
|
 Description: Description:
In order to assess whether a fog or stratus event is possible, you must evaluate the synoptic-scale influences that will drive the local conditions. In this module, we examine several common synoptic situations to understand the processes involved in fog or low stratus development. Most of these are forced primarily by advective or dynamic processes (although radiation does play a role). A more detailed discussion of radiation processes is contained in the Radiation Fog module. This module is part of the Distance Learning Course 1: Forecasting Fog and Low Stratus.
Objectives:
• Identify the large-scale and local conditions that support the development, maintenance, and dissipation of fog/stratus events
• Identify several synoptic regimes that can result in advection or radiation fog and the processes that contribute to fog formation, maintenance, and dissipation for each
Estimated time to complete: 2-3 h
Includes audio: no
Required plug-ins:  Flash Flash  RealPlayer RealPlayer  Java Java  Adobe® Reader® Adobe® Reader®
* Plug-in information
Last published on: 2003-06-28
close
|

|
Ten Common NWP Misconceptions
description (click to show/hide) |
Quiz
|
 Description: Description:
This module introduces forecasters to ten of the most commonly encountered or significant misconceptions about NWP models. This list of ten misconceptions includes issues surrounding data assimilation, model resolution, physical parameterizations, and post-processing of model forecast output.
Estimated time to complete: 100 min
Includes audio: yes
Required plug-ins:  Flash Flash  RealPlayer RealPlayer  Java Java  Adobe® Reader® Adobe® Reader®
* Plug-in information
Last published on: 2002-05-02
close
|

|
The Balancing Act of Geostrophic Adjustment
description (click to show/hide) |
Quiz
|
 Description: Description:
This 7-page module provides a primer on geostrophic adjustment concepts. It discusses their application for understanding and forecasting real weather features, interpreting model forecasts, and recognizing the type and duration of impact that observations exert on the model forecast. The module also includes an interactive Exercises section.
Estimated time to complete: 1 h
Includes audio: no
Required plug-ins:  Flash Flash  RealPlayer RealPlayer  Java Java  Adobe® Reader® Adobe® Reader®
* Plug-in information
Last published on: 2002-11-25
close
|

|
The El Nino-Southern Oscillation (ENSO) Cycle
description (click to show/hide) |
Quiz
|
 Description: Description:
This Webcast, is an expert lecture by Dr. Vernon Kousky of NOAA/CPC, entitled "The El Niño-Southern Oscillation (ENSO) Cycle". The presentation covers the identification and global weather impacts associated with both phases of ENSO. This version of the presentation has enhanced graphics and has been modified to include an introduction to the newly established “Operational Niño Index” (ONI). A forecaster who attended the original classroom presentation on The ENSO Cycle had the following to say... “[This lecture was the] best presentation of the workshop! Very comprehensive, from the basics to the more complex issues, easy to follow, and great use of graphics. The presenter did an excellent job of relating the presentation topics to forecasters.”
Estimated time to complete: 30-35 min
Includes audio: yes
Required plug-ins:  Flash Flash  RealPlayer RealPlayer  Java Java  Adobe® Reader® Adobe® Reader®
* Plug-in information
Last published on: 2003-10-23
close
|

|
The Impact of Weather on Air Traffic Management
description (click to show/hide) |
Quiz
|
 Description: Description:
This module focuses on the National Airspace System (NAS) and how weather affects it. It describes the various components of the Federal Aviation Administration (FAA), how that organization manages air traffic, and how CWSU and WFO forecasts help the FAA's decision-making process. The module also provides tips on establishing a good professional relationship with this important partner (FAA), understanding their language, and preparing weather briefings that will give them the information they need. This module is part of a larger exercise to develop a station Weather Impacts Playbook, a supplement to the Station Duty Manual.
Estimated time to complete: 3 h
Includes audio: yes
Required plug-ins:  Flash Flash  RealPlayer RealPlayer  Java Java  Adobe® Reader® Adobe® Reader®
* Plug-in information
Last published on: 2005-05-31
close
|

|
The Madden-Julian Oscillation Life Cycle
description (click to show/hide) |
Quiz
|
 Description: Description:
This Webcast, is an expert lecture by Dr. Roland Madden, where he describes the important climate-moderating feature, the Madden-Julian oscillation which is known more commonly as the MJO. The Webcast is presented in five sections and covers the identification and variability of the MJO. He also introduces some of the many global weather impacts that are associated with MJO occurrences. A forecaster who attended the original classroom presentation had the following to say…“This [lecture] was really the best yet! And hearing it from the "father" of the MJO made it so much better. It was so easy for me to empirically relate my years of observing the weather to this cycle. I am convinced this is where we
can make the money in the improvement of 2 to 4 week forecasts in the next several years.”
Estimated time to complete: 42 min
Includes audio: yes
Required plug-ins:  Flash Flash  RealPlayer RealPlayer  Java Java  Adobe® Reader® Adobe® Reader®
* Plug-in information
Last published on: 2002-11-08
close
|

|
The NCEP NAM WRF Model (Full version)
description (click to show/hide) |
Quiz
|
 Description: Description:
NCEP is replacing the NAM Eta model with a version of NAM WRF on June 20, 2006. COMET has created The NCEP NAM WRF Model Webcast to describe changes in the model and analysis system, highlighting how these changes impact the model forecast. The new Gridpoint Statistical Interpolation (GSI) analysis introduced with this change will also be implemented in the Real-Time Mesoscale Analysis later in 2006 and in the GFS, RUC, and Hurricane-WRF models over the next two years. In addition to discussing the GSI, the Webcast covers the change in vertical coordinate and terrain, nonhydrostatic effects, a change in the precipitation type algorithm, and some background on the WRF concept and the previous operational uses of the NCEP Nonhydrostatic Mesoscale Model.
Objectives:
At the end of this Webcast, you will be able to
• Describe the WRF concept and how it differs from other NWP model implementations
• Describe how GSI improves the analysis
• Define and describe the use of anisotropic background error covariances
• State differences between the vertical coordinate systems in Eta and NMM and how they affect the forecast
• Anticipate nonhydrostatic effects on model forecasts
• Describe several new WRF output variables, including precipitation type and simulated radar reflectivity
Estimated time to complete: 65 min
Includes audio: yes
Required plug-ins:  Flash Flash  RealPlayer RealPlayer  Java Java  Adobe® Reader® Adobe® Reader®
* Plug-in information
Last published on: 2006-06-12
close
|

|
The NCEP NAM WRF Model (Short version)
description (click to show/hide) |
Quiz
|
 Description: Description:
NCEP is replacing the NAM Eta model with a version of NAM WRF on June 20,
2006. COMET has created The NCEP NAM WRF Model (Short Version) Webcast to describe changes in the model and analysis system, highlighting
how these changes impact the model forecast. (A full version of this Webcast
is also available.) The new Gridpoint Statistical Interpolation
(GSI) analysis introduced with this change will also be implemented in the
Real-Time Mesoscale Analysis later in 2006 and in the GFS, RUC, and
Hurricane-WRF models over the next two years. In addition to discussing the
GSI, the Webcast covers the change in vertical coordinate and terrain,
nonhydrostatic effects, a change in the precipitation type algorithm, and
some background on the WRF concept and the previous operational uses of the
NCEP Nonhydrostatic Mesoscale Model.
Objectives:
At the end of this Webcast, you will be able to
• Describe the WRF concept and how it differs from other NWP model implementations
• Describe how GSI improves the analysis
• Define and describe the use of anisotropic background error covariances
• State differences between the vertical coordinate systems in Eta and NMM and how they affect the forecast
• Anticipate nonhydrostatic effects on model forecasts
• Describe several new WRF output variables, including precipitation type and simulated radar reflectivity
Estimated time to complete: 40 min
Includes audio: yes
Required plug-ins:  Flash Flash  RealPlayer RealPlayer  Java Java  Adobe® Reader® Adobe® Reader®
* Plug-in information
Last published on: 2006-06-09
close
|

|
The NPOESS Science Advisory Team
description (click to show/hide) |
No Quiz
|
 Description: Description:
This Webcast, narrated by Dr. Friday, describes the creation and roles of the NPOESS (National Polar-orbiting Operational Environmental Satellite System) Science Advisory Team (SAT). This team is composed of leading atmospheric scientists and headed by Dr. W. Elbert "Joe" Friday, former director of the NWS. The SAT provides scientific review and guidance to the individual Operational Algorithm Teams (OATs), which are organized by discipline and/or sensor type. The VIIRS (Visible and Infrared Imager Radiometer Suite) OAT (VOAT) for example, advises on instrument development and tuning of algorithms to maximize efficiency and to assure that the measurement objectives of specific environmental data records (EDRs) are met.
Objectives:
• State the purposes of the Science Advisory Team
• State the constraints of the Science Advisory Team
• Describe the Science Advisory Team management structure
Estimated time to complete: 15 min
Includes audio: yes
Required plug-ins:  Flash Flash  RealPlayer RealPlayer  Java Java  Adobe® Reader® Adobe® Reader®
* Plug-in information
Last published on: 2003-06-27
close
|

|
The NPP Data Exchange Toolkit (NEXT)
description (click to show/hide) |
No Quiz
|
 Description: Description:
This Webcast features Dr. Robert Murphy of NASA discussing the data quality flags and distribution network for the initial data coming from the NPOESS Preparatory Project (NPP) satellite instruments. Dr. Murphy also provides contact points for more information or to receive the initial NPP data stream.
Estimated time to complete: 10 min
Includes audio: yes
Required plug-ins:  Flash Flash  RealPlayer RealPlayer  Java Java  Adobe® Reader® Adobe® Reader®
* Plug-in information
Last published on: 2003-10-09
close
|

|
The Role of the MJO in Oceanic and Atmospheric Variability
description (click to show/hide) |
Quiz
|
 Description: Description:
This Webcast, presented by Dr. Klaus Weickmann of NOAA/CIRES/Climate Diagnostic Center, explores the role that the Madden-Julian Oscillation (MJO) plays in global climate variability. The expert lecture is divided into five sections, which give a short overview of the phenomenon, discuss its relationship with sea surface temperatures, compares composite MJO events to individual occurrences, and touches on the ability of models to predict MJO events.
Estimated time to complete: 37 min
Includes audio: yes
Required plug-ins:  Flash Flash  RealPlayer RealPlayer  Java Java  Adobe® Reader® Adobe® Reader®
* Plug-in information
Last published on: 2002-11-08
close
|

|
The Science of Global Climate Change and Human Influences
description (click to show/hide) |
Quiz
|
 Description: Description:
This Webcast, recorded in 2003, is an expert lecture by Dr. Kevin Trenberth of NCAR’s Climate and Global Dynamics division. The presentation includes evidence that the atmosphere is changing, discussions on global energy flows and human factors contributing to change, and concludes with predictions for the future. This version of the presentation has enhanced graphics and links to additional resources. One of the students who attended the original classroom presentation on Climate Change commented that, “Kevin thoroughly discussed global warming and what it really is. I now have a better understanding of the problem.”
Estimated time to complete: 42 min
Includes audio: yes
Required plug-ins:  Flash Flash  RealPlayer RealPlayer  Java Java  Adobe® Reader® Adobe® Reader®
* Plug-in information
Last published on: 2004-06-14
close
|

|
The SPoRT Center – Infusing NASA Technology Into NWS WFO
description (click to show/hide) |
Quiz
|
 Description: Description:
This Webcast introduces the SPoRT Center, a joint NASA and National Weather Service project to provide unique NASA datasets to several forecast offices and evaluate their usefulness and impact on forecast operations. The presentation provides a description of the SPoRT Center, examples of its collaborations with weather forecast offices, and demonstrates use of MODIS data, AMSR-E derived products and lightning flash density product applications. It also includes mention of the projects the SPoRT Center will likely undertake in the future. The information contained in this Webcast reflects the status of the SPoRT program as of the summer of 2006. Since the SPoRT program evolves to meet NASA program objectives, some of the capabilities or activities portrayed in this presentation may have changed since its original production.
Objectives:
After completing the Webcast the learner will be able to:
- Describe the SPoRT program
- State the mission of the SPoRT program
- State advantages of using MODIS true-color imagery
- Explain how higher resolution MODIS data can complement GOES and insitu data
- State the advantages of AMSR-E data for coastal forecasters.
- State an advantage of using MODIS SST data for model initialization
- State how the SPoRT program works with local, regional, and national levels of the NWS
- Describe North Alabama Lightning Array data sets and their contribution to forecasting convection
Estimated time to complete: 1 h
Includes audio: yes
Required plug-ins:  Flash Flash  RealPlayer RealPlayer  Java Java  Adobe® Reader® Adobe® Reader®
* Plug-in information
Last published on: 2007-02-28
close
|

|
The Structure of the NWS Fire Weather Program
description (click to show/hide) |
Quiz
|
 Description: Description:
The Structure of the NWS Fire Weather Program explores the joint agreement between NOAA’s NWS and land management agencies to develop an appreciation of the contribution each agency makes in providing the best possible fire weather services. As part of the Advanced Fire Weather Forecasters Course, this module focuses on the NWS Fire Weather Program itself to set the stage for other course modules.
Objectives:
At the end of this module you should be able to:
* Describe the components and responsibilities in the NWS Fire Weather Program, including the objectives of fire weather services provided by the NWS in support of fire weather customers.
* Identify and use the three primary policy and guidance documents defining fire weather services to answer questions about the NWS Fire Weather Program.
* Define the terms "Red Flag Warning" and "Fire Weather Watch" and determine the appropriate actions to take given a fire weather scenario.
* Explain the actions customers take in response to an issuance of Fire Weather Watches and Red Flag Warnings.
Estimated time to complete: 90 min
Includes audio: yes
Required plug-ins:  Flash Flash  RealPlayer RealPlayer  Java Java  Adobe® Reader® Adobe® Reader®
* Plug-in information
Last published on: 2007-11-22
close
|

|
The Use and Misuse of Conditional Symmetric Instability
description (click to show/hide) |
Quiz
|
 Description: Description:
In this Webcast, Dr. Schultz outlines the subtle and often confusing issues surrounding conditional symmetric instability. Material is then presented to encourage the meteorological community to properly apply these concepts to diagnose actual regions of CSI and apply that knowledge to forecasting banded precipitation. Avenues for future research are also discussed.
This lesson is based on an article of the same name that appears in the Dec.1999 issue of the AMS journal, Monthly Weather Review. In response to feedback, a version of this Webcast that can be installed on your computer for local playback is also provided.
Objectives:
1. Point out pitfalls so that they don't continue to be perpetuated
2. Illustrate some deficiencies in our understanding of CSI
3. Recommend operational uses of CSI that are consistent with our current state of knowledge
4. Encourage future operational research explorations
Estimated time to complete: 30 min
Includes audio: yes
Required plug-ins:  Flash Flash  RealPlayer RealPlayer  Java Java  Adobe® Reader® Adobe® Reader®
* Plug-in information
Last published on: 2000-01-07
close
|

|
Thermally-forced Circulation I: Sea Breezes
description (click to show/hide) |
Quiz
|
 Description: Description:
This module describes the phenomena of the sea breeze. It examines factors that lead to the formation of a sea breeze, modifying effects on sea breeze development, how mesoscale NWP models handle sea breezes, and sea breeze forecast parameters. The module places instruction in the context of a sea breeze case from Florida and compares surface and satellite observations to a model simulation using the AFWA MM5. Like other modules in the Mesoscale Meteorology Primer, this module comes with audio narration, rich graphics, and a companion print version.
Objectives:
Terminal Objectives
By the end of this module you will be able to describe how and why, when and where sea breezes occur
Enabling Objectives
By the end of this module you will be able to do the following:
1. Describe when and where sea breezes form
2. Characterize the sea breeze in terms of strength and horizontal and vertical extent
3. List the principle factors that affect sea breeze formation
4. List the sensible weather associated with formation and passage of a sea breeze front
5. Describe the use and limitations of NWP model simulations of sea breezes.
6. Describe how satellite imagery can assist in detecting sea breezes
Estimated time to complete: 1 h
Includes audio: yes
Required plug-ins:  Flash Flash  RealPlayer RealPlayer  Java Java  Adobe® Reader® Adobe® Reader®
* Plug-in information
Last published on: 2002-12-12
close
|

|
Thermally-forced Circulation II: Mountain/Valley Breezes
description (click to show/hide) |
Quiz
|
 Description: Description:
This is a foundation module in the Mesoscale Meteorology Primer series. Topics covered include up- and downslope breezes, up- and down-valley winds, associated hazards, and forecasting techniques. Like other modules in the Mesoscale Meteorology Primer, this module comes with audio narration, rich graphics, and a companion print version.
Objectives:
Terminal Objectives
By the end of this module you will be able to do the following:
1. Describe how, why, when, and where mountain/valley breezes occur.
2. List the forecast concerns and aviation hazards associated with mountain/valley breezes.
Enabling Objectives
By the end of this module you will be able to do the following:
1. Describe when and where mountain/valley breezes form, including their diurnal cycle.
2. List the forecast concerns and aviation hazards associated with mountain/valley breezes.
3. Describe the processes that lead to slope winds.
4. Describe how topography may affect mountain/valley breezes.
5. Describe how satellite imagery can assist in detecting mountain/valley breezes.
Estimated time to complete: 30 min
Includes audio: yes
Required plug-ins:  Flash Flash  RealPlayer RealPlayer  Java Java  Adobe® Reader® Adobe® Reader®
* Plug-in information
Last published on: 2002-06-28
close
|

|
Top Ten Misconceptions about NWP Models: Teletraining Archive
description (click to show/hide) |
No Quiz
|
 Description: Description:
The material in this session is designed to introduce you to ten of the most commonly encountered or significant misconceptions about NWP models, and to dispel these misconceptions with the truth about what these models actually do and how they may be used intelligently. This "top ten" list should not be considered exhaustive, by any means, but rather a sample of misconceptions from each of the main components of NWP models, including:
o Data assimilation.
o Numerical calculation methods, including model resolution.
o Physical parameterizations.
o Post-processing of model forecast output, including MOS.
We hope to encourage use of the COMET web-based training on NWP through giving a flavor of the material therein contained in this lesson.
Estimated time to complete: 75 min
Includes audio: yes
Required plug-ins:  Flash Flash  RealPlayer RealPlayer  Java Java  Adobe® Reader® Adobe® Reader®
* Plug-in information
Last published on: 2001-03-20
close
|

|
Topics in Lake Effect Snow Forecasting
description (click to show/hide) |
Quiz
|
 Description: Description:
Lake and ocean effect processes can have a significant impact on snowfall amounts in many parts of North America, and can be very tricky to forecast. This short module is a collection of narrated reference material on many aspects of lake effect snow forecasting. It is divided into three main topics: Basic Ingredients of Lake/Ocean Snow, Banding Processes, and Satellite Detection. These materials are also available as the separate Supporting Topics within the case exercise module, Ocean Effect Snow: New England Snow Storm, 14 January 1999: http://meted.ucar.edu/norlat/snow/ocean_effect_case/.
Objectives:
• Identify the key conditions for the formation of lake or ocean effect snows events
• Identify the mesoscale factors that lead to the establishment of ocean effect snow bands.
• Describe how frictional and thermal convergence can impact lake effect snow production
• Recognize ocean effect snow bands from satellite and radar displays.
Estimated time to complete: 1 h
Includes audio: yes
Required plug-ins:  Flash Flash  RealPlayer RealPlayer  Java Java  Adobe® Reader® Adobe® Reader®
* Plug-in information
Last published on: 2005-02-09
close
|

|
Topics in Polar Low Forecasting
description (click to show/hide) |
Quiz
|
 Description: Description:
This module presents an overview of the climatology, formation, evolution, detection, and forecasting of polar lows. The presentation has five sections: Disturbances in Cold Air Masses; Climatology of Cold Air Vortices and Polar Lows; Monitoring and Nowcasting of Polar Lows; Polar Lows and NWP; and Forecasting Process for Polar Lows. It also includes a printable forecasting checklist.
Objectives:
• Recognize the synoptic scale precursors of polar lows
• Recognize the low-level surface features that are conducive to the development of polar lows
• Recognize the development of a polar lows from observations.
• Identify polar lows using satellite imagery
• Understand the limitations of model initialization and output for polar low forecasting
Estimated time to complete: 1.5 h
Includes audio: yes
Required plug-ins:  Flash Flash  RealPlayer RealPlayer  Java Java  Adobe® Reader® Adobe® Reader®
* Plug-in information
Last published on: 2004-04-02
close
|

|
Topics in Precipitation Type Forecasting
description (click to show/hide) |
Quiz
|
 Description: Description:
This module presents an overview of various aspects of precipitation
type forecasting. It includes sections on microphysics and the ice
crystal process, application of partial thickness analysis, application
of the top-down method, and an overview of model algorithms used for
precipitation type analysis.
Objectives:
• Explain the microphysics of snow crystal growth, the interaction of cloud water with
cloud ice, and the important roles of dendrites and aggregation.
• Apply microphysics knowledge to operational settings.
• Apply partial thickness analysis for forecasting precipitation type.
• Apply the top-down Method for forecasting precipitation type.
• Understand the limitations of NWP models in precipitation type forecasts.
Estimated time to complete: 30 min
Includes audio: no
Required plug-ins:  Flash Flash  RealPlayer RealPlayer  Java Java  Adobe® Reader® Adobe® Reader®
* Plug-in information
Last published on: 2005-09-27
close
|

|
Understanding Data Assimilation: How Models Create Their Initial Conditions
description (click to show/hide) |
Quiz
|
 Description: Description:
This module explains the process by which data are used in NWP models and the ever-increasing importance that data assimilation has on the quality of numerical forecasts. It provides learners an appreciation for how models use data as a function of model resolution and data type, how data influence the analysis, the limitations of data assimilation systems, the importance of initial conditions on the quality of NWP guidance, as well as the challenges of assessing the quality of NWP guidance based on the initial conditions.
The subject matter expert for this module is Dr. Ralph Petersen of the National Centers for Environmental Prediction, Environmental Modeling Center (NCEP/EMC).
Estimated time to complete: 3-4 h
Includes audio: yes
Required plug-ins:  Flash Flash  RealPlayer RealPlayer  Java Java  Adobe® Reader® Adobe® Reader®
* Plug-in information
Last published on: 2001-01-31
close
|

|
Understanding Marine Customers
description (click to show/hide) |
Quiz
|
 Description: Description:
This webcast introduces the different marine forecast customers and discusses what forecast information they need to know and why they need to know it. A better understanding of the needs of the marine forecast customer will lead to better daily forecasts.
Objectives:
Objectives
1. Give marine forecasters a basic understanding of who the marine customers are and what their needs are.
2. Understand what is important to the marine customers and why.
3. Understand characteristics of specific water craft types.
Estimated time to complete: 90 min
Includes audio: yes
Required plug-ins:  Flash Flash  RealPlayer RealPlayer  Java Java  Adobe® Reader® Adobe® Reader®
* Plug-in information
Last published on: 2006-11-02
close
|

|
Understanding the Hydrologic Cycle
description (click to show/hide) |
Quiz
|
 Description: Description:
This module helps students gain a basic understanding of the elements of the hydrologic cycle. Making use of illustrations, animations, and interactions, this module examines the basic concepts of the hydrologic cycle including water distribution, atmospheric water, surface water, groundwater, and snowpack/snowmelt.
Objectives:
Develop an understanding of the elements of the hydrologic cycle with the goal of making effective use of data sources and tools for forecasting
Introduction to Hydrologic Cycle:
Define the key features of hydrology and the hydrologic cycle
Name the components of the hydrologic cycle
Describe the basic concept of the Accounting Budget Approach for hydrology
Distribution:
Recognize the four main forms in which water is stored and distributed in the hydrologic cycle
Describe the key features of ocean water
Define the key features of surface water
Define groundwater and describe its key components
Atmospheric Water:
Identify the key processes in atmospheric water
Describe the significance of condensation and precipitation. Identify key methods and tools used in measurement.
Define evaporation and the key methods and tools for measurement. Describe the issues that complicate measurement process.
Define transpiration and describe its role in the rainfall-runoff process
Describe the varied rates of transpiration for different surface vegetation types
Surface Water:
Define the key processes associated with surface water: Infiltration, Soil Moisture, and Runoff
Identify the factors influencing infiltration
Describe the elements of soil composition
Describe possible soil conditions and how they affect infiltration
Define runoff and describe the use of the hydrograph in measuring it
Describe the elements of runoff
Groundwater:
Describe the importance of groundwater for the hydrologic cycle
Describe the characteristics of different types of aquifers
Define recharge
Describe natural and artificial recharge methods
Define withdrawal and describe its effects on a water table
Snowpack and Snowmelt:
Describe the critical role of snow and ice in the hydrologic cycle
Define snow water equivalent, and identify factors affecting snowmelt rate
Describe the key steps in the snowmelt process
Estimated time to complete: 1.5-2 h
Includes audio: yes
Required plug-ins:  Flash Flash  RealPlayer RealPlayer  Java Java  Adobe® Reader® Adobe® Reader®
* Plug-in information
Last published on: 2005-11-07
close
|

|
Unit Hydrograph Theory
description (click to show/hide) |
Quiz
|
 Description: Description:
The role of unit hydrograph theory in the flood prediction process is to provide an estimate of streamflow given the precipitation. A unit hydrograph shows the temporal change in flow, or discharge, per unit of runoff from excess precipitation. In other words, the unit hydrograph shows how the flow of a stream will be affected over time by the addition of one unit of runoff. This module offers a thorough introduction to the use of unit hydrographs and the application of unit hydrograph theory in flood prediction. Through use of rich illustrations, animations, and interactions, this module explains key terminology and assumptions, outlines the steps in creation of a unit hydrograph, examines the issues surrounding application of unit hydrograph theory, and discusses important considerations for forecasters.
Objectives:
1. Define key features of unit hydrographs and of unit hydrograph theory.
• Explain why we need unit hydrographs.
• Describe how unit hydrograph theory is used as a tool in forecasting runoff.
• Define the basic components of a unit hydrograph.
2. Identify important terms and assumptions in unit hydrograph theory.
3. Explain key issues for application of unit hydrograph theory.
• Identify reasons that some precipitation events may not be accurately represented by a unit hydrograph.
• Explain the impact of using English or metric units of measure.
• Describe the process for application of unit hydrographs to storms covering multiple time durations.
4. Recognize the forecast implications of unit hydrograph theory for real precipitation events.
• Describe potential effects on actual hydrograph data based on storm coverage and basin changes.
Estimated time to complete: 1.5-2 h
Includes audio: yes
Required plug-ins:  Flash Flash  RealPlayer RealPlayer  Java Java  Adobe® Reader® Adobe® Reader®
* Plug-in information
Last published on: 2005-12-27
close
|

|
Urban Flooding: It Can Happen in a Flash!
description (click to show/hide) |
Quiz
|
 Description: Description:
This module features an audio and visual tour of sites affected by the Fort Collins, Colorado urban flood that occurred on 28 July 1997. The tour is led by Matthew Kelsch and includes eyewitness accounts of that night's events from John Weaver. This interactive virtual field trip module summarizes many of the important common aspects of flash floods occurring in urban environments.
Estimated time to complete: 60 min
Includes audio: yes
Required plug-ins:  Flash Flash  RealPlayer RealPlayer  Java Java  Adobe® Reader® Adobe® Reader®
* Plug-in information
Last published on: 2001-05-24
close
|

|
Using the WRF Mesoscale Model
description (click to show/hide) |
Quiz
|
 Description: Description:
This module provides insights on how to best use WRF mesoscale model guidance in the forecast process. Using two cases in southwest Asia where AFWA WRF is currently in use, it examines improvements offered by the WRF for forecasting fronts, topographic impacts, precipitation type, and hazards to aviation. The module also discusses some mesoscale model limitations, and offers strategies for transitioning between using mesoscale and global NWP guidance for medium-range forecasts, even when the models differ significantly.
Objectives:
1. Apply knowledge of the unique strengths of high resolution NWP models to guide forecast decisions in the following situations:
1.1 When topography (e.g., elevation change, coastlines, complex terrain) impacts the weather event
1.2 When frontal structure depiction is critical to the forecast
1.3 When forecasting precipitation type
1.4 When forecasting hazards to aviation (e.g., icing, turbulence, visibility)
2. Identify limitations of high-resolution NWP models, and anticipate situations where those limitations will impact the validity of the model guidance. For example, mesoscale models do well in forecasting the character and organization of convection, but not in forecasting timing and location.
3. For forecasts beyond approximately 48 hours, apply knowledge of NWP models, recent model performance, and current trends in the atmospheric evolution to determine a general strategy for transitioning between the use of mesoscale and global NWP guidance, particularly when they differ significantly.
Estimated time to complete: 2.5 h
Includes audio: yes
Required plug-ins:  Flash Flash  RealPlayer RealPlayer  Java Java  Adobe® Reader® Adobe® Reader®
* Plug-in information
Last published on: 2006-11-01
close
|

|
Visible and Infrared Dust Detection Techniques
description (click to show/hide) |
Quiz
|
 Description: Description:
This Webcast, presented by Tom Lee (Naval Research Laboratory, Monterey,
California) demonstrates techniques for dust detection using standard visible and longwave infrared window channels available worldwide on geostationary and polar-orbiting satellite instruments. Several examples from southwest Asia and Africa demonstrate techniques such as using control images, stretching enhancement curves, and using looping to highlight dust features.
Estimated time to complete: 25 min
Includes audio: yes
Required plug-ins:  Flash Flash  RealPlayer RealPlayer  Java Java  Adobe® Reader® Adobe® Reader®
* Plug-in information
Last published on: 2003-10-06
close
|

|
Vorticity Maxima and Comma Patterns
description (click to show/hide) |
Quiz
|
 Description: Description:
Vorticity maxima signatures are very common and indicate areas of ascending circulation and atmospheric forcing. The correct placement of vorticity maxima is vital to the placement of related dynamic features such as the axis of maximum winds and deformation zones. This module is part of the series “Dynamic Feature Identification: The Satellite Palette”.
Objectives:
* Identify and predict the vorticity maxima in order to predict areas of positive vorticity advection
* Identify the related axes of maximum winds, deformation zones and air masses
Estimated time to complete: 30-40 min
Includes audio: no
Required plug-ins:  Flash Flash  RealPlayer RealPlayer  Java Java  Adobe® Reader® Adobe® Reader®
* Plug-in information
Last published on: 2006-05-22
close
|

|
Vorticity Minima and Anticomma Patterns
description (click to show/hide) |
Quiz
|
 Description: Description:
Vorticity minima signatures are common features of the atmosphere. They indicate areas of descending circulation and atmospheric forcing and can be used to diagnose dynamic features such as the axis of maximum winds and deformation zones. This module provides insight on the analysis of these dynamic atmospheric features. This module is part of the series: "Dynamic Feature Identification: The Satellite Palette".
Objectives:
* Identify and predict vorticity minima in order to predict areas of negative vorticity advection
* Identify the related axes of maximum winds, shear zones, deformation zones, and air masses
Estimated time to complete: 30-40 min
Includes audio: no
Required plug-ins:  Flash Flash  RealPlayer RealPlayer  Java Java  Adobe® Reader® Adobe® Reader®
* Plug-in information
Last published on: 2006-05-22
close
|

|
Watersheds: Connecting Weather to the Environment
description (click to show/hide) |
Quiz
|
 Description: Description:
This short course provides broadcast meteorologists with knowledge and instructional materials to help them understand watersheds as our environmental home and to help their viewers understand the relationship between the weather and the health and protection of the environment. Environmental impacts in many areas of the country result from the daily actions of people. We can easily see the consequences of a major oil spill at sea that is driven ashore by winds and ocean currents, but what about the fertilizer that people put on their lawns and the de-icer they apply to their driveway, or changing the car’s oil in the backyard, or the pet waste in the yard or local park? Combined with weather, all of these have an impact on both the local environment and the larger regional environment.
This short course takes a story-telling approach through the use of movie-like sequences of audio and imagery to show how the concept of a watershed can be related to local concerns and to connect it to people in a personal way. The goal of this course is to:
- Provide an understanding of a watershed as the local environment in which people’s actions and decisions play against the background of daily and seasonal weather to affect the quality and health of their local watershed as well as the larger system of watersheds of which their watershed is one part.
Objectives:
- Know how to describe a watershed and locate the watersheds for your viewing region.
- Be able to find the hydrologic address of a watershed and describe how watersheds are interconnected into a river system.
- Be able to relate the concept of a watershed to urban settings.
- Know the distribution of water within a watershed and how to find water sources for a population center in your viewing area.
- Describe how sources of non-point pollution, especially in urban areas, impact water quality.
- Know how human-engineered changes in the watershed affect the location and severity of flooding following heavy precipitation events.
- Be able to relate the impact of drought on a watershed and watershed system.
Estimated time to complete: 2 h
Includes audio: yes
Required plug-ins:  Flash Flash  RealPlayer RealPlayer  Java Java  Adobe® Reader® Adobe® Reader®
* Plug-in information
Last published on: 2006-08-30
close
|

|
Wave Ensembles in the Marine Forecast Process
description (click to show/hide) |
Quiz
|
 Description: Description:
The NCEP Marine Modeling and Analysis Branch (MMAB) Ensemble Global Ocean Wave Forecast System (EGOWaFS) provides five-day forecasts of global winds, wind wave and swell conditions in probabilistic terms. This product became available early in 2007 both through an NCEP non-operational web page and, for raw data, through FTP for use by marine forecasters at NWS WFOs and other locations.
The data from the EGOWaFS can be used in a number of ways, including:
* As input to probabilistic marine forecasts for wind waves and swell
* As input to a local wave ensemble, such as Simulated Waves Nearshore (SWAN)
* As input to develop probabilistic forecasts for rip current development
This webcast has been developed to introduce the EGOWaFS to the marine forecasting community. Topics discussed include:
- The unique basis for ensemble prediction of ocean waves
- Graphics of EGOWaFS product output and their interpretation
- Case examples showing examples of EGOWaFS, including:
- Potential for EGOWaFS forecast bias resulting from systematic errors in wind forcing,
- Use of EGOWaFS data to provide boundary conditions for local near-shore wave models, and
- Application of EGOWaFS data to create a probabilistic forecast for the occurrence of rip currents.
Objectives:
1. Understand that the basis for ocean wave ensemble forecasting depends on the uncertainty in the near-surface wind forecasts, rather than uncertainty in the wave initial conditions.
2. Learn how to use the web-based graphics at NCEP for probabilistic forecasting of ocean waves.
3. Understand how bias in the wind forcing affects wave forecasts.
4. Learn potential uses for the wave ensemble forecasts, including local near-shore wave models and probabilistic forecasts of rip current.
Estimated time to complete: 1 h
Includes audio: yes
Required plug-ins:  Flash Flash  RealPlayer RealPlayer  Java Java  Adobe® Reader® Adobe® Reader®
* Plug-in information
Last published on: 2007-12-03
close
|

|
Wave Life Cycle I: Generation
description (click to show/hide) |
Quiz
|
 Description: Description:
This is the second in a series of training modules on marine wind and waves. The first module discussed wave types and characteristics and is a good primer to this next marine training topic. Wave Life Cycle I: Generation examines how wind creates waves and the inter-relationships between wind speed, wind duration, and fetch length during this process. These three factors are important to predicting wave height and what will limit wave growth. Additional topics include fully developed seas, observation sources, and various special wind events such as coastal jets and instability mixing in the marine boundary layer. While much of this instruction is at a basic level, all marine forecasters will find benefit in the more intermediate and advanced topics. These include the issue of dynamic or “trapped” fetch as well as the use of satellite-based observations of marine winds using the active microwave technique known as scatterometry. User interactions are included throughout the module and within the short case study. The next module in the series will look at propagation and dispersion as the waves leave the generation area.
Objectives:
After completing the module users will be able to:
- Describe how wind generates waves, including how wind speed, fetch length, and duration interact to affect the wave growth process.
- Use a wave nomogram to manually estimate wave height.
- Describe the remote sensing and numerical prediction tools that aid forecasting of wave generation.
- Describe fully developed seas.
- List in situ as well as remote sensing sources of wind observations and describe their capabilities.
- Recall some of the various special wind events such as coastal jets and instability mixing in the marine boundary layer that affect wave generation.
- Describe the issue of dynamic or "trapped" fetch.
Estimated time to complete: 60-90 min
Includes audio: yes
Required plug-ins:  Flash Flash  RealPlayer RealPlayer  Java Java  Adobe® Reader® Adobe® Reader®
* Plug-in information
Last published on: 2005-07-14
close
|

|
Wave Life Cycle II: Propagation & Dispersion
description (click to show/hide) |
Quiz
|
 Description: Description:
The goal of the module is to enable a marine forecaster to manually predict how the wave height and period will change as the waves leave their generation area, become swell, and then propagate and disperse into the forecaster’s offshore coastal waters. While numerical wave prediction models can provide swell height and period forecasts, they are dependent on accurate wind forecasts by atmospheric prediction models. Therefore, manual skills in determining swell height and period are needed in order to cross-check or correct model predictions in cases of poor or unresolved model forecasts of winds. The module starts by discussing how swell propagate along great circle tracks and how these tracks will look different on various map projections. With this in mind the concept of developing a known “swell window” for a given location is introduced. Next, the module uses conceptual animations to demonstrate the effects of dispersion on the swell group as it propagates over a long distance. Also discussed are nonlinear processes, wave steepness, travel time, event duration, and opposing winds. Then the module explains how swell height changes due to angular spreading of wave energy and provides a simplified method to calculate this change. Finally, users are able to test their new understanding of these concepts through a short exercise where they are asked to determine swell height and period at multiple locations. User interactions are included throughout the module and within the short exercise. This is the third in a series of training modules on marine wind and waves. It follows the “Wave Types and Characteristics” and “Wave Generation” modules.
Objectives:
1.State the difference between seas and swell.
2.Recognize that waves propagate along great circle tracks and that these tracks look different on various 2-dimensional map projections.
3.Consider the effects of diffraction around barriers in forecasting swell heights.
4.Identify the effects of dispersion on a wave group, including:
a. waves become sorted by wave period
b. longer period waves outrun shorter period waves
c. swell height and steepness decrease
d. the wave group expands in space
e. the time it takes the entire wave group to pass a point increases
5.Explain how significant swell period can lengthen over time due to nonlinear interactions and dispersion, while individual swell period is conserved.
6.Given initial swell period, propagation distance, and fetch width, use a nomogram to forecast the change in significant swell period due to dispersion of a wave group.
7.Given initial or final swell period, propagation distance, and fetch width, use a swell travel time chart to forecast the time a swell to begin to impact a destination.
8.Using a swell travel time chart, forecast the length of time a wave group will affect a coastal area.
9.Given significant wave height for waves propagating in the central direction of a fetch area, forecast the decrease in significant wave height due to angular spreading for locations up to 70 degrees off the central direction of the wave group.
Estimated time to complete: 60 min
Includes audio: yes
Required plug-ins:  Flash Flash  RealPlayer RealPlayer  Java Java  Adobe® Reader® Adobe® Reader®
* Plug-in information
Last published on: 2006-01-12
close
|

|
Wave Types and Characteristics
description (click to show/hide) |
Quiz
|
 Description: Description:
This is the first in a series of new marine meteorology modules based on COMET’s old laser disk and CD-ROM modules on marine meteorology. This module is an introduction to waves and their associated characteristics. Several types of waves are presented, from the common wind wave to the rare tsunami wave. The basic physical, mathematical, and statistical traits of waves are discussed, along with how they change once waves become swell. This material serves as a building block to subsequent modules on wave generation, propagation, and dispersion.
Objectives:
After completing the module users will be able to:
- Recall the different wave types based on their different generation sources.
- Describe the physical characteristics of these different wave types, including anatomy and nomenclature
- Recall the mathematical expressions and equations that define physical characteristics
- Recall the statistical traits (i.e., wave spectrum and height
classifications) of waves.
- Describe the processes related to swell travel and dispersion.
Estimated time to complete: 1 h
Includes audio: yes
Required plug-ins:  Flash Flash  RealPlayer RealPlayer  Java Java  Adobe® Reader® Adobe® Reader®
* Plug-in information
Last published on: 2003-07-31
close
|

|
Weather and Road Management
description (click to show/hide) |
Quiz
|
 Description: Description:
Anticipating and dealing with weather and the hazards it creates is a real challenge for those in departments of transportation. This module gives road and highway managers a basic understanding of meteorology and weather hazards so that they can better interpret weather forecast information used to make road management decisions. The module also highlights web-based forecast products available from the National Weather Service that can help in the decision-making process.
Objectives:
* Understand what creates and modifies weather
* Define common terms used in meteorology and weather forecasting
* Given two different sources of weather information, decide which one is the best to use at a given time.
* Identify which NWS data and forecast products available on the Web can be used to help make road management decisions
* For different weather events, define terms commonly used and describe conditions that make road travel hazardous.
Estimated time to complete: 2-3 h
Includes audio: yes
Required plug-ins:  Flash Flash  RealPlayer RealPlayer  Java Java  Adobe® Reader® Adobe® Reader®
* Plug-in information
Last published on: 2008-07-21
close
|

|
Weather and the Built Environment
description (click to show/hide) |
Quiz
|
 Description: Description:
This short course provides broadcast meteorologists, educators, and the public with an overview of the evolution of our modern urban environment with a focus on impacts on the urban watershed, air quality, and climate. This course complements the course Watersheds: Connecting Weather to the Environment and both are part of the Earth Gauge™ environmental curriculum for weathercasters and educators. This curriculum is being developed by the National Environmental Education Foundation (NEEF). [See http://www.earthgauge.net/wp/]
Unit 1, Where We Live, takes a look at past and current U.S. growth patterns and the way our urban areas have evolved from compact population centers to automobile-dependent sprawl. Unit 2, Impacts on the Watershed, explores how the built environment affects the water that moves through an urban watershed. Unit 3, Impacts on the Atmosphere, highlights the way our urban landscape and industrial activities impact the air we breathe and the local climate. Each unit includes information on ways to reduce our impact on our water and air with ideas ranging from simple changes in our commuting and housekeeping habits to changes in how we build houses and roads.
Objectives:
Unit 1: Where We Live
* Understand current growth trends in the United States
* Become aware of the geographic extent and patterns of current growth trends
* Recognize some of the historically significant growth patterns.
* Understand the evolution of American cities and the factors that have driven their growth
Unit 2: Impacts on the Watershed
* Identify aspects of the built environment that are impacted by heavy precipitation events
* Explain the relationship of landscaping and developed land features to maintaining water quality
* Gain an understanding of "low impact" and other site design measures as they relate to improving both water quality and quantity
Unit 3: Impacts on the Atmosphere
* Define the urban heat island (UHI) effect
* List the main mechanisms that cause the UHI
* Describe the climatology of the UHI
* List actions that can mitigate the UHI
* List the major source of air pollutants
* List the five air pollutants monitored by the AIRNow daily air quality index
* Recognize weather conditions that negatively impact air quality
* Become aware of personal actions that can reduce air pollution
Estimated time to complete: 60 min
Includes audio: yes
Required plug-ins:  Flash Flash  RealPlayer RealPlayer  Java Java  Adobe® Reader® Adobe® Reader®
* Plug-in information
Last published on: 2008-02-22
close
|

|
West Coast Fog
description (click to show/hide) |
Quiz
|
 Description: Description:
This is part of the Physical Processes Professional Competency Unit of the Forecasting Low-Altitude Clouds and Fog for Aviation Operations Professional Development Series. West Coast Fog discusses the climatology, physical
processes, and evolution of hot spell fogs along the U.S. West Coast.
Objectives:
The goal of this training module is to help you increase your understanding of how radiation fog forms, grows, and dissipates. Such understanding, in turn, can help you more efficiently and accurately evaluate the ability of a given atmospheric environment to generate and/or maintain radiation fog.
Performance Objectives
With Regard to Climatology
Basic Level Competencies:
• Identify coastal regions worldwide where (west coast-type) fogs occur
• For each region, state the seasons of highest and lowest frequency
With Regard to the Preconditioning Environment:
Basic Level Competencies:
• Identify typical synoptic-scale patterns associated with preconditioning processes that prepare the coastal environment for fog formation
• List low-level and sea surface conditions that are typically present prior to onset of the fog formation cycle
Advanced Level Competencies:
• Sequence key processes and events that occur during the preconditioning phase
• Demonstrate an understanding of how/why the surface inversion forms as a result of hot dry offshore winds
• Describe* how/why/where coastal upwelling occurs
With Regard to Formation:
Basic Level Competencies:
• Identify typical synoptic-scale pattern transitions associated with the formation phase
• Identify the key processes and events that occur during fog formation.
Advanced Level Competencies:
• Apply rules that describe the relationships between SST, inversion base, LCL, MCL, etc.
With Regard to Growth and Maturity:
Basic Level Competencies:
Describe the continued deepening and horizontal growth of the fog
• State the typical maximum height that the inversion can reach with cloud still extending to the surface
• Describe diurnal cycles (including stratus raising/lowering)
Advanced Level Competencies:
• Demonstrate an understanding of the roles that coastal surges can play
With Regard to Fog Dissipation and/or Stratus formation:
Basic Level Competencies:
• List processes that can result in fog dissipation (advection over land, warmer water, synoptic systems, solar radiation, the start of a new cycle)
• Identify typical synoptic-scale patterns that can destroy fog regimes in MBL
• Sequence the major events that comprise the ~15-day warm season fog cycle in this region
Advanced Level Competencies:
• Describe how the fog erodes upward to form the marine stratus regime that was present prior to fog formation
• State general rule regarding relationship between sun angle and fog dissipation through insolation
• Demonstrate an understanding of how/why dissipation occurs when the MCL reaches the base of the inversion
Estimated time to complete: 1 hr
Includes audio: no
Required plug-ins:  Flash Flash  RealPlayer RealPlayer  Java Java  Adobe® Reader® Adobe® Reader®
* Plug-in information
Last published on: 2000-09-29
close
|

|
What Can You Expect From the Eta-12?
description (click to show/hide) |
No Quiz
|
 Description: Description:
The NCEP Eta model is now running with a grid spacing of 12 km and mixed-phase microphysics which includes advection of falling condensate. What have we learned so far about what the model is and is not capable of forecasting well? This session focuses on case examples illustrating various aspects of model performance related to how the model parameterizations work and how much detail related to topography and surface forcing can be seen in the model fields. Some forecast verification statistics are also shown for different regions, indicating regional variation in performance related to the topics discussed. A model fix to heat fluxes through snowcover is explained and its impact on the forecast and analysis is shown. Finally, two new developments being tested are summarized - use of a nonhydrostatic, hybrid sigma-pressure coordinate model for the high-resolution window runs and interfacing with the HYSPLIT dispersion model for use in emergency hazardous release situations.
Estimated time to complete: 75 min
Includes audio: yes
Required plug-ins:  Flash Flash  RealPlayer RealPlayer  Java Java  Adobe® Reader® Adobe® Reader®
* Plug-in information
Last published on: 2000-04-26
close
|

|
Winds in the Marine Boundary Layer: A Forecaster's Guide
description (click to show/hide) |
Quiz
|
 Description: Description:
This module is intended for experienced forecasters moving from a land-based area to a coastal or Great Lakes region where both over-land and over-water forecast areas exist. This module highlights the differences between marine boundary layer and terrestrial boundary layer winds. The experienced forecaster is relatively familiar with the boundary layer over land and the associated implications for the wind field. Using this as a base, the module compares this known quantity with the lesser-known processes that occur in the marine boundary layer. Three major topics that influence marine boundary layer winds are discussed: stability within the boundary layer, isallobaric influence, and the effects of convection and tropical cyclones.
Objectives:
• Highlight the major differences between boundary-layer winds in the marine and over-land environments.
• Examine surface wind differences in stable and unstable boundary layers.
• Examine how the stability profile changes seasonally and diurnally.
• Assess the impact of isallobaric wind effects in a marine setting.
• Identify the main impacts of severe convection on marine winds.
• Recognize known model biases in predicting marine boundary layer winds and what situations require the forecaster to make adjustments.
Estimated time to complete: 2 h
Includes audio: no
Required plug-ins:  Flash Flash  RealPlayer RealPlayer  Java Java  Adobe® Reader® Adobe® Reader®
* Plug-in information
Last published on: 2006-12-01
close
|

|
Writing Effective TAFs
description (click to show/hide) |
Quiz
|
 Description: Description:
This module provides an overview of some of the applicable TAF Amendment and Conditional Group usage rules, as presented in the latest version of the National Weather Service Instruction 10-813 on TAF directives. It also presents a methodology for TAF writing and development that will lead to an effective and user-friendly product. The focus is on the ceiling and visibility aspects of the TAF. This module is part of the Distance Learning Course 1: Forecasting Fog and Low Stratus.
Objectives:
• Develop an understanding and appreciation for how TAF construction (intelligent vs. excessive use of TEMPO and PROB groups) may impact your aviation customers
• Develop skills in writing an effective “practical” TAF that provides an improved forecast of expected flight category changes, while maintaining a customer-friendly format. Compare effective vs. poor TAF structures for a given scenario
• Develop concise TAFs with sparing use of change or conditional groups such as TEMPO and PROB, as we’ll practice in two small case exercises
Estimated time to complete: 2 h
Includes audio: no
Required plug-ins:  Flash Flash  RealPlayer RealPlayer  Java Java  Adobe® Reader® Adobe® Reader®
* Plug-in information
Last published on: 2003-06-28
close
|

|
Writing TAFs for Convective Weather
description (click to show/hide) |
Quiz
|
 Description: Description:
"Writing TAFs for Convective Weather" uses a case to show how special tools and techniques can be used to produce a Practically Perfect TAF (PPTAF) for convection. The unit examines how to create TAFs for different types of convection and how to effectively communicate logic and uncertainty in an aviation forecast discussion (AvnFD) or by other means. It also addresses maintaining an effective TAF weather watch and updating the TAF proactively.
Objectives:
1. Describe how general convective hazards might impact airport operations.
2. Describe how the unique characteristics of each convective type relate to creating a TAF.
3. List the strengths and weaknesses of using BUFKIT, aircraft weather data, AWIPS Time-of-Arrival (TOA)/Lead Time and Time Series tools, satellite data, climatology, and other special tools for creating a TAF for convection.
4. Explain why the PPTAF procedure needs to be revised for convection and why the use of special tools is so important for this process.
5. Produce a PPTAF for a mesoscale convective system, air mass thunderstorms, supercell thunderstorms, or microbursts
6. Effectively articulate forecast logic and uncertainty about a TAF in an Aviation Forecast Discussion (AvnFD).
7. Ensure a TAF is consistent with previous TAFs or other products issued by both local offices and national centers.
8. Be able to run an effective weather watch by identifying beforehand when a TAF update is warranted.
9. Show the ability to update proactively, rather than in a reactive fashion.
10. Identify when coordination is necessary for the TAF and with whom it should be conducted.
Estimated time to complete: 2 h
Includes audio: no
Required plug-ins:  Flash Flash  RealPlayer RealPlayer  Java Java  Adobe® Reader® Adobe® Reader®
* Plug-in information
Last published on: 2007-07-31
close
|
return to top^
Spanish
content level: 0=for non-scientists, 1=basic, 2=intermediate, 3=advanced
| Level |
Module Title and Link |
Quiz Link |

|
Análisis de frecuencia de crecidas
description (click to show/hide) |
Quiz
|
 Description: Description:
Este módulo presenta el uso del análisis de frecuencia de crecidas para la predicción y planificación en caso de inundaciones. El módulo emplea ilustraciones atractivas, animaciones y materiales interactivos para explicar los conceptos básicos, los problemas de fondo y los métodos para analizar los datos de crecidas. Se presentan también conceptos comunes, como las inundaciones de 100 años y los períodos de retorno, así como los asuntos que influyen en la representación estadística de las crecidas. También se cubren los métodos comunes de análisis de los datos de crecidas, así como una descripción general de los eventos de diseño. Como módulo de tema fundamental del futuro curso básico de ciencias hidrológicas, se puede estudiar de forma independiente, aunque estará también disponible como tema de apoyo desde cualquiera de los módulos planeados basados en casos reales.
Objectives:
Explicar los conceptos clave del análisis de frecuencia de crecidas:
* definir el concepto de período de retorno (p. ej., la avenida de 100 años);
* explicar la probabilidad de excedencia o de ocurrencia y su relación con el período de retorno;
* comprender la dos aplicaciones principales de los análisis de frecuencia de crecidas.
Comprender los conceptos clave que influyen en la representación estadística de las crecidas:
* explicar cómo el período de datos históricos afecta la guía de frecuencia de crecidas;
* calcular la probabilidad de ocurrencia o no excedencia de una crecida de determinada magnitud en un período de tiempo dado;
* comprender cómo los cambios realizados en las cuencas de drenaje afectan las características y la frecuencia de las crecidas, y reducen el período de datos históricos.
Aplicar métodos comunes de análisis de los datos de crecidas:
* explicar los conceptos básicos de las series de duración anual y parcial;
* realizar un análisis de frecuencia a partir del caudal máximo registrado para un río.
Explicar el propósito y el uso de los eventos de proyecto:
* identificar el motivo por usar eventos de proyecto;
* comprender la utilidad de los eventos de proyecto y sus limitaciones y restricciones;
* explicar el concepto de evento de precipitación máxima probable;
* comprender el concepto de avenida de proyecto estándar.
Estimated time to complete: 1-2 h
Includes audio: yes
Required plug-ins:  Flash Flash  RealPlayer RealPlayer  Java Java  Adobe® Reader® Adobe® Reader®
* Plug-in information
Last published on: 2007-08-29
close
|

|
Aplicaciones satelitales multiespectrales: el ciclo de vida de los incendios en zonas despobladas
description (click to show/hide) |
Quiz
|
 Description: Description:
Este módulo describe los sensores y productos satelitales actuales y futuros empleados en la observación del ciclo de vida de los incendios, con énfasis en los satélites en órbita polar. La información de los productos se presenta en el contexto del ciclo de vida de los incendios: evaluación del ambiente antes y después del incendio para detectar y observar los incendios activos, el humo y los aerosoles. La información de los productos también se consolida en la suite de productos de incendios (Fire Product Suite) de MODIS, que se incluye en el módulo y en formato PDF. El módulo concluye con un caso de estudio interactivo sobre un incendio que incluye las observaciones de un pronosticador del National Weather Service que trabajó directamente en ese incendio. El módulo está pensado para la amplia gama de personas cuyo trabajo requiere considerar la detección y observación de incendios descontrolados, como la administración de usos del suelo, hidrología, meteorología e investigación científica.
Objectives:
Objetivos del módulo:
• Demostrar las ventajas y limitaciones de usar el análisis multisensor y multiespectral para observar el ciclo de vida de los incendios.
• Describir algunos de los productos y sistemas de percepción remota empleados para detectar y vigilar el ciclo de vida de los incendios en zonas despobladas. Para cada producto, identificar sus posibilidades, limitaciones y aplicaciones.
• Identificar las regiones de emisión térmica de uso común en los satélites en órbita polar y geoestacionarios para detectar los incendios.
• Identificar y comparar las posibilidades y limitaciones de los satélites geoestacionarios y en órbita polar, de las imágenes de onda corta y onda larga, y de los productos en color real y falso para detectar y observar el ciclo de vida de los incendios.
• Identificar los pasos esenciales del pronóstico automatizado y semiautomatizado de humo.
• Identificar las posibilidades del sensor VIIRS del sistema de satélites polares NPOESS en lo referente al ciclo de vida de los incendios.
Estimated time to complete: 1.5 – 2 h
Includes audio: no
Required plug-ins:  Flash Flash  RealPlayer RealPlayer  Java Java  Adobe® Reader® Adobe® Reader®
* Plug-in information
Last published on: 2008-02-01
close
|

|
Caso de estudio de pronóstico fluvial
description (click to show/hide) |
Quiz
|
 Description: Description:
Este módulo guía al usuario a través de las consideraciones que fueron necesarias en el proceso de decisión al generar los pronósticos fluviales asociados con los restos del huracán Ivan entre el 17 y el 19 de septiembre de 2004 para el sistema fluvial del río Susquehanna en Pennsylvania y Nueva York, EE.UU. El módulo ayuda a aplicar los conceptos cubiertos en los temas fundamentales del Curso Básico de Hidrología. Entre otros, se tratan los siguientes temas específicos relevantes para este caso de estudio: condiciones del suelo, impacto del pronóstico cuantitativo de la precipitación (PCP) en la escorrentía, modelos de escorrentía, procesos de escorrentía, propagación o tránsito de caudales y relaciones nivel-caudal. También se consideran las observaciones de las condiciones aguas arriba y las comparaciones con las puntas de crecida históricas en términos de ayuda para tomar decisiones de pronósticos operativos de avenidas. Debido a que este módulo supone ciertos conocimientos previos de principios hidrológicos, recomendamos estudiar los temas fundamentales centrales como requisito previo.
Objectives:
1. Describir las condiciones hidrológicas de la cuenca del río Susquehanna antes de los eventos asociados con el paso de los restos de huracán Ivan en la cuenca del río Susquehanna entre el 17 y 19 de septiembre de 2004:
* describir la geografía local y su impacto en la escorrentía generada por la tormenta;
* usar la climatología como referencia para identificar las posibles repercusiones de la tormenta;
* describir la textura del suelo, el perfil del suelo y las condiciones de cubierta vegetal de la región;
* analizar los niveles de la humedad del suelo antecedente para la zona.
2. Analizar la lluvia observada y pronosticada, los factores que influyen en la escorrentía y los pronósticos fluviales iniciales para el río Susquehanna antes de este evento:
* analizar la información sobre la lluvia y el suelo y anticipar su impacto en la escorrentía;
* interpretar la información sobre escorrentía generada por los modelos fluviales;
* anticipar cómo los errores de PCP pueden afectar la magnitud de la escorrentía.
3. Aplicar los conocimientos sobre los procesos de escorrentía y el modelado fluvial a los caudales observados e históricos con el fin de generar un pronóstico para el río Susquehanna en Wilkes-Barre:
* analizar y anticipar los mecanismos de escorrentía predominantes durante el desarrollo de un episodio de crecida;
* examinar las contribuciones relativas de los distintos componentes del hidrograma del pronóstico;
* examinar el impacto de los cambios en la precipitación sobre la punta de avenida esperada;
* analizar el impacto de los errores en el pronóstico de precipitación sobre los errores del pronóstico de escorrentía;
* anticipar el impacto de la escorrentía propagada desde zonas aguas arriba;
* usar observaciones e información histórica para evaluar la probabilidad de un evento extremo pronosticado;
* interpretar y ajustar la guía de los modelos de pronóstico fluvial;
* emitir un pronóstico fluvial pese a las incertidumbres;
* comprender la importancia de la experiencia para el proceso de creación de un pronóstico.
4. Evaluar las lecciones aprendidas durante el proceso de pronóstico hasta y durante este evento de crecida:
* validar la actuación del modelo de pronóstico fluvial para el nivel máximo de crecida;
* interpretar el aporte de los distintos componentes del modelo fluvial al pronóstico y sus errores;
* explicar el importante papel de las curvas de gastos;
* relacionar este evento a eventos pasados de crecidas importantes.
Estimated time to complete: 120 min
Includes audio: yes
Required plug-ins:  Flash Flash  RealPlayer RealPlayer  Java Java  Adobe® Reader® Adobe® Reader®
* Plug-in information
Last published on: 2007-08-29
close
|

|
Casos de estudio de inundaciones repentinas
description (click to show/hide) |
Quiz
|
 Description: Description:
Este módulo guía al usuario a través de siete casos de estudio de eventos de inundación repentina que ocurrieron en la región continental de los EE.UU. entre 2003 y 2006. Se presentan los casos siguientes:
* 30-31 de agosto de 2003: Condados de Chase y Lyon, Kansas
* 16-17 de septiembre de 2004: Condado de Macon, Carolina del Norte
* 31 de julio de 2006: Montañas de Santa Catalina, cerca de Tucson, Arizona
* 25 de diciembre de 2003: Zona quemada cerca de San Bernardino, California
* 30 de agosto de 2004: Inundación repentina urbana en Richmond, Virginia
* 19-20 de agosto de 2003: Inundación repentina urbana en Las Vegas, Nevada
* 9 de octubre de 2005: Condado de Cheshire, Nueva Hampshire
Este módulo ayuda al usuario a aplicar los conceptos cubiertos en los temas fundamentales del curso Curso Básico de Hidrología. Entre otros, se tratan los siguientes temas específicos relevantes para estos casos de estudio: características físicas de las cuencas que las hacen propensas a las inundaciones repentinas, respuesta de las cuencas a la precipitación, orientación para inundaciones repentinas, o FFG (Flash Flood Guidance), relación entre incendio descontrolados e inundaciones repentinas y relación entre urbanización e inundaciones repentinas. Los casos de estudio tocan también otros temas relacionados, como estimaciones cuantitativas de precipitación por radar, productos de monitorización y predicción de inundaciones repentinas (FFMP) del National Weather Service, flujos de escombros, agua retenida y comunicaciones entre distintas agencias. Debido a que este módulo supone ciertos conocimientos previos de principios hidrológicos, recomendamos estudiar los temas fundamentales centrales como requisito previo. En particular, los módulos Procesos de escorrentía y Procesos de inundación repentina contienen material directamente relacionado con estos casos de estudio.
Objectives:
1. Comprender la respuesta hidrológica frente a las lluvias intensas que lleva a escorrentía rápida e inundaciones repentinas.
2. Reconocer la utilidad y las limitaciones de las herramientas de pronóstico de inundaciones repentinas del NWS (FFMP, FFG, QPE de radar).
3. Comprender que las cuencas propensas a inundaciones repentinas pueden ser muy pequeñas.
4. Identificar la característica señal de tormenta de centroide de eco bajo (Low Echo Centroid, LEC) y entender lo que implica en términos de producción de lluvia.
5. Comprender la utilidad y las limitaciones de diferentes relaciones Z-R.
6. Reconocer la información proporcionada por la herramienta de monitorización y predicción de inundaciones repentinas (FFMP) aguas arriba y aguas abajo.
7. Recordar cómo y por qué la lluvia indicada por el software FFMP para una cuenca puede ocultar problemas de radar, como las barreras topográficas.
8. Considerar formas de utilizar otros datos en áreas donde hay barreras topográficas que obstruyen el haz del radar.
9. Comprender el posible impacto de un incendio en la hidrología de la cuenca.
10. Recordar que una inundación repentina puede provocar flujos de escombros.
11. Comprender que en algunas circunstancias puede ser apropiado modificar los valores de orientación para inundaciones repentinas (FFG).
12. Reconocer la información importante que brindan los campos de diferencias y razones de la herramienta de monitorización y predicción de inundaciones repentinas (FFMP).
13. Estar consciente de los importantes esfuerzos colaborativos entre el NWS y otras agencias, como el Servicio Geológico de EE.UU. (USGS).
14. Comprender el enorme impacto que el desarrollo urbano y suburbano puede tener en la respuesta de una cuenca.
15. Comprender cómo y por qué puede ser necesario modificar los valores de orientación para inundaciones repentinas (FFG) en zonas urbanas.
16. Anticipar la pequeña demora temporal entre el máximo de intensidad de la lluvia y el nivel máximo de las aguas de inundación en zonas urbanas.
17. Reconocer que pueden ocurrir inundaciones repentinas aguas abajo de las cuencas que reciben las lluvias más intensas.
18. Reconocer el potencial de inundaciones repentinas provocado por la liberación súbita del agua que se halla detenida en estructuras diseñadas por el ser humano.
19. Reconocer la importancia de las comunicaciones entre distintas agencias antes y durante un evento de inundación repentina, especialmente los que implican fallos estructurales.
Estimated time to complete: 1 h
Includes audio: yes
Required plug-ins:  Flash Flash  RealPlayer RealPlayer  Java Java  Adobe® Reader® Adobe® Reader®
* Plug-in information
Last published on: 2007-10-04
close
|

|
Ciclo de vida de las olas I: generación
description (click to show/hide) |
Quiz
|
 Description: Description:
Éste es el segundo de una serie de módulos de formación acerca de vientos marinos y olas. En el primer módulo, que ofrece una buena introducción a este tema de capacitación marina, tratamos los tipos de olas y sus características. Este módulo examina cómo el viento crea las olas y la interrelación entre la velocidad, la duración y el alcance del viento en este proceso. Estos tres factores son importantes para predecir la altura de las olas y los factores que limitarán el crecimiento de las olas. Entre los demás temas cubiertos se incluyen mares de desarrollo completo, fuentes de observación y varios eventos especiales relacionados con los vientos, como los chorros costeros y la mezcla por inestabilidad en la capa límite marina. Aunque buena parte de este material se presenta a un nivel de instrucción básico, todos los pronosticadores marinos aprovecharán los temas de nivel intermedio y avanzado, como el problema de alcance de los vientos dinámicos o “atrapados”, así como el uso de las observaciones satelitales de los vientos marinos mediante la técnica activa de microondas denominada dispersometría. El módulo y el breve caso de estudio requieren la interacción del usuario. El próximo módulo de esta serie considerará la propagación y dispersión a medida que las olas salen del área de generación.
Objectives:
Después de terminar el módulo, el usuario podrá:
- describir cómo el viento genera la olas y cómo la interacción entre los aspectos de velocidad del viento, longitud del alcance o zona de generación de olas y duración afecta el proceso de crecimiento de las olas;
- usar un nomograma de oleaje para estimar manualmente la altura de las olas;
- describir las herramientas de percepción remota y de predicción numérica que ayudan a pronosticar la generación de olas;
- describir el concepto de mar completamente desarrollada;
- enumerar las fuentes de observaciones del viento in situ y de percepción remota y describir sus capacidades;
- recordar algunos de los varios tipos de fenómenos eólicos que afectan la generación de olas, como los chorros costeros y la mezcla por inestabilidad en la capa límite marina;
- describir el concepto de alcance dinámico o "atrapado".
Estimated time to complete: 60 - 90 min
Includes audio: yes
Required plug-ins:  Flash Flash  RealPlayer RealPlayer  Java Java  Adobe® Reader® Adobe® Reader®
* Plug-in information
Last published on: 2007-08-22
close
|

|
Ciclo de vida de las olas II: propagación y dispersión
description (click to show/hide) |
Quiz
|
 Description: Description:
El objetivo del módulo es enseñar a predecir manualmente cómo la altura y el período de las olas cambia a medida que éstas salen del área de generación, se convierten en oleaje y luego se propagan y se dispersan en las aguas costeras contiguas a la zona de pronóstico. Aunque los modelos numéricos de predicción de olas pueden generar pronósticos de altura y período de oleaje, dependen de la precisión de los pronósticos de vientos de los modelos de predicción atmosférica. Por lo tanto, se necesita cierta destreza para determinar la altura y período del oleaje en forma manual para comprobar o corregir las predicciones del modelo cuando el pronósticos numérico del viento es poco confiable o inconcluso. El módulo comienza con una discusión sobre la propagación del olejae a lo largo de trayectorias de círculo máximo y cómo dichas trayectorias se ven distintas en diferentes proyecciones cartográficas. Con esto en mente, se presenta el concepto de desarrollar una “ventana de oleaje” conocida para un lugar determinado. A continuación, el módulo emplea animaciones conceptuales para demostrar los efectos de la dispersión en el grupo de oleaje a medida que se propaga sobre largas distancias. También se tratan procesos no lineales, inclinación de las olas, tiempo de viaje, duración del evento y vientos de oposición. Luego se explica el cambio en el oleaje debido a la dispersión angular de la energía de las olas y se proporciona un método simplificado para calcular este cambio. Finalmente, un breve ejercicio que implica determinar la altura y el período del oleaje en distintos lugares permite someter a prueba los conocimientos adquiridos de estos conceptos. Tanto el breve ejercicio como varias otras partes del módulo incluyen material interactivo. Éste es el tercero de una serie de módulos de capacitación sobre vientos y olas marinas. Los primeros dos son Tipos de olas y sus características y Ciclo de vida de las olas I: generación.
Objectives:
1. Establecer la diferencia entre mar local y oleaje.
2. Reconocer que las olas se propagan a lo largo de trayectorias de círculo máximo y que dichas trayectorias se ven diferente según la proyección cartográfica bidimensional utilizada.
3. Considerar los efectos de difracción que producen las barreras cuando se hacen pronósticos de altura del oleaje..
4. Identificar los efectos producidos por la dispersión en un grupo de olas, incluyendo los siguientes:
a. las olas se organizan acorde con su período
b. las olas de período largo dejan rezagadas las olas de período corto
c. la altura y pendiente del oleaje disminuyen
d. los grupos de olas se expanden en el espacio
e. el tiempo que tarda un grupo completo de olas en pasar por un punto aumenta
5. Explicar cómo el período significativo del oleaje aumenta con el tiempo debido a interacciones no lineales y dispersión, mientras que el período de cada oleaje se conserva.
6. Utilizar un nomograma para pronosticar el cambio en el período significativo de un oleaje debido a la dispersión del grupo de olas conociendo el período inicial, la distancia de propagación y el ancho de la zona de generación.
7. Utilizar un mapa de tiempo de viaje de oleaje para pronosticar el momento en que un grupo de olas empezará a afectar un lugar conociendo el período inicial o final del oleaje, la distancia de propagación y el ancho de la zona de generación.
8. Utilizar un mapa de tiempo de viaje de oleaje para pronosticar cuánto tiempo un grupo de olas afectará un área costera.
9. Pronosticar la disminución de la altura significativa de una ola debido a la dispersión angular en sitios localizados dentro de un área a hasta 70 grados de la dirección central del grupo de olas conociendo la altura significativa de las olas que se desplazan en la dirección central del área de generación.
Estimated time to complete: 60 min
Includes audio: no
Required plug-ins:  Flash Flash  RealPlayer RealPlayer  Java Java  Adobe® Reader® Adobe® Reader®
* Plug-in information
Last published on: 2008-02-19
close
|

|
Comprensión del ciclo hidrológico
description (click to show/hide) |
Quiz
|
 Description: Description:
Este módulo, que representa la primera entrega del Curso Básico de Hidrología, ayuda al estudiante a desarrollar un nivel básico de comprensión de los elementos del ciclo hidrológico. El módulo emplea ilustraciones, animaciones y materiales interactivos para examinar los conceptos básicos del ciclo hidrológico, como la distribución del agua, el agua atmosférica, el agua de superficie, al agua subterránea y la acumulación y el derretimiento de nieve.
El Curso Básico de Hidrología permite comprender los conceptos principales de hidrología y su aplicación a las predicciones hidrológicas. Como este módulo es el primero de los temas fundamentales del curso, se puede estudiar de forma independiente, aunque estará también disponible como tema de apoyo desde cualquiera de los módulos planeados basados en casos reales.
Objectives:
Desarrollar un cierto grado de comprensión de los elementos del ciclo hidrológico con el fin de utilizar las herramientas y fuentes de datos de forma más eficaz al generar sus pronósticos.
Introducción al ciclo hidrológico:
• Definir los aspectos más importantes de la hidrología y del ciclo hidrológico
• Nombrar los componentes del ciclo hidrológico
• Describir el concepto básico del balance hídrico en hidrología
Distribución:
• Reconocer las cuatro formas principales en que el agua se almacena y se distribuye en el ciclo hidrológico
• Describir las características más importantes del agua oceánica
• Definir las características más importantes del agua de superficie
• Describir el agua subterránea o freática y definir sus componentes más importantes
Agua atmosférica:
• Identificar los procesos más importantes del agua atmosférica
• Describir la importancia de la condensación y precipitación; identificar los métodos y herramientas más importantes empleados en su medición
• Definir la evaporación y los métodos y herramientas más importantes para su medición
• Describir los problemas que complican el proceso de medición
• Definir la transpiración y describir su papel en el proceso de lluvia y escorrentía
• Describir las distintas tasas de transpiración para diferentes tipos de vegetación superficial
Agua superficial:
• Definir los procesos más importantes asociados con el agua superficial: infiltración, humedad del suelo, escorrentía
• Identificar los factores que influyen en la infiltración
• Describir los elementos que componen el suelo
• Describir las posibles condiciones del suelo y cómo influyen en la infiltración
• Definir la escorrentía y describir el uso del hidrograma para medirla
• Describir los elementos de la escorrentía
Agua subterránea:
• Describir la importancia del agua subterránea en el ciclo hidrológico
• Describir las características de distintos tipos de acuíferos
• Definir el proceso de recarga
• Describir los métodos de recarga natural y artificial
• Definir la extracción y describir sus efectos en el nivel freático
Capa de nieve y deshielo:
• Describir el importante papel de la nieve y del hielo en el ciclo hidrológico
• Definir el equivalente en agua de la nieve e identificar los factores que afectan a la velocidad de deshielo
• Describir los pasos más importantes del proceso de deshielo
Estimated time to complete: 30 min
Includes audio: no
Required plug-ins:  Flash Flash  RealPlayer RealPlayer  Java Java  Adobe® Reader® Adobe® Reader®
* Plug-in information
Last published on: 2006-08-03
close
|

|
Consideraciones de meteorología sinóptica: pronósticos de nieblas y estratos bajos
description (click to show/hide) |
Quiz
|
 Description: Description:
Para evaluar si es posible que se produzca un episodio de niebla o estratos, debemos evaluar los factores de escala sinóptica que determinan las condiciones locales. Este módulo examina varias situaciones sinópticas comunes con el fin de comprender los procesos involucrados en la formación de niebla o estratos bajos. La mayoría de ellos son forzados principalmente por procesos advectivos o dinámicos (aunque la radiación también influye en este proceso). Encontrará un tratamiento más a fondo de los procesos radiativos en el módulo sobre niebla de radiación titulado Radiation Fog. Este módulo forma parte del curso de educación a distancia sobre aviación (Distance Learning Aviation Course 1, o DLAC1) sobre el pronóstico de nieblas y estratos bajos.
Estimated time to complete: 2-3 h
Includes audio: no
Required plug-ins:  Flash Flash  RealPlayer RealPlayer  Java Java  Adobe® Reader® Adobe® Reader®
* Plug-in information
Last published on: 2006-07-28
close
|

|
Creación de productos meteorológicos a partir de observaciones satelitales
description (click to show/hide) |
Quiz
|
 Description: Description:
Este módulo presenta un panorama general del proceso mediante el cual los datos satelitales se transforman en los productos satelitales utilizados por los centros de pronóstico operativo y las comunidades de investigación, docente, etc. El módulo comienza con una descripción del proceso de creación de productos simples mediante técnicas de manipulación de imágenes relativamente sencillas diseñadas para resaltar ciertas propiedades, como el polvo arrastrado por el viento, la vegetación o la fase del agua de las nubes. A continuación, el módulo describe algunos de los procesos más complejos involucrados en la creación de productos cuantitativos, como los de identificación de nubes, inestabilidad atmosférica, caracterización de incendios descontrolados y temperatura de la superficie del mar. Finalmente, el módulo presenta productos avanzados que aprovechan los miles de canales disponibles en los instrumentos hiperespectrales para derivar una amplia gama de parámetros geofísicos relacionados con la caracterización de aerosoles, gases traza, microfísica de nubes, perfiles atmosféricos, etc. La explicación de los productos cuantitativos utiliza como ejemplo la máscara de nubes de Meteosat, que indica si un píxel en una imagen satelital está despejado o nublado. Los productos de máscara de nubes son importantes para todos los satélites ambientales, porque forman la base de muchos otros productos derivados.
Objectives:
Cuando termine de estudiar este webcast, el estudiante sabrá:
- Enumerar los beneficios de usar productos satelitales.
- Para los tres niveles de productos (simple, cuantitativo y “de punta”), definir el tipo de producto, describir sus ventajas y, a un nivel muy básico, algunas las técnicas y estrategias de producción, así como identificar varios de los productos que permiten generar.
- Describir el objetivo y la función de los productos de máscara nubosa.
- Describir algunas de las fuentes de errores del proceso de generación de productos.
Estimated time to complete: 1 h
Includes audio: no
Required plug-ins:  Flash Flash  RealPlayer RealPlayer  Java Java  Adobe® Reader® Adobe® Reader®
* Plug-in information
Last published on: 2008-08-29
close
|

|
Diez conceptos equivocados comunes sobre PNT
description (click to show/hide) |
Quiz
|
 Description: Description:
Este módulo presenta diez de los conceptos equivocados más comunes o importantes sobre los modelos de PNT. Los diez conceptos equivocados abarcan asuntos relacionados con la asimilación de datos, la resolución del modelo, las parametrizaciones físicas y el postprocesamiento de la salida del pronóstico del modelo.
Estimated time to complete: 1 h
Includes audio: no
Required plug-ins:  Flash Flash  RealPlayer RealPlayer  Java Java  Adobe® Reader® Adobe® Reader®
* Plug-in information
Last published on: 2006-12-13
close
|

|
Dominio del diagrama oblicuo T-log p
description (click to show/hide) |
Quiz
|
 Description: Description:
Es normal examinar los sondeos atmosféricos como parte del proceso de preparación del pronóstico del tiempo. El diagrama oblicuo T-log p es uno de los métodos más difundidos de analizar estos sondeos. Este módulo examina a fondo el uso del diagrama oblicuo T-log p, y explora las propiedades termodinámicas, los parámetros convectivos, la evaluación de la estabilidad y varias aplicaciones de pronóstico. El módulo ha sido diseñado para instrucción y referencia. También incluye un diagrama oblicuo T-log p interactivo basado en web que calcula varios parámetros de predicción comunes.
Objectives:
Objetivo del módulo
El objetivo de este módulo es enseñar al meteorólogo principiante a utilizar el diagrama oblicuo T - log p de forma eficaz. Después de completar el módulo, usted debería ser capaz de leer e interpretar la representación de un sondeo en un diagrama oblicuo T - log p y aplicar la información al realizar un pronóstico del tiempo.
Objetivos prácticos
- Dado un diagrama oblicuo T - log p, identificar y describir sus diferentes líneas.
- Dada la representación de un sondeo en un diagrama oblicuo T - log p:
- leer o calcular las propiedades termodinámicas en diferentes niveles;
- determinar los niveles convectivos, incluidos NCA, NCC, NCL, NCM, NE y NMP;
- determinar los índices de estabilidad, como LI, SSI, KI, TT and SWEAT, y utilizarlos para calcular el potencial de tiempo severo;
- Describir cómo se determinan la CAPE y CIN.
- Enumerar y describir los diferentes tipos de estabilidad e identificarlos en un sondero representado en un diagrama oblicuo T - log p
- Enumerar y describir los diferentes tipos de gradientes térmicos y relacionarlos con la estabilidad.
- Enumerar y describir los procesos que alteran la estabilidad y dar ejemplos de casos comunes donde ocurren.
- Dado un ambiente sinóptico apropiado y un sondeo en un diagrama oblicuo T - log p, interpretar el sondeo teniendo en cuenta los problemas de pronóstico más comunes.
Estimated time to complete: 6-8 h
Includes audio: no
Required plug-ins:  Flash Flash  RealPlayer RealPlayer  Java Java  Adobe® Reader® Adobe® Reader®
* Plug-in information
Last published on: 2008-08-21
close
|

|
El Proceso de Pronóstico
description (click to show/hide) |
No Quiz
|
This module is not available on the Web. To order a CD, please see our contact information.
 Description: Description:
Las agencias meteorológicas y organizaciones de pronóstico de todo el mundo tratan de mantenerse al tanto de la constante modernización de los sistemas de detección y adquisición de datos. Más que nunca, los pronosticadores requieren una estructura coherente que les permita dominar rápidamente esta fuente de nuevos formatos de datos en constante estado de crecimiento, para poder observar, organizar, analizar, diagnosticar y pronosticar adecuadamente las condiciones y los eventos meteorológicos. Este módulo ha sido diseñado para alcanzar ese objetivo.
El objetivo de instrucción del módulo es ayudar al usuario a desarrollar y aplicar un enfoque sistemático para el pronóstico operativo. Tras la teoría del "embudo de pronóstico", este módulo presenta las escalas de interacción (hemisférica, sinóptica, mesoescala y local) que influyen en el comienzo y los cambios en los eventos meteorológicos de cualquier zona de pronóstico en particular. Una serie de ejemplos claros y representativos de las interacciones a estas escalas establece un contexto para demostrar las destrezas de pronóstico esenciales.
Debido a que sirve como referencia general para los demás módulos de COMET, recomendamos estudiar este modulo como requisito previo a todos los demás módulos. Como material de fondo para este módulo, también recomendamos conocimientos de los productos de predicción numérica del tiempo, los patrones de ondas largas y cortas, los patrones de bloqueo, las cartas de superficie y de presión constante, el flujo ciclónico y anticiclónico, y las imágenes satelitales, así como experiencia general en la identificación y conceptualización de patrones meteorológicos básicos.
Los expertos en la materia para este módulo son el Sr. Len Snellman y el Sr. Eric Thaler.
Estimated time to complete: 3-5 h
Includes audio: yes
Required plug-ins:  Flash Flash  RealPlayer RealPlayer  Java Java  Adobe® Reader® Adobe® Reader®
* Plug-in information
Last published on: 2000-01-01
close
|

|
Enfoques para el pronóstico de nieblas y estratos
description (click to show/hide) |
Quiz
|
 Description: Description:
En este módulo se comparan las características de los episodios de niebla de radiación y de advección con el fin de determinar cuál de dichos procesos domina y aplicar esos conocimientos a la preparación de pronósticos de techos de nubes y visibilidad. También se presenta un enfoque de pronóstico mediante un árbol de decisión. Dicho árbol de decisión describe los pasos básicos involucrados en la aplicación de un enfoque de pronóstico riguroso a los episodios de niebla y estratos. El módulo se basa en las sesiones de educación a distancia que se ofrecieron en vivo en el año 2003 como parte del curso de educación a distancia sobre aviación (Distance Learning Aviation Course 1, o DLAC1) sobre el pronóstico de nieblas y estratos.
Objectives:
- Describir los distintos procesos que llevan a la formación de las nieblas de radiación y de advección
- Describir los dos elementos esenciales para la formación de niebla o nubes estratos bajas: aumento de la humedad en la capa límite planetaria o disminución de las temperaturas en la capa límite planetaria.
- Identificar adecuadamente los procesos que dominan en un determinado episodio de niebla o estratos bajos. Con ese fin podemos:
- examinar las características de los procesos involucrados
- examinar los factores de los niveles inferiores que influyen en el episodio
- comparar esos factores con las características, los procesos y los factores conocidos que distinguen los episodios de niebla de radiación de los de niebla de advección
Estimated time to complete: 30 min
Includes audio: no
Required plug-ins:  Flash Flash  RealPlayer RealPlayer  Java Java  Adobe® Reader® Adobe® Reader®
* Plug-in information
Last published on: 2006-07-28
close
|

|
Estrategias básicas para pronósticos de aeródromo
description (click to show/hide) |
Quiz
|
 Description: Description:
Este módulo es el primer componente del 2º Curso de Educación a Distancia (Distance Learning Course), sobre la generación de pronósticos TAF centrados en el cliente. El módulo comprende dos lecciones que brindan 1) una introducción para comprender los clientes de aviación y sus necesidades y 2) una técnica para satisfacer esas necesidades generando pronósticos de aeródromo (TAF) claros, concisos y coherentes.
Objectives:
1. Identificar los grupos de clientes de aviación y describir cómo usan los pronósticos TAF.
2. Reconocer los problemas comunes de los pronósticos de aeródromo que afectan adversamente a los clientes.
3. Analizar algunos pronósticos TAF con el fin de determinar cuáles los clientes considerarían "buenos" o "malos".
4. Explicar por qué el uso excesivo de los términos condicionales (como TEMPO) reduce los resultados de verificación del pronóstico e impide a los clientes tomar decisiones eficaces.
5. Describir la relación que existe entre los resultados de verificación del pronóstico y el grado de satisfacción del cliente.
6. Crear un TAF prácticamente perfecto que pueda satisfacer las necesidades comunes de los clientes.
Estimated time to complete: 2 h
Includes audio: no
Required plug-ins:  Flash Flash  RealPlayer RealPlayer  Java Java  Adobe® Reader® Adobe® Reader®
* Plug-in information
Last published on: 2008-05-08
close
|

|
Explicación del pronóstico por conjuntos
description (click to show/hide) |
Quiz
|
 Description: Description:
Este módulo, el más reciente de nuestra serie de predicción numérica del tiempo (PNT), abarca la teoría y el uso de los sistemas de predicción por conjuntos (SPC). El objetivo de este módulo es ayudarle a desarrollar su comprensión de los conceptos fundamentales de los sistemas de predicción por conjuntos y la capacidad de interpretar los productos del conjunto, así como proporcionarle algunas estrategias para usarlos en el proceso de pronóstico. El módulo comprende seis secciones: la Introducción presenta un breve panorama teórico; la sección Generación del conjunto describe la creación de los SPC; Conceptos estadísticos ofrece un breve repaso de los conocimientos necesarios para interpretar los productos generados por el conjunto; Resumen de los datos presenta los productos de pronóstico por conjuntos más comunes; en Verificación se explica cómo evaluar y documentar la actuación de los SPC; y Ejemplos de aplicación ofrece enlaces a varios casos de pronóstico (en inglés) que ilustran el uso de los SPC en el proceso de pronóstico. A lo largo del módulo encontrará preguntas y ejercicios con ejemplos prácticos que le permitirán averiguar lo que ha aprendido. El módulo incluye también una prueba final.
Objectives:
Explicar las bases del pronóstico numérico por conjuntos y lo que significa decir que la atmósfera es caótica (es decir, sensible a las condiciones iniciales).
Describir la variedad de métodos empleados para generar los miembros del sistema de predicción por conjuntos, incluyendo los aspectos de perturbación de las condiciones iniciales, condiciones de frontera y configuraciones del modelo.
Entender los conceptos estadísticos básicos y los métodos usados en el desarrollo de los productos del conjunto, incluyendo las distribuciones de probabilidad, la centralidad, la variabilidad y las características de la forma de la distribución.
Reconocer e interpretar los distintos productos de pronóstico por conjuntos, incluyendo los gráficos de predicción puntuales y espaciales, y aquellos que muestran los regímenes de flujo, como los de medida relativa de predictibilidad, que revelan los sesgos y los errores de los modelos de PNT.
Interpretar los productos de verificación del conjunto y aplicarlos al uso de pronósticos por conjuntos.
Estimated time to complete: 3-4 h
Includes audio: no
Required plug-ins:  Flash Flash  RealPlayer RealPlayer  Java Java  Adobe® Reader® Adobe® Reader®
* Plug-in information
Last published on: 2006-10-13
close
|

|
Forzamiento térmico de la circulación I: brisas marinas
description (click to show/hide) |
Quiz
|
 Description: Description:
Este módulo describe los fenómenos de brisa marina. Se examinan los factores que provocan la formación de la brisa marina, los efectos que modifican el desarrollo de la brisa marina, cómo los modelos de PNT de mesoescala manejan las brisas marinas, y los parámetros de predicción de las brisas marinas. El módulo desarrolla la instrucción en el contexto de una situación de brisa marina que ocurrió en Florida y compara las observaciones superficiales y satelitales con la simulación del modelo AFWA MM5. Como es el caso con otros módulos del Manual de meteorología de mesoescala (Mesoscale Meteorology Primer), este módulo incluye narración, una atractiva presentación gráfica y una versión para imprimir.
Objectives:
Objetivos finales
Cuando termine de estudiar este módulo, usted podrá describir cómo, porqué, cuándo y dónde se forman las brisas marinas.
Objetivos de capacitación
Cuando termine de estudiar este módulo, usted podrá:
1. describir cuándo y dónde se forman las brisas marinas;
2. describir las brisas marinas en términos de intensidad y extensión horizontal y vertical;
3. enumerar los factores principales que afectan la formación de las brisas marinas;
4. enumerar el clima sensible asociado con la formación y el paso de un frente de brisa marina;
5. describir el uso y las limitaciones de las simulaciones de las brisas marinas en los modelos de PNT;
6. describir cómo las imágenes satelitales pueden ayudar a detectar las brisas marinas.
Estimated time to complete: 1 h
Includes audio: yes
Required plug-ins:  Flash Flash  RealPlayer RealPlayer  Java Java  Adobe® Reader® Adobe® Reader®
* Plug-in information
Last published on: 2007-09-20
close
|

|
Forzamiento térmico de la circulación II: brisas de valle y de montaña
description (click to show/hide) |
Quiz
|
 Description: Description:
En este módulo preparatorio de la serie Manual de meteorología de mesoescala (Mesoscale Meteorology Primer) se tratan temas tales como brisas anabáticas y catabáticas, vientos de valle ascendentes y descendentes, los peligros asociados y las técnicas de pronóstico.
Objectives:
Objetivos finales
Cuando termine de estudiar este módulo, usted podrá:
1. describir cómo, porqué, cuándo y dónde se forman las brisas de valle y de montaña;
2. enumerar los aspectos que se deben considerar para un pronóstico y los peligros de aviación asociados con las brisas de valle y de montaña.
Objetivos de capacitación
Cuando termine de estudiar este módulo, usted podrá:
1. describir cuándo y dónde se forman las brisas de valle y de montaña, incluido su ciclo diurno;
2. enumerar los aspectos que se deben considerar para un pronóstico y los peligros de aviación asociados con las brisas de valle y de montaña;
3. describir los procesos que provocan vientos de ladera;
4. describir cómo la topografía puede afectar las brisas de valle y de montaña;
5. describir cómo las imágenes satelitales pueden ayudar a detectar las brisas de valle y de montaña.
Estimated time to complete: 30 min
Includes audio: yes
Required plug-ins:  Flash Flash  RealPlayer RealPlayer  Java Java  Adobe® Reader® Adobe® Reader®
* Plug-in information
Last published on: 2007-09-20
close
|

|
Funcionamiento de los modelos de mesoescala
description (click to show/hide) |
Quiz
|
 Description: Description:
El objetivo de este módulo de capacitación es ayudarle a aumentar su grado de comprensión del funcionamiento de los modelos de mesoescala. A su vez, dicha comprensión puede ayudarle a evaluar de forma más eficiente y precisa los productos de pronóstico generados por los modelos numéricos.
Objectives:
Objetivos finales
Cuando termine de estudiar este módulo podrá:
1. Describir cómo funcionan los modelos de mesoescala.
2. Evaluar los puntos fuertes y débiles de los diferentes modelos de PNT.
Objetivos de capacitación
Cuando termine de estudiar este módulo podrá:
1. Describir las ventajas y limitaciones de los modelos de PNT de mesoescala.
2. Describir la relación entre el espaciado de malla y la resolución para los modelos de PNT.
3. Describir las ventajas y desventajas de aumentar la resolución del modelo.
4. Describir el equilibrio hidrostático y cómo los modelos de PNT hidrostáticos difieren de los no hidrostáticos.
5. Definir los esquemas de coordenadas verticales Eta, sigma y de presión, y describir sus respectivas ventajas.
6. Definir la parametrización y describir los beneficios de su uso en los modelos de PNT.
7. Enumerar al menos tres procesos que suelen parametrizarse.
8. Describir los conceptos de modelo de área limitada, fase de inicialización y arranque en caliente, así como la relación que existe entre ellos.
9. Describir los beneficios y las limitaciones del arranque en caliente.
Estimated time to complete: 30 min
Includes audio: yes
Required plug-ins:  Flash Flash  RealPlayer RealPlayer  Java Java  Adobe® Reader® Adobe® Reader®
* Plug-in information
Last published on: 2007-05-21
close
|

|
Fundamentos de los modelos
description (click to show/hide) |
Quiz
|
 Description: Description:
Describe los componentes de los modelos de PNT, cómo encajan en el proceso el desarrollo del pronóstico y por qué es necesario parametrizar muchos procesos físicos en los modelos de PNT.
Estimated time to complete: 1 h
Includes audio: no
Required plug-ins:  Flash Flash  RealPlayer RealPlayer  Java Java  Adobe® Reader® Adobe® Reader®
* Plug-in information
Last published on: 2005-08-23
close
|

|
Huracanes: Preparación de la Comunidad
description (click to show/hide) |
No Quiz
|
 Description: Description:
Todos los años, la Agencia Federal para la Administración de Emergencias (Federal Emergency Management Agency, o FEMA) y el Servicio Nacional de Meteorología (National Weather Service, o NWS) de la Administración Nacional de Servicios Oceánicos y Atmosféricos (National Oceanic and Atmospheric Administration, o NOAA) de los Estados Unidos imparten de 2 a 4 cursos titulados An Introduction to Hurricane Preparedness (Introducción sobre cómo prepararse para un huracán) en el Centro Nacional de Huracanes (National Hurricane Center), en Miami, Florida. El número de personas que pueden asistir cada año es considerablemente inferior a la cantidad de personas que participa en el proceso de toma de decisiones cuando hay un huracán.
Este curso por computadora, llamado Huracanes: Preparación de la comunidad, tiene el propósito de proporcionar a los administradores de centros de operaciones de emergencia y a aquellas personas que participan en el proceso de toma de decisiones, pero que no pueden tomar el curso, información básica acerca de:
cómo se forman los huracanes
los peligros que representan
cómo el NWS pronostica la actividad de los huracanes para el futuro
las herramientas y los principios que los administradores de centros de operaciones de emergencia pueden utilizar y seguir para preparar a sus comunidades
Huracanes: Preparación de la comunidad no pretende suplantar al curso que se imparte en Miami, ni tampoco a ningún otro curso patrocinado por FEMA y/o las distintas agencias estatales. Sin embargo, puede ofrecer una buena base a aquellas personas que todavía no han tenido la oportunidad de asistir a dichos cursos. Lo animamos a ponerse en contacto con la oficina de administración de emergencias de su estado para averiguar qué otros cursos se ofrecen.
Nota: La versión en español del curso Huracanes: Preparación de la comunidad no contiene todos los materiales que se incluyen en la versión en inglés (que se describe a continuación). En la actualidad, no se ofrece una Quick Tour (Visita rápida) y, además, el enlace Comenzar el curso que aparece en la página inicial de la versión en español lleva sólo al contenido completo de las tres primeras secciones del curso (Conceptos básicos, Peligros y Pronosticación).
Estimated time to complete: 3-4 h
Includes audio: yes
Required plug-ins:  Flash Flash  RealPlayer RealPlayer  Java Java  Adobe® Reader® Adobe® Reader®
* Plug-in information
Last published on: 2000-07-11
close
|

|
Impacto de la estructura y dinámica de los modelos
description (click to show/hide) |
Quiz
|
 Description: Description:
Brinda información importante desde el punto de vista operativo sobre el tipo de modelo, la resolución horizontal, los sistemas de coordenadas verticales, la resolución vertical y las condiciones de dominio y de frontera. Se analiza como cada uno de estos aspectos afecta a la capacidad del modelo de describir y pronosticar las condiciones meteorológicas.
Estimated time to complete: 3-5 h
Includes audio: no
Required plug-ins:  Flash Flash  RealPlayer RealPlayer  Java Java  Adobe® Reader® Adobe® Reader®
* Plug-in information
Last published on: 2005-08-23
close
|

|
Impactos en el cliente: Pronósticos de niebla y nubes estratos bajas
description (click to show/hide) |
Quiz
|
 Description: Description:
En este módulo se tratan los asuntos relacionados con los impactos directos e indirectos de los límites de techo de nubes y visibilidad en las operaciones aéreas, y se examinan brevemente los impactos en las operaciones de transporte terrestre y marino. El objetivo es mejorar el conocimiento de cómo los pronósticos de estos eventos afectan a las operaciones de aviación comercial y general. Este módulo forma parte del curso de educación a distancia sobre aviación (Distance Learning Aviation Course 1, o DLAC1) sobre el pronóstico de nieblas y estratos bajos.
Estimated time to complete: 1 h
Includes audio: no
Required plug-ins:  Flash Flash  RealPlayer RealPlayer  Java Java  Adobe® Reader® Adobe® Reader®
* Plug-in information
Last published on: 2006-07-28
close
|

|
Interacción entre flujo y topografía
description (click to show/hide) |
Quiz
|
 Description: Description:
En este módulo preparatorio de la serie Manual de meteorología de mesoescala (Mesoscale Meteorology Primer) se tratan temas tales como una descripción general de los factores que controlan si el aire subirá para cruzar una montaña o si será forzado alrededor de ella, el papel de la energía potencial y cinética, el número de Froude y su significado y el bloqueo del flujo del aire por la topografía.
Objectives:
Al final de este módulo podrá:
1. Describir cómo el flujo interactúa con la topografía.
2. Enumerar los factores que determinan la interacción.
Objetivos específicos
Al final de este módulo podrá:
1. Enumerar los factores que determinan la interacción entre el flujo y la topografía.
2. Describir el número de Froude en términos de velocidad del viento, dirección del viento, estabilidad estática y altura de la montaña.
3. Describir las interacciones del flujo con una cadena montañosa ancha para flujos de número de Froude altos y bajos.
4. Recordar cómo el flujo responde frente a una montaña individual alta.
5. Enumerar los factores que determinan a qué distancia aguas arriba el flujo se verá afectado por la topografía.
Estimated time to complete: 30 min
Includes audio: no
Required plug-ins:  Flash Flash  RealPlayer RealPlayer  Java Java  Adobe® Reader® Adobe® Reader®
* Plug-in information
Last published on: 2008-04-24
close
|

|
Introducción a la meteorología tropical, Capítulo 3: Aplicaciones de percepción remota en los trópicos
description (click to show/hide) |
Quiz
|
 Description: Description:
Capítulo 3: Aplicaciones tropicales de percepción remota es el primer capítulo que se publica del libro de texto en línea "Introducción a la meteorología tropical". Este capítulo cubre la percepción remota, que constituye el principal método empleado para observar el tiempo y el clima a través de los trópicos en el mundo. Este capítulo le permitirá familiarizarse con los fundamentos y las aplicaciones científicas de la percepción remota por radar y satélites por medio de ejemplos en los cuales las nubes y la precipitación se observan midiendo las señales de microondas con radar terrestre, radar espacial y radiómetros satelitales. También se cubren temas tales como estimación de vientos, seguimiento de polvo y ceniza volcánica, técnicas de sondeo vertical y medición remota de la superficie del mar, del suelo y de la superficie terrestre. El libro de texto en línea incorpora muchas características especiales, como preguntas de repaso y pruebas en los capítulos individuales, secciones de enfoque en temas particulares, acceso directo a temas de pronóstico operativo, secciones que destacan conceptos teóricos, enlaces a recursos para profundizar en el estudio del tema, preguntas de pensamiento crítico a lo largo del texto, iconos que identifican enlaces a recursos y ejercicios de pensamiento crítico, y biografías de científicos.
Objectives:
Al final de este capítulo, debería comprender y ser capaz de explicar:
* por qué la percepción remota es importante en los trópicos;
* varias aplicaciones tropicales del radar terrestre;
* las ventajas y limitaciones del radar aéreo y espacial;
* varias aplicaciones del radar satelital y la percepción remota por microondas en meteorología tropical;
* los beneficios y las limitaciones de las estimaciones satelitales del contenido de vapor de agua;
* cómo se utilizan las señales del satélite de posicionamiento global (GPS) para derivar perfiles de temperatura y humedad, y los beneficios que esto implica para la meteorología tropical;
* los beneficios y las limitaciones de las estimaciones satelitales de precipitación;
* cómo los satélites detectan los rayos;
* los beneficios y las limitaciones de las estimaciones satelitales del viento;
* por qué son útiles los sensores de microondas en la identificación de la humedad de superficie;
* cómo se utilizan los satélites para seguir los cambios en la vegetación, y otros usos y cobertura del suelo;
* cómo se siguen los fenómenos importantes en meteorología, como las propiedades de las nubes, mediante imágenes satelitales;
* cómo se utilizan los satélites para evaluar la calidad del aire, por ejemplo observando la dispersión de ceniza volcánica, los contaminantes químicos, el polvo y el humo.
Estimated time to complete: 100-110 mins.
Includes audio: no
Required plug-ins:  Flash Flash  RealPlayer RealPlayer  Java Java  Adobe® Reader® Adobe® Reader®
* Plug-in information
Last published on: 2008-01-10
close
|

|
Introducción a la meteorología tropical, Capítulo 6: Distribución de humedad y precipitación
description (click to show/hide) |
Quiz
|
 Description: Description:
Capítulo 6, Distribución de humedad y precipitación, es el segundo capítulo que se publica del libro de texto en línea Introducción a la meteorología tropical. La distribución de la humedad y precipitación domina la vida en los trópicos. El calentamiento en exceso y los movimientos ascendentes que se producen en los trópicos dan impulso a los ciclos energético e hidrológico globales e influyen en el régimen meteorológico de las latitudes medias. El capítulo 6 presenta la distribución horizontal y vertical del vapor de agua, la formación y distribución de las nubes en los trópicos, el ciclo de vida y las características de precipitación de los sistemas convectivos de mesoescala tropicales, y la variabilidad de la precipitación en los trópicos a escalas anuales, estacionales y horarias. El libro de texto en línea incorpora muchas características especiales, como preguntas de repaso y pruebas en los capítulos individuales, secciones de enfoque en temas particulares, acceso directo a temas de pronóstico operativo, secciones que destacan conceptos teóricos, enlaces a recursos para profundizar en el estudio del tema, preguntas de pensamiento crítico a lo largo del texto, iconos que identifican enlaces a recursos y ejercicios de pensamiento crítico, y biografías de científicos.
Objectives:
Al final de este capítulo, debería comprender y ser capaz de explicar:
* por qué el vapor de agua es importante para el tiempo y el clima en los trópicos;
* el rango y la distribución del contenido de vapor de agua en los trópicos;
* la distribución de las tasas de evaporación y evapotranspiración en los trópicos;
* la formación de las nubes tropicales por convección;
* el patrón general de distribución de las nubes en los trópicos;
* los perfiles típicos de temperatura potencial (Theta) y temperatura potencial equivalente (Theta e) en la atmósfera tropical;
* cómo la capa de aire del Sahara y otras intrusiones de aire seco cambian la distribución vertical de la energía termodinámica de la humedad;
* el concepto de energía estática seca y húmeda (termodinámica) y su distribución vertical en los trópicos;
* cómo la distribución vertical de la energía estática húmeda varía con los diferentes modos de convección;
* las diferencias entre lluvia convectiva y estratiforme en los sistemas convectivos de mesoescala tropicales;
* los efectos de los aerosoles continentales y marinos en la precipitación tropical;
* la distribución geográfica de la precipitación tropical anual y su variabilidad;
* los factores que afectan la distribución geográfica de la precipitación en los trópicos;
* la distribución estacional de la precipitación en los trópicos y sus patrones regionales particulares;
* las diferencias entre el ciclo diurno de precipitación en los trópicos sobre tierra firme y los océanos, incluyendo los factores de influencia;
* las características especiales del ciclo diurno durante las estaciones de transición ecuatoriales (primavera y otoño);
* los factores que afectan dónde llueve y la cantidad de lluvia que se produce a escalas de tiempo anuales y plurianuales.
También podrá identificar y describir:
* los factores que influyen en las tasas de evaporación y evapotranspiración;
* los tipos de nubes dominantes en los trópicos;
* la distribución zonal y meridional típica de la profundidad de las nubes sobre los océanos tropicales.
Estimated time to complete: 1.5-2 h
Includes audio: no
Required plug-ins:  Flash Flash  RealPlayer RealPlayer  Java Java  Adobe® Reader® Adobe® Reader®
* Plug-in information
Last published on: 2008-05-22
close
|

|
Introducción a las corrientes oceánicas
description (click to show/hide) |
Quiz
|
 Description: Description:
Este módulo describe el origen de las corrientes oceánicas, tanto en alta mar como en las zonas costeras. El módulo se centra en los mecanismos que impulsan las corrientes y los factores que modifican las corrientes existentes. Entre los mecanismos impulsores se consideran el viento, las diferencias en la densidad horizontal y las mareas; los factores modificadores contemplados incluyen la fricción, la batimetría y la espiral de Ekman. El módulo concluye con una demostración de los productos de datos y una breve descripción general de las consideraciones de pronóstico.
Objectives:
Cuando termine de estudiar este módulo, debería poder:
- Identificar la ubicación de las corrientes oceánicas principales y secundarias y describir sus orígenes.
- Enumerar los factores que causan las corrientes oceánicas.
- Describir cómo cada factor influye en las corrientes oceánicas.
- Describir las corrientes de alta mar
en términos de temperatura, volumen (transporte) y velocidad.
- Describir el origen de los fuertes gradientes horizontales y verticales de temperatura, salinidad y densidad tanto en mar
abierta como en entornos oceánicos costeros.
- Describir los efectos de la fricción, batimetría y fuerza de Coriolis en las corrientes oceánicas tanto
en mar abierta como en entornos oceánicos costeros.
- Explicar el papel de las corrientes oceánicas en la distribución global del calor (es decir, el balance térmico de
la Tierra).
- Definir la circulación termohalina.
- Describir el origen de aguas profundas del Atlántico Norte y el agua antártica de fondo.
- Describir los actuales métodos de predicción y las consideraciones de pronóstico.
Estimated time to complete: 2 h
Includes audio: no
Required plug-ins:  Flash Flash  RealPlayer RealPlayer  Java Java  Adobe® Reader® Adobe® Reader®
* Plug-in information
Last published on: 2008-01-02
close
|

|
Introducción a las mareas oceánicas
description (click to show/hide) |
Quiz
|
 Description: Description:
Las mareas oceánicas afectan profundamente las operaciones marítimas costeras. Este módulo presenta el origen, las características y la predicción de las mareas. Después de presentar la terminología común, el módulo examina los mecanismos que causan y modifican las mareas, incluidos los efectos astronómicos y meteorológicos. El módulo concluye con una discusión de las técnicas y los productos de predicción de mareas. Este módulo incluye una atractiva presentación gráfica, narración e interacciones.
Objectives:
Cuando termine de estudiar este módulo, debería poder:
- Enumerar y definir los términos empleados para describir las mareas
- Enumerar y definir las fuerzas que causan y modifican las mareas
- Definir los componentes de la marea
- Describir el nivel o plano de referencia de mareas y explicar su importancia
- Describir los métodos de predicción de las mareas
- Explicar cuándo conviene usar las tablas de mareas o los modelos numéricos
Estimated time to complete: 45 min
Includes audio: no
Required plug-ins:  Flash Flash  RealPlayer RealPlayer  Java Java  Adobe® Reader® Adobe® Reader®
* Plug-in information
Last published on: 2007-12-05
close
|

|
Introducción a los modelos oceánicos
description (click to show/hide) |
Quiz
|
 Description: Description:
Pese a que los océanos cubren más del 70 % de la superficie terrestre, hay muchos detalles de su funcionamiento que aún no comprendemos cabalmente. Para entender y pronosticar mejor el estado de los océanos dependemos de los modelos numéricos oceánicos, los cuales combinan las observaciones y la física para predecir la temperatura, la salinidad y las corrientes de los océanos en cualquier momento y en cualquier lugar de las cuencas oceánicas. Este módulo explica los diferentes aspectos de los modelos numéricos oceánicos, incluyendo la física de los modelos, los sistemas de coordenadas, la parametrización, la inicialización y las condiciones de frontera.
Objectives:
Cuando termine de estudiar este módulo debería poder:
1. Explicar las similitudes y diferencias entre modelar los océanos y la atmósfera.
2. Explicar las leyes y los procesos físicos que se deben considerar al desarrollar un modelo oceánico.
3. Explicar cómo las propiedades físicas de los océanos difieren de las de la atmósfera.
4. Explicar los procesos incorporados en los modelos numéricos oceánicos.
5. Explicar la importancia de la resolución y la escala para los modelos oceánicos globales, regionales y locales.
6. Describir un modelo numérico y cómo se puede usar como herramienta de predicción.
7. Explicar las contribuciones de las observaciones en tiempo real y la climatología a los modelos oceánicos.
Estimated time to complete: 1-2 h
Includes audio: no
Required plug-ins:  Flash Flash  RealPlayer RealPlayer  Java Java  Adobe® Reader® Adobe® Reader®
* Plug-in information
Last published on: 2008-01-03
close
|

|
Matriz de modelos operativos: características de los modelos de PNT operativos
description (click to show/hide) |
No Quiz
|
 Description: Description:
Este módulo, que forma parte de la Serie de Formación Profesional (Professional Development Series, PDS) de PNT, contiene información sobre las características y la arquitectura de los modelos operativos de uso común, sus principales puntos fuertes y puntos débiles para las operaciones y herramientas de evaluación del modelo. La información se actualiza siempre que se realicen cambios significativos en el modelo.
El módulo está vinculado al módulo Impact of Model Numerics on Weather Depiction (que también integra la Serie de Formación Profesional de PNT), el cual brinda información de fondo acerca de los componentes del modelo.
El experto en la materia para este módulo es el Dr. Ralph Petersen del Centro de Modelado Ambiental de los Centros Nacionales de Predicción Ambiental (National Centers for Environmental Prediction/Environmental Modeling Center, NCEP/EMC).
Estimated time to complete: 3-5 h
Includes audio: no
Required plug-ins:  Flash Flash  RealPlayer RealPlayer  Java Java  Adobe® Reader® Adobe® Reader®
* Plug-in information
Last published on: 2007-10-19
close
|

|
Meteorología satelital: introducción al uso de la sonda atmosférica del GOES
description (click to show/hide) |
Quiz
|
 Description: Description:
Este módulo, que ha sido adaptado para web a partir de un CD-ROM publicado en 1998, describe las características, los productos de datos y las aplicaciones de la sonda atmosférica de los satélites GOES I(8) a P. El módulo abarca temas tales como una descripción del espectro electromagnético y de la selección de los canales de la sonda atmosférica, las funciones de ponderación para determinar temperatura y humedad, y la evalauación de los productos de la sonda atmosférica del GOES. Se incluyen ejemplos de imágenes y productos, así como varios ejemplos de casos abreviados que muestran cómo estos productos se usan en aplicaciones de análisis meteorológico y pronóstico.
Estimated time to complete: 1 h
Includes audio: no
Required plug-ins:  Flash Flash  RealPlayer RealPlayer  Java Java  Adobe® Reader® Adobe® Reader®
* Plug-in information
Last published on: 2007-05-21
close
|

|
Meteorología Satelital: Percepción Remota usando el nuevo sensor de radiación del GOES
description (click to show/hide) |
No Quiz
|
This module is not available on the Web. To order a CD, please see our contact information.
 Description: Description:
Audio on CD is English but Spanish audio is available on on our server to play locally.
Estimated time to complete:
Includes audio: yes
Required plug-ins:  Flash Flash  RealPlayer RealPlayer  Java Java  Adobe® Reader® Adobe® Reader®
* Plug-in information
Last published on: 1999-01-01
close
|

|
Modelos conceptuales de ondas tropicales
description (click to show/hide) |
Quiz
|
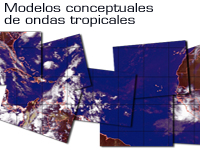 Description: Description:
Las ondas tropicales son fenómenos capaces de producir enormes cantidades de lluvia, y a veces pueden formar ciclones tropicales. Utilizamos los modelos conceptuales de ondas tropicales para ayudar al usuario a comprender las características dinámicas y la evolución de las ondas tropicales. El usuario aprenderá sobre la estructura vertical y horizontal de las ondas tropicales y los típicos cambios en el tiempo que acompañan el paso de una onda tropical. También se proporcionan cuatro métodos distintos de seguir las ondas tropicales. Están a cargo del webcast el Sr. Horace Burton y el Sr. Selvin Burton del Caribbean Institute for Meteorology and Hydrology, bajo los auspicios del proyecto MeteoForum.
Después de estudiar el módulo, el usuario podrá:
* Dar una definición de ondas tropicales y explicar su importancia.
* Describir las características típicas de longitud de onda, frecuencia, velocidad de propagación y dirección de las ondas tropicales.
* Describir la estructura horizontal y vertical de las ondas tropicales en términos de vientos, humedad y temperatura.
* Describir el ciclo de vida de una onda del este "clásica" de Reihl en términos de velocidad del viento, humedad relativa, nubes y precipitación.
* Identificar las ondas tropicales de acuerdo con el modelo de V invertida de Frank, es decir, bandas de nubes con forma de V invertida.
* Describir la relación entre el flujo de la troposfera superior e inferior en el modelo conceptual de Frank.
* Describir las características de las ondas africanas, incluido su origen, longitud de onda e intensidad relativa sobre tierra firme y en la costa.
* Describir la típica distribución de la divergencia en las ondas africanas.
* Describir la distribución de la vorticidad en las ondas africanas.
* Describir la distribución de las nubes y la precipitación en las ondas africanas.
* Comprender que existe una correlación entre las variaciones interanuales en la frecuencia e intensidad de las ondas africanas y la ocurrencia de tormentas intensas en el Atlántico.
* Detectar y seguir las ondas tropicales mediante imágenes satelitales, vientos de superficie derivados por satélite, perfiles de viento y salida del modelo.
Estimated time to complete: 35 min
Includes audio: no
Required plug-ins:  Flash Flash  RealPlayer RealPlayer  Java Java  Adobe® Reader® Adobe® Reader®
* Plug-in information
Last published on: 2007-11-28
close
|

|
Ondas de montaña y vientos de ladera descendentes
description (click to show/hide) |
Quiz
|
 Description: Description:
A menudo, las ondas orográficas o de montaña que se forman arriba y a sotavento de las barreras topográficas representan un peligro importante para el vuelo de montaña debido a la existencia de turbulencias entre fuertes y extremas. Este módulo preparatorio describe las características de las ondas de montaña y estudia las condiciones que las generan. Al igual que los demás módulos preparatorios del Manual de mesoescala (Mesoscale Primer), este módulo comienza con un escenario de pronóstico y concluye con un examen final. Además de una atractiva presentación gráfica, el módulo incluye narración e implica un fuerte componente interactivo.
Objectives:
Al final de este módulo, el estudiante podrá:
En lo referente a los peligros, las características y la climatografía de las ondas de montaña y los vientos de ladera descendentes:
* Identificar al menos 2 peligros asociados con la actividad de ondas de montaña.
* Identificar al menos 3 aspectos atmosféricos y topográficos necesarios para la formación de sistemas de ondas de montaña.
* Describir las principales características de un sistema de ondas de montaña.
* Identificar cuándo y dónde ocurren las ondas de montaña y los vientos de ladera descendentes.
* Identificar el lugar donde se forman los vientos siguientes: chinook, Santa Ana, bora y foehn.
En lo referente a los vientos de ladera descendentes:
* Describir las características de los vientos de ladera descendentes.
* Explicar por qué los vientos de ladera descendentes son calientes.
En lo referente al origen de las ondas de montaña y los vientos de ladera descendentes:
* Explicar por qué el aire que se desplaza sobre una cadena montañosa comienza a oscilar.
* Describir las condiciones que producen el bloqueo topográfico del flujo en términos de altura de la montaña, velocidad del viento, estabilidad y número de Froude.
* Describir los efectos de la cizalladura del viento y las inversiones en la actividad de ondas de montaña.
* Definir el nivel crítico.
* Distinguir entre un nivel crítico autoinducido y un nivel crítico de estado medio.
* Describir los diferentes tipos de rotores y las condiciones atmosféricas con ellos asociados.
* Identificar el tipo de rotor asociado a la turbulencia más intensa.
En lo referente al pronóstico de ondas de montaña y vientos de ladera descendentes:
* Explicar la regla empírica de 1,6.
* Recordar qué grado de resolución requieren los modelos de PNT para representar las ondas de montaña con precisión.
* Describir cómo el sistema de coordenadas verticales del modelo afecta su capacidad de pronosticar las ondas de montaña.
* Describir cómo los radiosondeos y los informes de piloto (PIREP) pueden ayudar a pronosticar las ondas de montaña a corto plazo.
* Describir cómo se pueden usar las imágenes satelitales para detectar la actividad de ondas de montaña, de día o de noche y con o sin nubes.
Estimated time to complete: 2-3 h
Includes audio: no
Required plug-ins:  Flash Flash  RealPlayer RealPlayer  Java Java  Adobe® Reader® Adobe® Reader®
* Plug-in information
Last published on: 2008-07-24
close
|

|
Orientación del Curso Básico de Hidrología
description (click to show/hide) |
No Quiz
|
 Description: Description:
Esta breve presentación proporciona una descripción general del Curso Básico de Hidrología, e incluye: objetivo y público meta, estructura del curso y cómo adaptarlo a sus circunstancias particulares, y una breve descripción de los componentes del curso.
Objectives:
1. Describir el objetivo y público meta del Curso Básico de Hidrología de COMET.
2. Conocer la estructura del Curso Básico de Hidrología y cómo adaptarlo a sus circunstancias particulares.
3. Describir brevemente los componentes del Curso Básico de Hidrología.
Estimated time to complete: 15 min
Includes audio: yes
Required plug-ins:  Flash Flash  RealPlayer RealPlayer  Java Java  Adobe® Reader® Adobe® Reader®
* Plug-in information
Last published on: 2007-10-01
close
|

|
Percepción remota por microondas: nubes, precipitación y vapor de agua
description (click to show/hide) |
Quiz
|
 Description: Description:
Este módulo presenta los productos de percepción remota por microondas generados por satélites polares que describen la humedad en la atmósfera y las tasas de precipitación. El módulo comienza con una explicación de los productos agua precipitable total y agua líquida en las nubes, y los compara con las imágenes infrarrojas de vapor de agua. A continuación el módulo presenta una serie de casos de ejemplo que destacan el papel de las imágenes de agua precipitable total y de tasa de precipitación por microondas para pronosticar con precisión los sistemas meteorológicos. Finalmente, el módulo describe la misión de observación de la precipitación mundial (Global Precipitation Monitoring) para la cual el aporte de los futuros satélites NPOESS será importante. Tardará aproximadamente 75 minutos en terminar este módulo.
Objectives:
Cuando termine de estudiar el módulo, podrá:
- Dar una definición de agua precipitable total (TPW).
- Dar una definición de agua líquida en las nubes (CLW).
- Describir la diferencia entre las regiones de ventana atmosférica y las regiones de absorción del espectro electromagnético.
- Explicar cómo se derivan las tasas de lluvia sobre tierra firme y sobre el océano.
- Describir los objetivos de la misión de medición de la precipitación global (Global Precipitation Measurement Mission).
- Interpretar los productos de agua precipitable total, agua líquida en las nubes y tasa de lluvia a partir
de los casos de ejemplo.
Estimated time to complete: 75 min
Includes audio: no
Required plug-ins:  Flash Flash  RealPlayer RealPlayer  Java Java  Adobe® Reader® Adobe® Reader®
* Plug-in information
Last published on: 2008-04-01
close
|

|
Potencial de precipitación tropical (TraP) operativo derivado por satélite
description (click to show/hide) |
Quiz
|
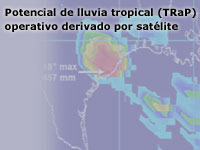 Description: Description:
Este módulo, creado bajo la dirección de Sheldon Kusselson (Satellite Analysis Branch, NESDIS), presenta el desarrollo del producto de potencial de precipitación tropical (TraP) y numerosos ejemplos tomados de las temporadas de huracanes más recientes para comparar las cantidades de precipitación pronosticadas por el modelo, las cantidades de precipitación estimadas por TRaP y las lluvias observadas. El módulo concluye con una serie de pautas para usar el producto TRaP y una descripción de las mejoras previstas para el futuro.
Objectives:
Cuando termine de estudiar el módulo, podrá:
• explicar los fundamentos de la técnica TRaP, así como su formulación y los datos de entrada;
• enumerar las suposiciones y las limitaciones de dicha técnica;
• encontrar y acceder a los productos TRaP en internet;
• interpretar las imágenes TRaP para uso al estimar la precipitación.
Estimated time to complete: 1 h
Includes audio: no
Required plug-ins:  Flash Flash  RealPlayer RealPlayer  Java Java  Adobe® Reader® Adobe® Reader®
* Plug-in information
Last published on: 2008-03-06
close
|

|
Precipitación de mesoescala en bandas
description (click to show/hide) |
Quiz
|
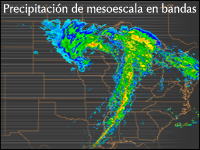 Description: Description:
A menudo, la precipitación cae y se acumula en bandas discretas, con cantidades que varían considerablemente sobre distancias cortas. Este módulo examina varios mecanismos que producen precipitación en bandas de mesoescala, centrándose principalmente en los procesos que operan en los ciclones de latitudes medias. El módulo comienza con una descripción de los modelos de ciclogénesis noruego y de cinta transportadora. A continuación se examinan en detalle varios procesos de precipitación en bandas, incluidas la deformación/frontogénesis, las lenguas de aire cálido en altura (Trowal, o TROugh of Warm air ALoft), la unión de frentes, la inestabilidad condicional simétrica/convección oblicua y las circulaciones inducidas por fusión/evaporación. El módulo concluye con algunas discusiones sobre la representación de la precipitación en bandas por los modelos de PNT y la detección de la precipitación en bandas mediante sensores satelitales.
Estimated time to complete: 3 h
Includes audio: yes
Required plug-ins:  Flash Flash  RealPlayer RealPlayer  Java Java  Adobe® Reader® Adobe® Reader®
* Plug-in information
Last published on: 2007-09-28
close
|

|
Principios de convección I: empuje hidrostático y CAPE
description (click to show/hide) |
Quiz
|
 Description: Description:
Este módulo brinda una breve descripción general de los conceptos de empuje o ascenso hidrostático y Energía Potencial Convectiva Disponible (EPCD) o CAPE, por sus siglas en inglés. Se tratan temas tales como el origen de la flotabilidad en la atmósfera, cómo estimar la fuerza hidrostática a partir de la CAPE y del índice de elevación, los factores que influyen en el empuje hidrostático, incluidos la incorporación de aire de los niveles intermedios en el interior de la nube, la carga de agua, la inhibición convectiva y el origen de las corrientes convectivas descendentes.
Objectives:
Objetivos generales
Al final de este módulo podrá:
1. Describir cómo el empuje hidrostático contribuye a formar las tormentas convectivas y las corrientes ascendentes y descendentes con ellas relacionadas.
2. Definir los términos CAPE, índice de elevación (LI) e inhibición convectiva (CIN) y describir cómo se pueden usar para pronosticar la actividad convectiva.
Objectivos específicos
Al final de este módulo podrá:
1. Definir el empuje hidrostático y enumerar los factores que tienden a aumentarlo.
2. Describir el ciclo de vida de una tormenta convectiva.
3. Definir la CAPE y describir cómo se determina en un diagrama oblicuo T - log p.
4. Definir el índice de elevación (LI) y describir cómo se determina en un diagrama oblicuo T - log p.
5. Describir cómo la CAPE difiere del índice de elevación (LI).
6. Definir la inhibición convectiva (CIN) y enumerar los factores que tienden a aumentarla.
7. Dados dos sondeos, elegir el que producirá la corriente ascendente o descendente más intensa.
Estimated time to complete: 1 h
Includes audio: no
Required plug-ins:  Flash Flash  RealPlayer RealPlayer  Java Java  Adobe® Reader® Adobe® Reader®
* Plug-in information
Last published on: 2008-07-03
close
|

|
Procesos de deshielo de la nieve
description (click to show/hide) |
Quiz
|
 Description: Description:
Este módulo ayuda a comprender el papel del deshielo en el proceso de pronóstico hidrológico. El módulo comienza con una explicación de cómo los factores tales como el viento, el sol, la topografía y la vegetación influyen en la distribución del agua de deshielo y después presenta la evolución de las características de la capa de nieve. Esa base permite estudiar los intercambios energéticos entre la nieve y la atmósfera y cómo influyen en la rapidez y totalidad del derretimiento de la nieve. Finalmente, se explican el movimiento del agua por la nieve y su destino cuando alcanza la superficie del suelo. La lección incluye varios ejemplos breves de casos reales de deshielo.
Objectives:
Describir el desarrollo y la evolución de la capa de nieve:
* explicar los efectos del terreno, del viento, de la vegetación y de la temperatura;
* describir cómo la sublimación afecta la capa de nieve;
* describir el proceso de metamorfismo de la nieve;
* explicar los conceptos de relación nieve a líquido y equivalente en agua de la nieve;
* describir la importancia de los intercambios de energía que tienen lugar en la capa de nieve.
Describir los procesos hasta y durante el deshielo:
* explicar la importancia del intercambio de calor latente;
* describir las condiciones necesarias para el deshielo rápido;
* explicar la importancia de la lluvia para el proceso de deshielo de la nieve.
Describir el destino del agua del deshielo de la nieve:
* describir el movimiento del agua por una capa de nieve acumulada;
* explicar lo que ocurre cuando el agua de deshielo alcanza la superficie del suelo;
* describir una situación en que el deshielo produciría un episodio de escorrentía rápida.
Estimated time to complete: 1 h
Includes audio: yes
Required plug-ins:  Flash Flash  RealPlayer RealPlayer  Java Java  Adobe® Reader® Adobe® Reader®
* Plug-in information
Last published on: 2007-08-29
close
|

|
Procesos de escorrentía
description (click to show/hide) |
Quiz
|
 Description: Description:
El módulo Procesos de escorrentía ofrece una buena introducción a los procesos de escorrentía esenciales para la predicción de avenidas y suministros hídricos. El módulo emplea ilustraciones, animaciones y materiales interactivos para explicar la terminología y los conceptos básicos, incluyendo la producción de escorrentía, las propiedades de cuencas y suelos y el modelado de la escorrentía. También incluye una introducción al sistema de pronósticos fluviales del National Weather Service (NWSRFS). Como este módulo es uno de los temas fundamentales del Curso Básico de Hidrología, se puede estudiar de forma independiente o como tema de apoyo que aporta información científica real a medida que el estudiante termina los módulos de pronóstico planeados basados en casos reales.
Objectives:
Explicar los procesos básicos de escorrentía:
* definir la escorrentía producida por la lluvia
* identificar el movimiento general del agua, tanto en la superficie como en el subsuelo
* reconocer los distintos términos asociados con el agua subterránea y la escorrentía
* comprender la relación existente entre la velocidad de precipitación y deshielo y la infiltración
Describir las trayectorias de la escorrentía:
* identificar los distintos tipos de escorrentía que se producen en la superficie y en el subsuelo
* reconocer el impacto de las propiedades de la superficie y del suelo que influyen en la escorrentía superficial
* comprender las propiedades del suelo que influyen en la escorrentía subsuperficial o interflujo
* prever los tipos de escorrentía que puede esperarse en su zona considerando el índice de pluviosidad, la velocidad de deshielo y las propiedades del suelo
Explicar los asuntos básicos de la cuenca relacionadas con la escorrentía:
* reconocer las características de una cuenca y cómo influyen en los procesos de escorrentía
* explicar el impacto de la urbanización sobre las características de escorrentía
Describir cómo las propiedades del suelo:
* predecir el movimiento del agua y de la escorrentía dadas las características del suelo
* identificar las propiedades del suelo importantes en su zona
* comprender cómo los factores naturales y humanos influyen en el movimiento del agua en el suelo
Describir los conceptos básicos del modelado de escorrentía:
* comprender los conceptos básicos de modelado de escorrentía
* reconocer en qué situaciones es más apropiado un modelo complejo o simple
* describir el funcionamiento de un modelo agrupado
* describir el funcionamiento de un modelo semidistribuido
* describir el funcionamiento de un modelo distribuido, así como sus potenciales ventajas y limitaciones
Describir las características de los modelos básicos del sistema de pronósticos fluviales del Servicio Nacional de Meteorología (NWS) de EE.UU.:
* los principales componentes y subcomponentes del NWSRFS
* los conceptos básicos y componentes principales del modelo SACSMA
* los conceptos básicos y componentes principales de los modelos API y API continuo
Estimated time to complete: 30 min
Includes audio: no
Required plug-ins:  Flash Flash  RealPlayer RealPlayer  Java Java  Adobe® Reader® Adobe® Reader®
* Plug-in information
Last published on: 2006-09-20
close
|

|
Procesos de hielo fluvial
description (click to show/hide) |
Quiz
|
 Description: Description:
Este módulo brinda información sobre las inundaciones asociadas con la obstrucción de los ríos debido a la acumulación de hielo fluvial. Esta adaptación de un webcast presentado por la Dra. Kate White, experta en la materia, explora los procesos básicos del hielo fluvial, incluidos los aspectos de formación, crecimiento, fracturación y transporte, y cómo puede provocar obstrucciones e inundaciones. Además, la Dra. White describe el moderno proceso de pronóstico de hielo y el trabajo de investigación y desarrollo de modelado de hielo que está realizando el Cuerpo de Ingenieros del Ejército de los EE.UU. Como este módulo es uno de los temas fundamentales del Curso Básico de Hidrología, se puede estudiar de forma independiente o como tema de apoyo que aporta información científica real a medida que el estudiante termina los módulos de pronóstico planeados basados en casos reales.
Objectives:
Describir los factores que causan las inundaciones repentinas provocadas por las barreras de hielo:
* usar una terminología uniforme para describir las barreras de hielo;
* describir los procesos básicos del hielo, como su formación, crecimiento, ruptura y transporte;
* explicar por qué se forman las barreras de hielo.
Describir los métodos y las técnicas que se utilizan en la predicción y el pronóstico de las barreras de hielo:
* describir los métodos y las herramientas de modelado que se utilizan actualmente para predecir las barreras de hielo;
* describir los proyectos de investigación y desarrollo que se están realizando en el Laboratorio de Investigación e Ingeniería de las Regiones Frías (Cold Regions Research and Engineering Laboratory, o CRREL), que forma parte del Cuerpo de Ingenieros del Ejército de los Estados Unidos (U.S. Army Corps of Engineers);
* describir otros recursos y herramientas disponibles a través de CRREL.
Estimated time to complete: 1 h
Includes audio: yes
Required plug-ins:  Flash Flash  RealPlayer RealPlayer  Java Java  Adobe® Reader® Adobe® Reader®
* Plug-in information
Last published on: 2007-08-29
close
|

|
Procesos de inundación repentina
description (click to show/hide) |
Quiz
|
 Description: Description:
El Servicio Nacional de Meteorología (National Weather Service, NWS) de NOAA define las crecidas o inundaciones repentinas como crecidas que amenazan la vida de la población y que comienzan dentro de 6 horas (y a menudo dentro de 3 horas) de un evento causante. Dicho evento puede ser una lluvia intensa, la ruptura de un embalse, un dique u otra estructura que retiene el agua, o bien la crecida repentina del nivel del agua asociada con la obstrucción de un río debido a la acumulación de hielo.
Este módulo presenta las características que distinguen las crecidas repentinas, los factores hidrológicos subyacentes que influyen en ellas y el uso de los productos de orientación de crecidas. El módulo emplea ilustraciones, animaciones y materiales interactivos para explicar las diferencias entre las crecidas repentinas y las inundaciones en general, y examina los procesos hidrológicos que influyen en el peligro de que se produzcan crecidas repentinas. Además, el módulo presenta el uso de los productos de orientación de crecidas, incluyendo los derivados de ThreshR y las curvas de lluvia-escorrentía, así como los puntos fuertes y las limitaciones actuales.
Objectives:
Definir una inundación repentina:
* distinguir entre una inundación repentina y una crecida regular;
* identificar los diferentes procesos físicos que provocan las inundaciones repentinas;
* reconocer la conexión entre la intensidad de la precipitación y las características de la escorrentía asociada con las inundaciones repentinas.
Explicar los factores hidrológicos que influyen en las inundaciones repentinas:
* aplicar información sobre los procesos de escorrentía al problema de las inundaciones repentinas;
* explicar por qué ciertas texturas y algunos perfiles del suelo pueden implicar un mayor riesgo de inundaciones repentinas;
* explicar las características físicas que hacen que una cuenca fluvial sea más susceptible a las inundaciones repentinas que otra;
* explicar la rapidez y frecuencia con que las inundaciones repentinas pueden ocurrir en los entornos urbanos;
* explicar el impacto de los incendios y la deforestación para las inundaciones repentinas.
Comprender los problemas clave relacionados con el uso de los productos guía para inundaciones repentinas, o FFG (Flash Flood Guidance):
* definir la guía para inundaciones repentinas;
* explicar el uso del producto de umbral de escorrentía (ThreshR) y las curvas lluvia-escorrentía para derivar la guía para inundaciones repentinas;
* explicar cómo se genera la guía para inundaciones repentinas para diferentes entidades espaciales (cabecera, condado, sobre malla) y duraciones;
* reconocer cómo y cuando las limitaciones pueden afectar los pronósticos.
Estimated time to complete: 1 h
Includes audio: yes
Required plug-ins:  Flash Flash  RealPlayer RealPlayer  Java Java  Adobe® Reader® Adobe® Reader®
* Plug-in information
Last published on: 2007-08-29
close
|

|
Productos de satélites polares para pronósticos operativos: análisis de ciclones tropicales por microondas
description (click to show/hide) |
Quiz
|
 Description: Description:
Este módulo presenta el uso de los productos de imágenes de microondas para observar y analizar los ciclones tropicales. Hoy en día, los datos de microondas de los satélites en órbita polar son esenciales, especialmente al generar pronóstico marítimos, para los cuales las observaciones in situ son escasas. Este módulo incluye información sobre la estructura de las tormentas y técnicas para determinar con mayor precisión la posición de las tormentas mediante los canales de 37 y 85-91 GHz de los sensores de varios satélites. También se presenta información sobre los sensores actuales y la disponibilidad de los productos en la era de NPOESS.
Objectives:
Cuando termine de estudiar el módulo, usted podrá:
• explicar cómo podemos usar las imágenes de microondas de un canal y multiespectrales para identificar los centros de circulación y otras características del interior de los ciclones tropicales;
• explicar cómo el error de paralaje afecta las imágenes en los diferentes canales de microondas;
• identificar los satélites que llevan a bordo generadores de imágenes y sondas atmosféricas de microondas;
• contrastar las estrategias de percepción remota activa y pasiva por microondas;
• contrastar las estrategias de barrido cónico y lateral;
• explicar cómo las nubes, la precipitación y la superficie del océano interactúan con la energía de microondas de distintas frecuencias;
• asociar las características de la tormenta con los elementos observados en las imágenes de microondas.
Estimated time to complete: 60 min
Includes audio: no
Required plug-ins:  Flash Flash  RealPlayer RealPlayer  Java Java  Adobe® Reader® Adobe® Reader®
* Plug-in information
Last published on: 2008-03-13
close
|

|
Pronóstico de tipo e intensidad de engelamiento en aviación
description (click to show/hide) |
Quiz
|
 Description: Description:
Este módulo bilingüe español-inglés presenta las teorías actuales sobre las condiciones atmosféricas asociadas con el engelamiento de aeronaves y aplica dichas teorías al proceso de diagnóstico y pronóstico de engelamiento. También examina el papel de factores tales como el contenido de agua líquida, la temperatura y el tamaño de las gotitas. Se presentan los aspectos de identificación de tipos de engelamiento, la gravedad del engelamiento y los peligros asociados con las características de engelamiento. También se estudian las herramientas que ayudan a diagnosticar los procesos atmosféricos que pueden contribuir al engelamiento y se examina y se aplica en breves ejercicios el caso especial de engelamiento por gotas grandes sobreenfriadas (GGS).
El uso de gráficos, animaciones y ejercicios interactivos ayuda a comprender los procesos de engelamiento, a identificar los peligros de engelamiento y a aplicar las herramientas de diagnóstico y de pronóstico para evaluar y pronosticar las posibles amenazas de engelamiento para las aeronaves. La experta a cargo de este módulo es la Dra. Marcia Politovich de NCAR/Research Applications Program. Este módulo también está disponible en una versión bilingüe inglés-francés.
El objetivo de este módulo de formación es ayudarle a mejorar sus pronósticos de engelamiento. Cuando termine de estudiarlo:
1. Conocerá mejor los tipos de engelamiento de aeronaves y las condiciones y los peligros con ellos relacionados.
2. Entenderá qué factores determinan el tipo y la gravedad del engelamiento, y la relación que existe entre ellos.
3. Sabrá qué procesos físicos crean condiciones favorables para el engelamiento.
4. Podrá reconocer los tipos de ambientes de mesoescala que producen estos tipos de procesos físicos.
5. Conocerá algunas técnicas prácticas y sabrá reconocer ciertos patrones al analizar los productos de datos para identificar las regiones de posible peligro de engelamiento.
Objectives:
Objetivos prácticos
A. Engelamiento de aeronaves
1. Nombrar y distinguir los principales tipos de engelamiento de aeronaves en vuelo, y clasificarlos en términos de peligro potencial para la aviación.
2. Describir las condiciones en las que se forman los principales tipos de engelamiento de aeronaves en vuelo.
3. Nombrar y distinguir las cuatro categorías de informe de gravedad de engelamiento empleadas por los pilotos.
B. Factores de engelamiento
1. Nombrar los factores principales que determinan el tipo y la gravedad del engelamiento que podemos esperar en un entorno dado.
2. Identificar los rangos de valores para contenido de agua líquida (CAL), temperatura y altitud que son más favorables para el engelamiento.
3. Describir el efecto del tamaño de la gotitas sobre la eficiencia de acumulación de las gotas y los patrones de acumulación del hielo.
4. Predecir el tipo de engelamiento más probable y el nivel de gravedad que se puede esperar para ciertos rangos de contenido de agua líquida, temperatura y tamaño de la gotitas.
C. Ambientes y procesos físicos que conducen al engelamiento
1. Describir el impacto de cada una de las seis categorías de transición de fase del agua sobre el engelamiento.
2. Describir varios de los ambientes sinópticos y de mesoescala más favorables para el desarrollo de condiciones de engelamiento peligrosas:
• Tres patrones que intensifican la formación de nubes y, por tanto, el potencial de engelamiento.
• Tres entornos particularmente propicios para la formación de gotas grandes sobreenfriadas (GGS).
• Dos procesos físicos que apoyan la formación de gotas grandes sobreenfriadas (GGS).
• Las condiciones en las cimas de las nubes más favorables para la formación de gotas grandes sobreenfriadas (GGS).
D. Evaluación de datos
1. Evaluar el peligro de engelamiento en varias capas en diagramas oblicuos T - log p.
2. Identificar áreas y capas favorables para la formación de gotas grandes sobreenfriadas integrando los siguientes materiales:
• imágenes de 3,9 micrómetros del GOES
• diagramas oblicuos T - log p
• datos del perfilador del viento
• datos de reflectividad y velocidad de radar WSR-88D
• observaciones de precipitación en la superficie
Estimated time to complete: 3-5 h
Includes audio: no
Required plug-ins:  Flash Flash  RealPlayer RealPlayer  Java Java  Adobe® Reader® Adobe® Reader®
* Plug-in information
Last published on: 2008-06-09
close
|

|
Pronósticos de niebla de radiación
description (click to show/hide) |
Quiz
|
 Description: Description:
Éste es el segundo módulo de la serie Manual de meteorología de mesoescala (Mesoscale Meteorology Primer). Este módulo comienza con un escenario de pronóstico que ocurre durante un evento de niebla de radiación invernal en el Valle Central de California. A continuación, una sección conceptual cubre los procesos físicos de la niebla de radiación a través de su ciclo de vida. El módulo concluye con unas secciones operativas sobre la detección y el pronóstico de niebla.
Objectives:
Cuando termine de estudiar este módulo, usted debería tener los conocimientos que se describen a continuación.
Con respecto a las condiciones previas del ambiente:
* identificar las condiciones clave y los ingredientes necesarios para que se forme niebla de radiación;
* distinguir los ambientes de gran escala y en los niveles inferiores que son favorables o desfavorables para la formación de niebla de radiación;
* describir la secuencia de los procesos en la superficie y en la capa límite que son clave para preparar lo niveles inferiores del ambiente para la formación de la niebla de radiación;
* demostrar que comprende cómo el enfriamiento de la superficie seca la microcapa límite y no permite que la condensación de los niveles inferiores se deposite en la superficie;
* clasificar varias superficies y los respectivos tipos de cubierta vegetal en términos de la rapidez relativa con que el aire de bajo nivel en contacto las superficies alcanza el punto de saturación.
Con respecto a la fase de formación:
* identificar los niveles en los cuales el enfriamiento radiativo es más activo en las distintas etapas del proceso de formación y crecimiento de la niebla;
* demostrar que comprende los efectos de los diferentes tipos de núcleos de condensación y sus concentraciones en la formación de la niebla;
* conocer la secuencia de procesos y eventos fundamentales que ocurren durante la formación de una capa de niebla de radiación;
* demostrar que comprende cómo la niebla misma crea la inversión en la parte superior de la capa de niebla;
* demostrar que comprende la influencia del flujo de calor de la superficie en una capa de niebla durante su formación y crecimiento.
Con respecto a la fase de subsistencia:
* describir los procesos fundamentales que se equilibran mutuamente para permitir que una capa de niebla mantenga un espesor relativamente constante;
* identificar las condiciones dentro y arriba de la capa superior de la niebla que mantienen la producción continua de condensado;
* identificar las condiciones dentro y arriba de la capa superior de la niebla que restringen la profundización vertical;
* demostrar que comprende los efectos de los de núcleos de condensación y sus concentraciones en la subsistencia de la niebla;
* demostrar que comprende los efectos de la introducción de una capa nubosa encima de una capa de niebla desarrollada en la superficie;
* demostrar que comprende la influencia del flujo de calor que proviene de la superficie en una capa de niebla desarrollada;
* identificar el nivel típico de la inversión en la parte superior de la capa de niebla;
* demostrar que comprende cómo la capa de inversión situada en la parte superior de la niebla es alimentada por varios procesos en y arriba de la capa superior de la capa de niebla.
Con respecto a la fase de disipación:
* identificar los procesos fundamentales que contribuyen a la disipación de una capa de niebla;
* aplicar un cálculo de razón de deposición de gotitas para predecir el tiempo necesario para que una capa de niebla de determinado espesor se deposite en el suelo, en ausencia de producción de nuevos condensados;
* demostrar que entiende cómo el calentamiento por radiación contribuye a la disipación de una capa de niebla;
* demostrar que entiende cómo la mezcla turbulenta contribuye a la disipación de una capa de niebla;
* demostrar que entiende cómo los cambios en los vientos en los niveles inferiores contribuyen a la disipación de una capa de niebla;
* demostrar que entiende cómo la introducción de una capa nubosa encima de una capa de niebla contribuye a la disipación de la capa de niebla.
* Con respecto a la detección de la niebla:
identificar las observaciones superficiales que muestran las condiciones atmosféricas que conducen a la formación de niebla de radiación;
* identificar los sondeos verticales que muestran las condiciones atmosféricas que llevan a la formación de niebla de radiación;
* identificar la niebla en las imágenes satelitales;
* describir las limitaciones de las imágenes satelitales infrarrojas para la detección de niebla de radiación.
Con respecto al pronóstico de la niebla:
* describir el ciclo diurno de la ocurrencia de niebla de radiación;
* demostrar que comprende la fuerte dependencia estacional de la ocurrencia de niebla de radiación en al menos dos localidades;
* describir los productos de pronóstico que muestran mejor las condiciones atmosféricas que pueden conducir a la formación de niebla de radiación;
* describir las limitaciones de los modelos de pronóstico numérico para pronosticar niebla de radiación.
Estimated time to complete: 2 h
Includes audio: yes
Required plug-ins:  Flash Flash  RealPlayer RealPlayer  Java Java  Adobe® Reader® Adobe® Reader®
* Plug-in information
Last published on: 2007-09-20
close
|

|
Redacción de pronósticos TAF eficaces
description (click to show/hide) |
Quiz
|
 Description: Description:
Este módulo presenta un panorama general de algunas de las normas más pertinentes en cuanto al uso de las enmiendas al TAF y los grupos condicionales, tal como se describe en la versión más reciente de la instrucción 10-813 acerca de las directivas para los TAF del Servicio Nacional de Meteorología (National Weather Service, o NWS) de EE.UU. También presenta una metodología para el desarrollo y la redacción de los pronósticos de aeródromo que le permitirá crear un producto eficaz y fácil de usar. El módulo se centra principalmente en los aspectos de techo de nubes y visibilidad de los TAF Este módulo forma parte del curso de educación a distancia sobre aviación (Distance Learning Aviation Course 1, o DLAC1) sobre el pronóstico de nieblas y estratos bajos.
Estimated time to complete: 2 h
Includes audio: no
Required plug-ins:  Flash Flash  RealPlayer RealPlayer  Java Java  Adobe® Reader® Adobe® Reader®
* Plug-in information
Last published on: 2006-07-28
close
|

|
Selección del canal del GOES
description (click to show/hide) |
Quiz
|
 Description: Description:
Este módulo web es una adaptación del módulo en CD-ROM titulado Meteorología satelital: uso del nuevo generador de imágenes del GOES, y utiliza Macromedia® Flash para entregar el componente de audio sobre la web.
Esta presentación de 60 minutos de duración pasa reseña brevemente a los cinco canales del generador de imágenes del GOES y su uso, y brinda ejemplos operativos. El módulo incluye asimismo información actualizada acerca del canal de 6,7 µm (vapor de agua) y el nuevo canal de 13,3 µm que comenzará a utilizarse en los satélites GOES N a P.
Estimated time to complete: 30 min
Includes audio: no
Required plug-ins:  Flash Flash  RealPlayer RealPlayer  Java Java  Adobe® Reader® Adobe® Reader®
* Plug-in information
Last published on: 2006-06-21
close
|

|
Teoría del hidrograma unitario
description (click to show/hide) |
Quiz
|
 Description: Description:
La teoría del hidrograma unitario permite estimar el caudal dada la precipitación, lo cual se puede utilizar en la predicción de crecidas. El hidrograma unitario muestra el cambio en el caudal, o flujo, por unidad de escorrentía a lo largo del tiempo a partir del exceso de precipitación. En otras palabras, el hidrograma unitario muestra cómo el caudal de un río se verá afectado con el tiempo por la adición de una unidad de escorrentía. Este módulo presenta de forma completa el uso de los hidrogramas unitarios y la aplicación de la teoría del hidrograma unitario en la predicción de crecidas. El módulo emplea ilustraciones, animaciones y materiales interactivos para explicar terminología y suposiciones clave, presenta los pasos involucrados en la creación de un hidrograma unitario, examina los asuntos relacionados con la aplicación de la teoría de hidrograma unitario y trata ciertas consideraciones importantes en meteorología.
Objectives:
1. Definir los componentes básicos de un hidrograma unitario y de la teoría del hidrograma unitario
• Explicar por qué necesitamos usar los hidrogramas unitarios
• Describir el uso de la teoría del hidrograma unitario como herramienta para predecir la escorrentía
• Definir algunos de los componentes básicos de un hidrograma unitario
2. Identificar términos y suposiciones importantes de la teoría del hidrograma unitario
3. Describir los pasos básicos a seguir para derivar un hidrograma unitario
• Identificar las causas de que un hidrograma unitario no represente con precisión algunos episodios de lluvia
• Explicar el impacto del uso de las unidades métricas o inglesas
• Describir el proceso de aplicar hidrogramas unitarios a tormentas que cubren múltiples duraciones
4. Reconocer las implicancias para el pronóstico cuando se aplica la teoría del hidrograma unitario a episodios de precipitación reales
• Describir los posibles efectos que la cobertura de la tormenta y ciertos cambios que pueden darse en la cuenca pueden tener en los datos de un hidrograma real
Estimated time to complete: 30 min
Includes audio: no
Required plug-ins:  Flash Flash  RealPlayer RealPlayer  Java Java  Adobe® Reader® Adobe® Reader®
* Plug-in information
Last published on: 2006-09-20
close
|

|
Tipos de olas y sus características
description (click to show/hide) |
Quiz
|
 Description: Description:
Éste es el primero de una serie de nuevos módulos sobre meteorología marina basados en los antiguos módulos de COMET sobre meteorología marina publicados en discos láser y CD-ROM. Este módulo es una presentación preliminar de las olas y las características con ellas asociadas. Se presentan varios tipos de olas, desde las olas comunes levantadas por el viento hasta los poco frecuentes tsunamis. Se describen las características físicas básicas de las olas, así como sus características matemáticas y estadísticas y cómo las olas cambian una vez que se transforman en oleaje. Este material sirve como base para los módulos subsiguientes acerca de la generación, propagación y dispersión de olas.
Objectives:
* Enumerar los distintos tipos de olas según las distintas formas de generación.
* Describir las características físicas de estos diferentes tipos de olas, incluidos los aspectos de anatomía y nomenclatura.
* Recordar las expresiones y ecuaciones matemáticas que definen las características físicas de las olas.
* Recordar las características estadísticas de las olas (p. ej.: clasificaciones de espectro y altura de las olas).
* Describir los procesos relacionados con el movimiento y la dispersión del oleaje.
Estimated time to complete: 1 h
Includes audio: yes
Required plug-ins:  Flash Flash  RealPlayer RealPlayer  Java Java  Adobe® Reader® Adobe® Reader®
* Plug-in information
Last published on: 2007-10-30
close
|

|
Tránsito de avenidas
description (click to show/hide) |
Quiz
|
 Description: Description:
Este módulo ofrece una buena introducción a los métodos de tránsito de avenidas y sus aplicaciones el en proceso de generación de pronósticos fluviales. El módulo emplea ilustraciones, animaciones y materiales interactivos para explicar los conceptos básicos del tránsito de avenidas, las características de flujo y las herramientas, centrándose principalmente en los métodos hidrológicos para calcular el tránsito de avenidas. Como este módulo es uno de los temas fundamentales del Curso Básico de Hidrología, se puede estudiar de forma independiente o como tema de apoyo que aporta información científica real a medida que el estudiante termina los módulos de pronóstico planeados basados en casos reales.
Objectives:
Objetivos:
1. Demostrar la comprensión del proceso de tránsito de avenidas
2. Definir el tránsito de avenidas:
a. Interpretar los hidrogramas de nivel y de caudal
b. Describir las aplicaciones del tránsito de avenidas
c. Explicar el papel del tránsito de avenidas en el proceso de predicción de crecidas
d. Describir los enfoques principales empleados para calcular el tránsito de avenidas
3. Describir el concepto de almacenamiento y descarga y el enfoque en el balance de almacenamiento
4. Describir las categorías de flujo y su impacto en la elección del método de cálculo del tránsito de avenidas
5. Definir los términos comunes empleados para describir las características físicas de los ríos
6. Enumerar los factores empleados para determinar la velocidad y el caudal de una corriente de agua mediante la ecuación de Manning
7. Usar las curvas de gastos para determinar la relación nivel-caudal, es decir, el caudal que podemos esperar para determinada profundidad de agua en un punto dado durante un período en particular
8. Explicar los conceptos empleados en el cálculo de tránsito de avenidas:
a. Describir cómo se aplica el proceso de tránsito de avenidas en los pronósticos fluviales
b. Explicar cómo el concepto de almacenamiento se aplica al tránsito de avenidas
c. Describir el enfoque de almacenamiento en cuña y prisma tal como se aplica en el método de Muskingum
9. Aplicar el método de tránsito de avenidas de retardo y K
10. Identificar en qué difieren los métodos hidráulicos para calcular el tránsito de avenidas de los métodos hidrológicos:
a. Reconocer las situaciones en las que conviene seleccionar un método hidráulico en lugar de un método hidrológico
Estimated time to complete: 30 min
Includes audio: no
Required plug-ins:  Flash Flash  RealPlayer RealPlayer  Java Java  Adobe® Reader® Adobe® Reader®
* Plug-in information
Last published on: 2006-09-20
close
|

|
Una Matriz de Tormenta Convectiva: Dependencias Empuje/Cortante
description (click to show/hide) |
No Quiz
|
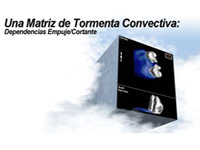 Description: Description:
Con el objeto de ayudar a los pronosticadores a elaborar una estrategia para anticipar las estructuras de una tormenta convectiva, su evolución, y su potencial de desarrollar tiempo severo, el módulo Una Matriz de Tormenta Convectiva brinda a los estudiantes la oportunidad de explorar a fondo las relaciones entre el entorno de una tormenta y su estructura. La matriz se compone de 54 simulaciones numéricas de cuatro dimensiones basadas en la interacción de 16 hodógrafas diferentes y 4 perfiles termodinámicos. Mediante la comparación de visualizaciones animadas de estas simulaciones, los estudiantes estarán en condiciones de discernir las influencias al variar los perfiles de la cortante vertical del viento y el empuje sobre la estructura de la tormenta y su evolución. Una serie de preguntas guían la exploración y ayudan a revelar relaciones entorno/tormenta clave que se evidencian en la matriz. Se incluye como material de referencia una sinopsis de los procesos físicos que controlan la estructura de la tormenta, así como modelos conceptuales actuales de los principales tipos de tormentas convectivas. Entre los expertos en la materia se incluyen el Sr. Steve Keighton, el Sr. Ed Szoke y el Dr. Morris Weisman.
Estimated time to complete: 3-4 h
Includes audio: no
Required plug-ins:  Flash Flash  RealPlayer RealPlayer  Java Java  Adobe® Reader® Adobe® Reader®
* Plug-in information
Last published on: 2005-08-17
close
|

|
Una Matriz MCS
description (click to show/hide) |
No Quiz
|
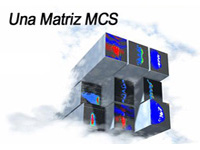 Description: Description:
Este módulo incluye una matriz interactiva de sistemas convectivos de mesoescala (SCM) con simulaciones numéricas que ilustran los procesos físicos que controlan la evolución de los SCM, así como también un archivo del módulo web completo, Sistemas Convectivos de Mesoescala: Líneas de inestabilidad y Ecos en forma de Arco.
La nueva matriz de SCM, que fue desarrollada después del módulo en CD titulado Una Matriz de Tormenta Convectiva, brinda a los estudiantes la oportunidad de explorar a fondo las relaciones entre el entorno de un SCM y su estructura. La matriz se compone de 21 simulaciones numéricas de cuatro dimensiones basadas en la interacción de 10 hodógrafas diferentes con un único perfil termodinámico. Mediante la comparación de una serie de visualizaciones animadas de estas simulaciones, los estudiantes estarán en condiciones de discernir la influencia de la cortante vertical del viento y la fuerza de Coriolis en la estructura y evolución del SCM. Una serie de preguntas guían la exploración y ayudan a revelar las relaciones tormenta/entorno clave que se evidencian en la matriz.
El experto en la materia de este módulo es el Dr. Morris Weisman. Los expertos en la materia del módulo web “Sistemas Convectivos de Mesoescala: Líneas de Inestabilidad y Ecos en forma de Arco” son el Dr. Morris Weisman y el Sr. Ron Przybylinski.
Estimated time to complete: 3-4 h
Includes audio: no
Required plug-ins:  Flash Flash  RealPlayer RealPlayer  Java Java  Adobe® Reader® Adobe® Reader®
* Plug-in information
Last published on: 2005-08-17
close
|

|
Vientos canalizados
description (click to show/hide) |
Quiz
|
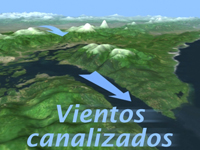 Description: Description:
Este módulo ofrece una presentación básica del mecanismo que produce los vientos canalizados o de desfiladero, sus estructuras típicas y cómo las condiciones a una escala mayor o sinóptica controlan su intensidad y amplitud. Aprenderá sobre varios flujos canalizados importantes de distintas regiones costeras del mundo, aunque prestaremos particular atención a los casos de vientos canalizados completamente documentados del Estrecho de Juan de Fuca y la garganta del Río Columbia. Se presentan técnicas básicas para evaluar y predecir los flujos canalizados. El módulo examina las capacidades y limitaciones de la generación actual de modelos de mesoescala para producir vientos canalizados realistas. Al final del módulo, debería contar con los conocimientos necesarios para diagnosticar y pronosticar flujos canalizados en cualquier lugar del mundo y comprender sus implicancias para las decisiones operativas. Este módulo incluye otras características, como un conciso resumen de referencia rápida y un examen final para poner a prueba sus conocimientos. Como es el caso con otros módulos del Manual de meteorología de mesoescala (Mesoscale Meteorology Primer), este módulo incluye narración, una atractiva presentación gráfica y una versión para imprimir.
Objectives:
Al final de este módulo, el estudiante podrá:
En lo referente a la descripción de los vientos canalizados:
• Recordar dónde en el lugar que produce la canalización se suelen observar las velocidades del viento más fuertes.
• Describir los diferentes tipos de canalizaciones topográficas y sus efectos en el flujo que las atraviesa.
• Enumerar al menos tres peligros naturales que se pueden relacionar con los vientos canalizados.
En lo referente a la estructura de los vientos canalizados:
• Describir cómo varía la velocidad del viento en la canalización durante un episodio de viento canalizado.
• Describir el perfil de temperatura en la canalización durante un episodio de viento canalizado.
• Describir el perfil de presión en la canalización durante un episodio de viento canalizado.
En lo referente al origen de los flujos de vientos canalizados:
• Describir las condiciones necesarias para el flujo geostrófico.
• Recordar que típicamente los vientos canalizados no son geostróficos.
• Describir el origen de los gradientes de presión que ocurren en las zonas de canalización de los vientos.
• Recordar que la rarificación del aire fresco en los niveles inferiores en la salida de una canalización puede aumentar el gradiente de presión en la zona de canalización.
• Recordar que el calentamiento adiabático de los vientos que fluyen cuesta abajo puede aumentar el gradiente de presión en la zona de canalización.
En lo referente al pronóstico de vientos canalizados:
• Describir de forma cualitativa cómo las variaciones en los factores siguientes afectan la velocidad del viento en una zona de canalización:
* gradiente de presión
* rugosidad de superficie
* longitud de la zona de canalización
* temperatura
• Describir la resolución horizontal que requiere un modelo de mesoescala para pronosticar con precisión el flujo a través de una zona de canalización.
Estimated time to complete: 1.5-2 h
Includes audio: no
Required plug-ins:  Flash Flash  RealPlayer RealPlayer  Java Java  Adobe® Reader® Adobe® Reader®
* Plug-in information
Last published on: 2008-07-08
close
|

|
¡Huracán a la Vista!
description (click to show/hide) |
No Quiz
|
 Description: Description:
Ésta es la versión en español del módulo ¡Huracán a la vista!. Este módulo, que fue diseñado principalmente para los estudiantes de sexto a octavo grado, crea un escenario para presentar actividades de aprendizaje centradas en la ciencia y la seguridad en relación con los huracanes. La versión en español es una traducción de la versión de texto en inglés, sin las funciones multimedia, y, por tanto, es apropiada para aquellos estudiantes que tienen impedimentos visuales o cuyo sistema informático no cuenta con un alto ancho de banda.
En el curso de siete días, el huracán Erin se forma en el océano Atlántico, cruza la península de Florida y azota otra vez la costa en Fort Walton Beach. Durante estos días, se presentan al estudiante varios conceptos básicos de las ciencias atmosféricas, el clima y la geografía, y se le ofrece también la oportunidad aprender algunas destrezas importantes de seguridad y preparación que podrían contribuir a salvar vidas. Los maestros y otras personas que utilicen el módulo en el ámbito de la educación pública encontrarán de particular utilidad la información de la sección "Información para maestros".
Objectives:
Practicar actividades relacionadas con la seguridad en caso de huracanes, tales como preparar una mochila con los materiales necesarios en caso de desastre, identificar los artículos apropiados para una emergencia, preparar la casa, decidir las medidas a tomar antes de evacuar y al regresar al hogar, y escoger las acciones adecuadas durante un huracán. Identificar los factores importantes en la formación y el movimiento de los huracanes. Comprender dónde y cuándo se forman los huracanes y cómo se clasifican.
Estimated time to complete: 2 h
Includes audio: no
Required plug-ins:  Flash Flash  RealPlayer RealPlayer  Java Java  Adobe® Reader® Adobe® Reader®
* Plug-in information
Last published on: 2005-09-13
close
|

|
¿Cómo producen los modelos la precipitación y las nubes?
description (click to show/hide) |
Quiz
|
 Description: Description:
Brinda información importante desde el punto de vista operativo sobre los esquemas de parametrización de nubes y precipitación y los esquemas de parametrización de la convección. Analiza cómo estas parametrizaciones pueden afectar a la capacidad del modelo de representar y pronosticar la precipitación.
Estimated time to complete: 3 h
Includes audio: no
Required plug-ins:  Flash Flash  RealPlayer RealPlayer  Java Java  Adobe® Reader® Adobe® Reader®
* Plug-in information
Last published on: 2005-08-23
close
|
return to top^
French
content level: 0=for non-scientists, 1=basic, 2=intermediate, 3=advanced
| Level |
Module Title and Link |
Quiz Link |

|
ASMET - Satellite Meteorology in Africa, Volume 1
description (click to show/hide) |
No Quiz
|
This module is not available on the Web. To order a CD, please see our contact information.
 Description: Description:
This module presents the scientific and technical basis for using satellite imagery, so that forecasters and other users can develop locally and regionally useful techniques for observing and forecasting the behavior of the atmosphere. The module reviews remote sensing and radiative transfer theory through a series of conceptual models. The discussions contain explanations of the different imager channels and the phenomena that the channels can monitor individually and in combination. The module contains imagery from the EUMETSAT Meteosat satellite and the U.S. geostationary operational environmental satellite (GOES) series.
The module is a modification of the earlier COMET module, Satellite Meteorology: Remote Sensing Using the New GOES Imager. The following changes were made to make it more relevant to African forecasters:
* Most of the GOES imagery was replaced with Meteosat imagery over Africa
* The content discussions were changed to reflect the new imagery
* Questions and interactions were added to enhance learning
* There are French and English versions to serve a bilingual audience
The module was developed as part of the ASMET (African Satellite Meteorology Education and Training) project, the goal of which was to reduce the impact of weather-related disasters in Africa by training meteorologists to produce better forecasts using the satellite meteorological data available to them. The project was sponsored by the German Federal Ministry for Economic Cooperation and Development and the European Organisation for the Exploitation of Meteorological Satellites (EUMETSAT).
Estimated time to complete: 6 h
Includes audio: no
Required plug-ins:  Flash Flash  RealPlayer RealPlayer  Java Java  Adobe® Reader® Adobe® Reader®
* Plug-in information
Last published on: 1997-01-01
close
|

|
Comment les modèles produisent les précipitations et les nuages
description (click to show/hide) |
Quiz
|
 Description: Description:
Part of the Numerical Weather Prediction Professional Development Series, this module explores how NWP models handle precipitation and cloud processes through parameterizations and/or explicit methods, with an emphasis on how a model's treatment of these processes affects its ability to depict and forecast precipitation and other related forecast variables.
The subject matter expert for this module is Dr. Ralph Petersen of the National Centers for Environmental Prediction, Environmental Modeling Center (NCEP/EMC).
Estimated time to complete: 3-6 h
Includes audio: no
Required plug-ins:  Flash Flash  RealPlayer RealPlayer  Java Java  Adobe® Reader® Adobe® Reader®
* Plug-in information
Last published on: 2007-08-08
close
|

|
Comprendre l'assimilation des données: Comment les modèles créent leurs conditions initales
description (click to show/hide) |
Quiz
|
 Description: Description:
This module explains the process by which data are used in NWP models and the ever-increasing importance that data assimilation has on the quality of numerical forecasts. It provides learners an appreciation for how models use data as a function of model resolution and data type, how data influence the analysis, the limitations of data assimilation systems, the importance of initial conditions on the quality of NWP guidance, as well as the challenges of assessing the quality of NWP guidance based on the initial conditions.
The subject matter expert for this module is Dr. Ralph Petersen of the National Centers for Environmental Prediction, Environmental Modeling Center (NCEP/EMC).
Estimated time to complete: 3-4 h
Includes audio: no
Required plug-ins:  Flash Flash  RealPlayer RealPlayer  Java Java  Adobe® Reader® Adobe® Reader®
* Plug-in information
Last published on: 2007-11-19
close
|

|
Conséquences de la structure et de la dynamique des modèles
description (click to show/hide) |
Quiz
|
 Description: Description:
Impact of Model Structure & Dynamics, part of the Numerical Weather Prediction Professional Development Series and the NWP Distance Learning Course, provides operationally significant information about model type, horizontal resolution, vertical coordinate systems, vertical resolution, and domain and boundary conditions, with an emphasis on how each aspect can affect a model's ability to depict and forecast weather.
The subject matter expert for this module is Dr. Ralph Petersen of the National Centers for Environmental Prediction, Environmental Modeling Center (NCEP/EMC).
Estimated time to complete: 3-5 h
Includes audio: no
Required plug-ins:  Flash Flash  RealPlayer RealPlayer  Java Java  Adobe® Reader® Adobe® Reader®
* Plug-in information
Last published on: 2007-06-01
close
|

|
De mm à cm... Étude des rapports neige/eau liquide au Québec
description (click to show/hide) |
No Quiz
|
 Description: Description:
Dans son oeuvre détaillée de 130 pages, Ivan Dubé du Service météorologique du Canada nous rappelle les processus physiques qui déterminent la densité de la neige, et élabore un nouvel algorithme qui permet la diagnose et la prévision améliorées de la densité de la neige. Ce travail est basé sur les données recueillies au Québec. Le document discute aussi les résultats d’un programme de vérification de l’algorithme, et se termine avec quelques cas pour illustrer son utilisation.
Estimated time to complete: 10 h
Includes audio: no
Required plug-ins:  Flash Flash  RealPlayer RealPlayer  Java Java  Adobe® Reader® Adobe® Reader®
* Plug-in information
Last published on: 2003-06-00
close
|

|
Détermination de caractéristiques dynamiques à l'aidede l'imagerie satellitaire
description (click to show/hide) |
No Quiz
|
 Description: Description:
Cette série est à propos de l´utilisation des images satellitaires et met l´accent sur l´identification des caractéristiques dynamiques en utilisant les images satellitaires de haute résolution avec la vérification de la prévision numérique du temps (PNT). Cette série va finalement comprendre plus que 20 présentations sur les sujets comme les nuages en forme de virgule, les courants-jet, les zones de déformation, les caractéristiques de surface, la convection et le blocage.
Chaque présentation comprend des exercices d´identification interactifs, l´analyse et la diagnostique, les modèles conceptuels, et les implications des prévisions. Il faut à peu près 40 minutes pour compléter chaque présentation dans la série.
Objectives:
• Analyser et diagnostiquer les caractéristiques dynamiques des images satellitaires
• Identifier les différences entres les prévisions numériques et les caractéristiques atmosphériques
• Appliquer les modèles conceptuels et corriger les différences entre les observations et les modèles
Estimated time to complete: 40 min
Includes audio: no
Required plug-ins:  Flash Flash  RealPlayer RealPlayer  Java Java  Adobe® Reader® Adobe® Reader®
* Plug-in information
Last published on: 2006-01-10
close
|

|
Dix idées fausses en PNÉT
description (click to show/hide) |
Quiz
|
 Description: Description:
This module introduces forecasters to ten of the most commonly encountered or significant misconceptions about NWP models. This list of ten misconceptions includes issues surrounding data assimilation, model resolution, physical parameterizations, and post-processing of model forecast output.
Estimated time to complete: 100 min
Includes audio: no
Required plug-ins:  Flash Flash  RealPlayer RealPlayer  Java Java  Adobe® Reader® Adobe® Reader®
* Plug-in information
Last published on: 2007-06-01
close
|

|
Influence de la physique des modèles de prévision numérique des
éléments du temps (PNÉT)
description (click to show/hide) |
Quiz
|
 Description: Description:
This module describes model parameterizations of sub-surface, boundary-layer,and free atmospheric processes, such as surface snow processes, soil characteristics, vegetation, evapotranspiration, PBL processes and parameterizations, and trace gases, and their interaction with the radiative transfer process. It specifically addresses how models treat these physical processes and how they can influence forecasts of sensible weather elements.
Objectives:
Working through the material will help you to
• Develop a basic understanding of how radiation and associated processes are emulated in NWP models
• Understand when model physics are most important to the model forecast (versus model dynamics)
• Understand that model physics are specifically tuned to work best in certain situations and specific models
• Understand that model physics parameterizations affect other parameterizations, model dynamics, and data assimilation, which may result in feedbacks
• Identify impacts of model physics and their errors on model forecasts both at and around the forecast location
• Identify effects that are smaller than the model can emulate (for example, the resolution of surface characteristics is coarse but real effects occur at fine resolution)
Estimated time to complete: 1.5 h
Includes audio: no
Required plug-ins:  Flash Flash  RealPlayer RealPlayer  Java Java  Adobe® Reader® Adobe® Reader®
* Plug-in information
Last published on: 2007-08-21
close
|

|
La prévision d'ensemble expliquée
description (click to show/hide) |
Quiz
|
 Description: Description:
This module, the latest in our series on Numerical Weather Prediction, covers the theory and use of ensemble prediction systems (EPSs). The module will help forecasters develop an understanding of the basis for EPSs, the skills to interpret ensemble products, and strategies for their use in the forecast process. It contains six sections: an Introduction that briefly presents background theory; Generation, which describes how ensemble systems are constructed; Statistical Concepts, which provides a brief refresher on knowledge required for ensemble product interpretation; Summarizing Data, which describes common ensemble forecast products; Verification, which discusses how EPSs performance is assessed and documented; and Case Applications, which provides links to a number of forecast cases illustrating the use of EPSs in the forecast process. Questions and Exercises are offered throughout to help you test your learning and provide practical examples. The module also includes a pre-assessment and module final quiz.
Objectives:
Explain the basis for NWP ensemble prediction, and what we mean when we say that the atmosphere is chaotic (i.e. sensitive to initial conditions).
Describe the variety of methods used to generate the ensemble members of an ensemble prediction system, including perturbation of initial conditions, boundary conditions, and model configurations.
Understand the basic statistical concepts and methods used in the development of ensemble products, including probability distributions and their middleness, variability, and shape characteristics.
Recognize and interpret the variety of ensemble forecast products, including spatial and point forecast graphics, and including those that account for flow regimes (RMOP) and reveal NWP model bias and errors.
Interpret ensemble verification products, and apply them in using ensemble forecasts.
Estimated time to complete: 4-5 h
Includes audio: no
Required plug-ins:  Flash Flash  RealPlayer RealPlayer  Java Java  Adobe® Reader® Adobe® Reader®
* Plug-in information
Last published on: 2007-12-07
close
|

|
La prevision du type et de l'intensite de givrage en vol
description (click to show/hide) |
No Quiz
|
 Description: Description:
This is the French version of this module.
This module discusses the current theories of atmospheric conditions associated with aircraft icing and applies the theories to the icing diagnosis and forecast process. The contribution of liquid water content, temperature, and droplet size parameters to icing are examined. Identification of icing type, icing severity, and the hazards associated with icing features are presented. Tools to help diagnose atmospheric processes that may be contributing to icing and the special case of supercooled large drop (SLD) icing are examined and applied in short exercises.
The use of graphics, animations, and interactive exercises in Forecasting Aviation Icing: Icing Type and Severity helps the forecaster to gain an understanding of icing processes, to identify icing hazards, and to apply diagnosis and forecast tools as aids to evaluate and anticipate potential aircraft icing threats.
The subject matter expert for this module is Dr. Marcia Politovich of NCAR/Research Applications Program.
This module is also available in English.
Objectives:
The goal of this training module is to help you improve your icing forecasts by
1. Becoming more familiar with the types, conditions, and hazards of aircraft icing.
2. Learning what factors determine icing type and severity, and how they interrelate.
3. Knowing what physical processes create favorable icing conditions.
4. Recognizing the types of mesoscale environments that generate such physical processes.
5. Learning some techniques to apply and patterns to look for when diagnosing data products for possible icing threats.
Performance Objectives
A. Aircraft Icing
1. Name and distinguish between the main types of in-flight aircraft icing; rank them in terms of potential hazard to aviation.
2. Describe the conditions under which the main types of in-flight aircraft icing form.
3. Name and distinguish between the four icing severity reporting categories used by pilots.
B. Icing Factors
1. Name the main factors that determine the type and severity of icing to expect in a given environment.
2. Identify ranges of values for liquid water content, temperature, and altitude that are most favorable to icing.
3. Describe the influence of droplet size on ice collection efficiency and accretion pattern.
4. Predict the most likely icing type and severity level to expect for given ranges of cloud liquid water content, temperature, and droplet size.
C. Icing Environments and Physical Processes
1. Describe the impact to icing of each of the six categories of water phase transitions.
2. Describe several of the most favorable synoptic and mesoscale environments for development of hazardous icing conditions:
• Three patterns that enhance cloud formation and hence icing potential
• Three environments that are especially conducive to supercooled large drop formation
• Two physical processes that support supercooled large drop formation
• Cloud-top conditions most favorable to supercooled large drop formation
D. Data Assessment
1. Assess the icing threat in various layers of skew T-log p diagrams.
2. Identify favorable areas and layers for supercooled large drop formation integrating:
• GOES 3.9 micron imagery
• Skew-T diagrams
• Profiler data
• WSR-88D reflectivity and velocity
• Surface precipitation observations
Estimated time to complete: 3-5 h
Includes audio: no
Required plug-ins:  Flash Flash  RealPlayer RealPlayer  Java Java  Adobe® Reader® Adobe® Reader®
* Plug-in information
Last published on: 2005-10-01
close
|

|
Les cartes de tourbillon potentiel équivalent du Centre météorologique canadien
description (click to show/hide) |
No Quiz
|
 Description: Description:
Les cartes de TPE, produites au CMC deux fois par jour, sont disponibles au Web à l’adresse fournie dans ce document. Il s’y trouve aussi une liste de facteurs synoptiques destiné aux météorologues d’exploitation pour encadrer leur utilisation des cartes de TPE dans l’identification et la prévision des régions de l’ICS et de la convection penchée.
Estimated time to complete: 20 min
Includes audio: no
Required plug-ins:  Flash Flash  RealPlayer RealPlayer  Java Java  Adobe® Reader® Adobe® Reader®
* Plug-in information
Last published on: 2002-01-05
close
|

|
Maximums de tourbillon et configurations en virgule
description (click to show/hide) |
Quiz
|
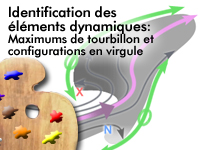 Description: Description:
Les signatures des maximums de tourbillon sont très courantes et indiquent des zones de circulation ascendante et de forçage atmosphérique. La localisation exacte des maximums de tourbillon est cruciale pour la localisation des caractéristiques dynamiques connexes comme l'axe de vents maximums et les zones de déformation.
Objectives:
* Identifier et prévoir les maximums de tourbillon afin de prévoir les zones d'advection positive de tourbillon
* Identifier les axes connexes des vents maximums, les zones de déformation et les masses d'air
Estimated time to complete: 30-40 min
Includes audio: no
Required plug-ins:  Flash Flash  RealPlayer RealPlayer  Java Java  Adobe® Reader® Adobe® Reader®
* Plug-in information
Last published on: 2006-05-22
close
|

|
Minimums de tourbillon et configurations en virgule miroir
description (click to show/hide) |
Quiz
|
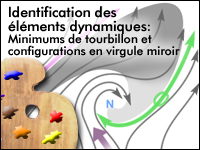 Description: Description:
Les signatures des minimums de tourbillon sont tout aussi courantes et importantes que celles des maximums de tourbillon. Il est tout aussi important de diagnostiquer où il y a un forçage atmosphérique de descente que d’identifier les zones de forçage atmosphérique d’ascension.
Objectives:
* Identifier et prévoir les minimums de tourbillon afin de prévoir les zones d’advection négative de tourbillon
* Identifier les axes connexes de vents maximums, les zones de cisaillement, les zones de déformation et les masses d’air
Estimated time to complete: 30-40 min
Includes audio: no
Required plug-ins:  Flash Flash  RealPlayer RealPlayer  Java Java  Adobe® Reader® Adobe® Reader®
* Plug-in information
Last published on: 2006-05-22
close
|

|
Principes fondamentaux des modèles
description (click to show/hide) |
Quiz
|
 Description: Description:
Model Fundamentals, part of the Numerical Weather Prediction Professional Development Series and the NWP Distance Learning Course, describes the components of an NWP model and how they fit into the forecast development process. It also explores why parameterization of many physical processes is necessary in NWP models.
The module covers background concepts and terminology necessary for learning from the other modules in this series on NWP.
The subject matter expert for this module is Dr. Ralph Petersen of the National Centers for Environmental Prediction, Environmental Modeling Center (NCEP/EMC).
Estimated time to complete: 1 h
Includes audio: no
Required plug-ins:  Flash Flash  RealPlayer RealPlayer  Java Java  Adobe® Reader® Adobe® Reader®
* Plug-in information
Last published on: 2007-06-01
close
|

|
Une Introduction au Système Polaire EUMETSAT (EPS)
description (click to show/hide) |
Quiz
|
 Description: Description:
Ce Webcast est destiné à donner un aperçu du Système polaire EUMETSAT (EPS), le premier programme opérationnel européen en orbite polaire spécifiquement conçu pour la météorologie.
EPS représente la contribution d'EUMETSAT au Système polaire initial conjoint IJPS, au titre d'un accord de coopération conclu entre EUMETSAT et la NOAA en vue d'assurer la fourniture des données essentielles pour l'amélioration des services opérationnels de prévision météorologique et environnementale et de surveillance du climat dans le monde entier.
EPS est un système innovant et hautement performant, tant au niveau de ses capacités de sondage que de débit de données. Ses principaux bénéficiaires seront entre autres les systèmes de prévision numérique (NWP).
La présentation du Webcast dure 60 minutes environ.
Objectives:
A conclusion de la présentation, l'étudiant sera en mesure de:
* Identifier les trois disciplines auxquelles EPS va contribuer
* Décrire le rôle d'EPS dans le Système mondial Global Opérationnel d'observation par satellites et le Système polaire initial conjoint
* Décrire les différences majeures entre les satellites à défilement, en orbite polaire, et ceux en orbite géostationnaire
* Décrire les éléments du programme EPS et comment ils contribuent au flux des produits et données
* Identifier les instruments du satellite Metop et leurs applications prinicpales principales applications
* Décrire les capacités et apports attendus du sondeur hyperspectral IASI
* Décrire les principaux services fournis par EPS
Estimated time to complete: 1 h
Includes audio: yes
Required plug-ins:  Flash Flash  RealPlayer RealPlayer  Java Java  Adobe® Reader® Adobe® Reader®
* Plug-in information
Last published on: 2007-03-15
close
|

|
Utilisation intelligente des produits dérivés des modèles
description (click to show/hide) |
Quiz
|
 Description: Description:
This module was developed and released in three sections: Postprocessing/Products, Statistical Guidance, and Assessment Tools. Specific topics covered include the impact of postprocessing and how to account for it, the statistical methods used to enhance raw model output including how statistical guidance products like MOS are generated, as well as NWP verification methodologies and use of daily model diagnostics.
The subject matter expert for this module is Dr. Ralph Petersen of the National Centers for Environmental Prediction, Environmental Modeling Center (NCEP/EMC), and J. Paul Dallavalle of the National Weather Service (NWS), Meteorological Development Laboratory, Statistical Modeling Branch (MDL/SMB). The primary content author was Kirby Cook, NWS, Western Region Headquarters (WRH)/Scientific Services Division (SSD).
Estimated time to complete: 1-2 h
Includes audio: no
Required plug-ins:  Flash Flash  RealPlayer RealPlayer  Java Java  Adobe® Reader® Adobe® Reader®
* Plug-in information
Last published on: 2007-10-02
close
|
return to top^
Russian
content level: 0=for non-scientists, 1=basic, 2=intermediate, 3=advanced
| Level |
Module Title and Link |
Quiz Link |

|
Научный взгляд на изменение климата и влияние антропогенной деятелъности
description (click to show/hide) |
No Quiz
|
 Description: Description:
This is the Russian translation of "The Science of Global Climate Change and Human Influences" a Webcast by Dr. Kevin Trenberth of NCAR’s Climate and Global Dynamics division. The presentation includes evidence that the atmosphere is changing, discussions on global energy flows and human factors contributing to change, and concludes with predictions for the future.
Estimated time to complete: 1 h
Includes audio: yes
Required plug-ins:  Flash Flash  RealPlayer RealPlayer  Java Java  Adobe® Reader® Adobe® Reader®
* Plug-in information
Last published on: 2006-10-26
close
|

|
Плавучесть и ДКПЭ (Buoyancy and Cape)
description (click to show/hide) |
No Quiz
|
 Description: Description:
This is a Russian translation of the COMET module, Buoyancy and CAPE, which is part of the Mesoscale Primer series. Topics covered include the origin of atmospheric buoyancy, estimating buoyancy using the CAPE and Lifted Index, factors that affect buoyancy including entrainment of mid-level air, water loading, and convective inhibition, and the origin of convective downdrafts. The translation was done by Edward Podgaisky, who visited COMET in 2003 as a IREX grant recipient to study distance learning delivery in meteorology.
Estimated time to complete: 24 min
Includes audio: yes
Required plug-ins:  Flash Flash  RealPlayer RealPlayer  Java Java  Adobe® Reader® Adobe® Reader®
* Plug-in information
Last published on: 2003-09-22
close
|
return to top^
Portuguese
content level: 0=for non-scientists, 1=basic, 2=intermediate, 3=advanced
| Level |
Module Title and Link |
Quiz Link |
 |
Estudo do Ciclo Hidrológico
description (click to show/hide) |
Quiz
|
 Description: Description:
O objetivo deste módulo é ajudá-lo a compreender os elementos do ciclo hidrológico para o uso mais eficaz das fontes de dados e ferramentas de previsão. Com o uso de ilustração, animação e interação, este módulo examina os conceitos básicos do ciclo hidrológico, incluindo a distribuição da água, água atmosférica, água da superfície, água subterrânea, neve e degelo.
Estimated time to complete: 1.5 - 2 h
Includes audio: no
Required plug-ins:  Flash Flash  RealPlayer RealPlayer  Java Java  Adobe® Reader® Adobe® Reader®
* Plug-in information
Last published on: 2008-05-28
close
|
return to top^
|
 Description:
  Description:
  Description:
  Description:
  Description:
  Description:
  Description:
  Description:
  Description:
  Description:
  Description:
  Description:
  Description:
  Description:
  Description:
  Description:
  Description:
  Description:
  Description:
  Description:
  Description:
  Description:
  Description:
  Description:
  Description:
  Description:
  Description:
  Description:
  Description:
  Description:
  Description:
  Description:
  Description:
  Description:
  Description:
  Description:
  Description:
  Description:
  Description:
  Description:
  Description:
  Description:
  Description:
  Description:
  Description:
  Description:
  Description:
  Description:
  Description:
  Description:
  Description:
  Description:
  Description:
  Description:
  Description:
  Description:
  Description:
  Description:
  Description:
  Description:
  Description:
  Description:
  Description:
  Description:
  Description:
  Description:
  Description:
  Description:
  Description:
  Description:
  Description:
  Description:
  Description:
  Description:
  Description:
  Description:
  Description:
  Description:
  Description:
  Description:
  Description:
  Description:
  Description:
  Description:
  Description:
  Description:
  Description:
  Description:
  Description:
  Description:
  Description:
  Description:
  Description:
  Description:
  Description:
  Description:
  Description:
  Description:
  Description:
  Description:
  Description:
  Description:
  Description:
  Description:
  Description:
  Description:
  Description:
  Description:
  Description:
  Description:
  Description:
  Description:
  Description:
  Description:
  Description:
  Description:
  Description:
  Description:
  Description:
  Description:
  Description:
  Description:
  Description:
  Description:
  Description:
  Description:
  Description:
  Description:
  Description:
  Description:
  Description:
  Description:
  Description:
  Description:
  Description:
  Description:
  Description:
  Description:
  Description:
  Description:
  Description:
  Description:
  Description:
  Description:
  Description:
  Description:
  Description:
  Description:
  Description:
  Description:
  Description:
  Description:
  Description:
  Description:
  Description:
  Description:
  Description:
  Description:
  Description:
  Description:
  Description:
  Description:
  Description:
  Description:
  Description:
  Description:
  Description:
  Description:
  Description:
  Description:
  Description:
  Description:
  Description:
  Description:
  Description:
  Description:
  Description:
  Description:
  Description:
  Description:
  Description:
  Description:
  Description:
  Description:
  Description:
  Description:
  Description:
  Description:
  Description:
  Description:
  Description:
  Description:
  Description:
  Description:
  Description:
  Description:
  Description:
  Description:
  Description:
  Description:
  Description:
  Description:
  Description:
  Description:
  Description:
  Description:
  Description:
  Description:
  Description:
  Description:
  Description:
  Description:
  Description:
  Description:
  Description:
  Description:
  Description:
  Description:
  Description:
  Description:
  Description:
  Description:
  Description:
  Description:
  Description:
  Description:
  Description:
  Description:
  Description:
  Description:
  Description:
  Description:
  Description:
  Description:
  Description:
  Description:
  Description:
  Description:
  Description:
  Description:
  Description:
  Description:
  Description:
  Description:
  Description:
  Description:
  Description:
  Description:
  Description:
  Description:
  Description:
  Description:
  Description:
  Description:
  Description:
  Description:
  Description:
  Description:
  Description:
  Description:
  Description:
  Description:
  Description:
  Description:
  Description:
  Description:
  Description:
  Description:
  Description:
  Description:
 .gif)
