


Facility Statistics
DOE requires quarterly reports that address facility operations hours (which relate directly to data availability) and the number of users. The number of users include site visitors as well as computer accounts of those requesting data. Safety and publication statistics are also being reported. Beginning in Fiscal Year 2004, this information is provided for the entire facility as well as by individual site by fiscal year in a quarterly report. Below is a quick overview of the current numbers.
FY 2008 Statistics at a Glance
| FY2008 | Q1 | Q2 | Q3 | Q4 | Total |
|---|---|---|---|---|---|
| Goals (hrs) | 1987.00 | 1944.00 | 1966.00 | 1987.00 | 7884.00 |
| Actual (hrs) | 2075.52 | 2065.12 | 2081.35 |
FY 2007 Statistics at a Glance
| FY2007 | Q1 | Q2 | Q3 | Q4 | Total |
|---|---|---|---|---|---|
| Goals (hrs) | 1987.20 | 1944.00 | 1965.60 | 1987.20 | 7884.00 |
| Actual (hrs) | 2082.88 | 2052.00 | 2002.00 | 2024.07 | 8161.00 |
= Goal Met
Table 1. Operational Statistics for the ACRF Sites* for the Period of April 1 - June 30, 2008
| Hours of Operation | Data Availability (%) | ||||
|---|---|---|---|---|---|
| SITE | OPSMAX | ACTUAL | VARIANCE | GOAL | ACTUAL |
| NSA | 1965.60 | 2096.64 | -0.0667 | 0.90 | 0.96 |
| SGP | 2074.80 | 2024.57 | +0.0242 | 0.95 | 0.93 |
| TWP | 1856.40 | 2125.03 | -0.1447 | 0.85 | 0.97 |
| Site Average | 1965.60 | 2081.35 | -0.0589 | 0.90 | 0.95 |
| *Because of the complications in getting approvals for releasing the data from the AMF in Shouxian, stored data have not yet been transmitted from the China to the Data Management Facility at the time of this report. | |||||
Figures 1 and 2. User Statistics for the Period of July 1, 2007 - June 30, 2008
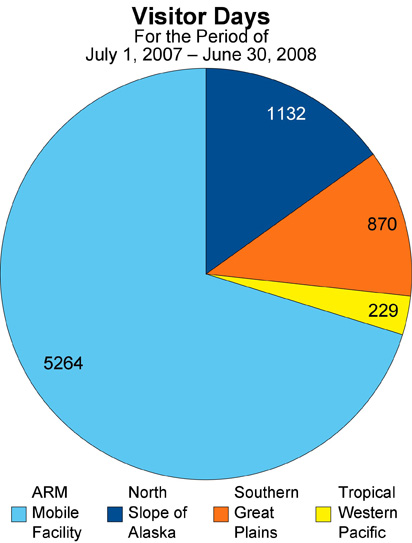
Figure 1. Total Number of Visitor Days by Site. Click on the chart for a larger version of the image.

Figure 2. Summary of the ACRF User Site Visits, Archive Accounts, and Research Computer Accounts. Click on the chart for a larger version of the image.