Local forecast by
"City, St" or zip code |
Search by city or zip code. Press enter or select the go button to submit request |
|
Wilma
 |
Hurricane Wilma
|
October
24, 2005
|
|
Wilma was a classic October hurricane which
struck South Florida as a Category 3 hurricane on October 24th, 2005.
Wilma developed from a tropical depression near Jamaica, a typical
source region for October tropical cyclones, on the
afternoon of October 15, 2005. It became the 21st named storm of the
season during the morning hours of October 17, 2005, which tied the
record
for the most named storms in one season originally set back in 1933.
Wilma underwent a
rapid intensification cycle which began on October 18th and ended in
the early morning hours of October 19th, with a central pressure
decrease of an incredible 88 mb in only 12 hours! The central
pressure reached 882 mb, making Wilma the most intense hurricane ever
in
the Atlantic Basin, a full 6 mb lower than Hurricane Gilbert in
September 1988. Figure 1
(left) illustrates a
satellite picture of Wilma shortly after its time of peak intensity.
Wilma
went on to make landfall on Cozumel Island just off the Yucatan
Peninsula as a strong
category 4 hurricane on Friday, October 21st, then drifted erratically
over the Yucatan Peninsula through Saturday evening October
22nd.
Wilma began to move off the northeast coast of the
Yucatan Peninsula on the night of the 22nd, then gradually accelerated
northeast over the southern Gulf of Mexico toward South Florida as a
strong mid and upper-level trough over the central United States moved
south and forced a southwesterly steering flow. The hurricane made landfall
as a
category 3 storm shortly before 7 AM Monday, October 24th on the
southwest Florida
coast between Everglades City and Cape Romano. Figure 2 shows an infrared
satellite image, while Figures 3 and 4 illustrate radar reflectivity and
velocity images/loops of Wilma while crossing the peninsula. Figure 5
illustrates Wilma's track across South Florida.
Wilma exhibited a very large 55 to 65 mile-wide eye while
crossing the state, and the eye covered large portions of South
Florida, including the eastern two-thirds of Collier County, extreme
northwestern Miami-Dade County, the southern and eastern third of
Hendry County, most of Broward County, and all of Palm Beach County.
The eye also clipped the southeastern shore of Lake Okeechobee. The eye
wall, the part of the storm with the strongest winds, affected
virtually all of South Florida. Around 10:30 AM, a
South Florida Water Management District (SFWMD)
meteorological station located at the south end of Lake
Okeechobee reported sustained winds of 103 mph.
Sustained hurricane force winds (74 mph or greater) were
observed over all areas except Hendry and Glades counties, and even
those two counties measured hurricane force gusts. The
highest recorded gusts were in the 100-120 mph range.
An interesting and revealing aspect of Wilma was the wind field
in the eye wall. The winds on the back (south/west) side of the
eye wall were as strong, if not stronger, than those on the front
(north/east) side. This goes against the common, but sometimes
erroneous, belief that the strongest winds in a hurricane are always
in the right-front quadrant of the storm. This occurred
over much of South Florida, except for central and southern Miami-Dade
County which barely missed the southwestern portion of the eye
wall, and likely contributed to the heavier damage across Broward and Palm
Beach counties compared to slightly lesser damage across much of Miami-Dade and
Collier counties.
The following are some preliminary maximum
sustained winds and peak gusts observed across South Florida:
| Location |
Maximum Sustained Wind |
Maximum Peak Wind |
| Miami International |
67 mph at 830 AM |
92 mph at 752 and 756AM |
| Fort Lauderdale |
70 mph at 811 AM |
99 mph at 830 AM |
| Palm Beach International |
82 mph at 910 AM |
101 mph at 914 AM |
| Pompano Beach* |
83 mph at 840 AM |
98 mph at 818 and 837 AM |
| Naples* |
61 mph at 807 AM |
82 mph at 802 AM |
| Opa Locka* |
85 mph at 816 AM |
105 mph at 813 AM |
| Tamiami* |
58 mph at 733 AM |
83 mph at 738 AM |
Fowey Rocks**
(8 miles SE of Key Biscayne) |
85 mph at 752 AM |
123 mph at 843 AM |
WFO Miami (FIU Campus)
(See Figure 6; add 4 knots
for pin drag) |
66 mph 746 AM |
104 mph at 747 AM |
L006***
(South end of
Lake Okeechobee) |
103 mph at 1030 AM |
112 mph at 11 AM |
* Records are incomplete due to instrument failure.
** This measurement is taken at 145 feet while the traditional
representative measurement of a surface wind is taken at 30 feet from
the ground.
*** Data from the South Florida Water Management District.
Figure 7 shows that the lowest pressure recorded at NWS Miami while the storm center passed to the north was around 966 mb.
Wilma moved rapidly northeast across the state, with an average forward speed of 25 mph. Wilma exited the east
coast over northeastern Palm Beach County near Palm Beach Gardens around 11 AM Monday October 24th as a Category
2 hurricane with maximum sustained winds of around 105 mph. It traversed the southern peninsula in about 4 hours.
Rainfall amounts across South Florida generally
ranged from 2 to 4 inches across southern sections of the peninsula to 4 to 6
inches across western Collier county and around Lake Okeechobee, with isolated amounts of up to 6 to 8
inches observed (see Figure 8).
The maximum storm surge across the area was mostly south of Chokoloskee
in Mainland Monroe county where a storm surge of 13 to 18 feet was
forecast. Figure 9
illustrates a simulation of the storm surge for hurricane Wilma.
Chokoloskee experienced a storm surge of around 7 feet, which
caused extensive flooding. A storm surge of around 7 feet was
estimated in Marco Island, with 4 feet in Everglades City. The
southeast coast didn't escape the effects of the storm surge, with the
tide gauge in Virginia Key reported a maximum surge of around 4 feet.
Minor surge flooding was noted in Coconut Grove, Downtown Miami, and
Northeast Miami.
Damage was widespread, with large trees and power lines
down virtually everywhere, causing over 3 million customers to lose
power. Structural damage was heaviest in Broward and Palm Beach
counties where roof damage and downed or split power poles were noted in some
areas. High-rise buildings suffered considerable damage,
mainly in the form of broken windows. This was observed mainly along
the southeast metro areas, but also in Naples, which underscores the higher
wind speeds with height commonly observed in hurricanes.
One confirmed tornado was observed in rural Collier County
around 2:30 AM on the 24th, moving rapidly northwest from the
intersection of U.S. 41 and State Road 29 to the town of Copeland three
miles to the north. An F1 intensity was assigned to the tornado as it
caused snapped power poles, uprooted large trees, and significantly
damaged mobile homes. Small swaths of greater damage elsewhere in
South Florida have not been attributed to tornadoes, but were instead likely
caused by "mini-swirls", small vortices within the eye wall that have been
observed in previous strong hurricanes such as Hurricane Andrew in 1992.
For additional information on storm reports see the Local Storm Reports in the Text/Graphical Products
issued by NWS WFO Miami link at the bottom of this page.
Additional Information
 Preliminary Storm
Report issued by NWS WFO Miami Preliminary Storm
Report issued by NWS WFO Miami
Text/Graphical Products
issued by NWS WFO Miami
NOAA Survey Images
All data in this report is
preliminary and will be subject to revision and updated over next
several days. Last updated on 10/30/2005. |
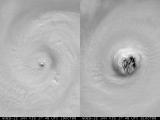
Figure 1. Visible
satellite pictures of Wilma shortly after its most intense
point (left) from October 19, 2005 at 1:45 PM EDT (1745 UTC)
and when approaching the Yucatan on October 21 at 1:45 PM EDT (1745
UTC) . View animation of
Wilma while at its most intense point. Courtesy of
the Univ. of
Wisconsin.
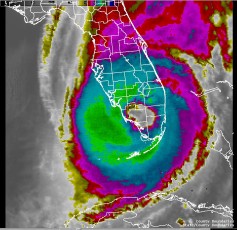
Figure 2.
Infrared satellite image of Hurricane Wilma crossing the South Florida
coast from October 24 at 7:32 AM EDT (1132 UTC).
Figure 3.
Radar reflectivity loop while Wilma was crossing South
Florida
from October 24 at 6:00 AM EDT (1000 UTC) to 9:00 AM EDT (1300 UTC). View
Large High Res animation (caution 15MB file) or Low
Res Animation (7MB file).
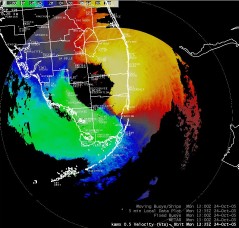
Figure 4.
Radar velocity while Wilma was crossing South Florida
from October 24 at 8:35 AM EDT (1235 UTC). View
Large High Res animation (caution 6MB file) or Low
Res Animation (4MB file).
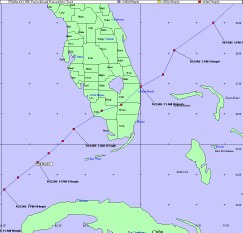
Figure 5.
Preliminary track showing the center of Hurricane Wilma as it moved
across South Florida.
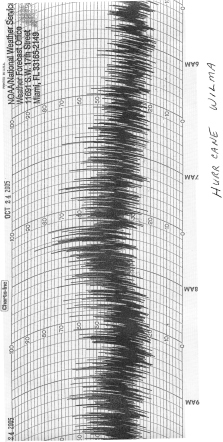
Figure 6.
Wind gust recorder trace from WFO Miami showing peak wind during
Hurricane Wilma (add 4 kt due to pen drag).
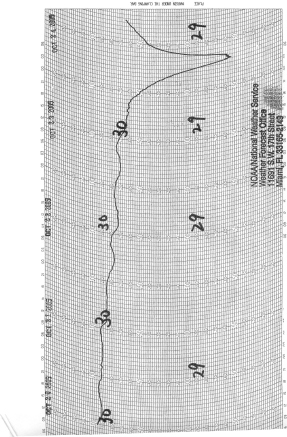
Figure 7.
Barograph trace from the NWS Miami Forecast Office, showing lowest
pressure of 966 mb.
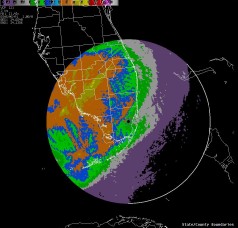
Figure 8.
NWS Miami radar (KAMX) storm total precipitation estimate from 10:40 PM
EDT Sun October 23 to 10 AM EDT Mon October 24.
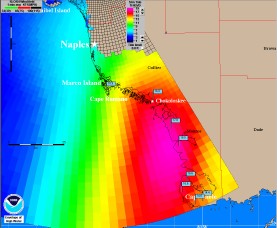
Figure 9.
NHC/TPC storm surge simulation for Wilma across portions of South
Florida in feet. Notice highest surge south of Chokoloskee to Cape Sable
Area.
|
|
|
 National Weather Service Forecast Office


