
- NASA Home
- | Missions
- | Hurricanes
- | Archives
- | 2008
Featured Images
Hurricane Season 2008: Hurricane Ike (Atlantic Ocean)
Ike's Remnants Moving Through Northeast Canada
 Credit: NASA/JPL
> Larger image On Monday, Sept. 15, the remnants of once Hurricane Ike are zipping through northeast Canada. The winds he left in his wake, however, were still being felt in extreme northern Maine during the morning hours of the 15th.
At 3:26 a.m. EDT, on Sept. 15, the National Weather Service of Caribou, Maine noted that gusty winds were possible in the morning hours. "The remnants of Ike will move just northwest of the state this morning producing gusty south winds across the advisory area. As the low pressure moves north of the state this afternoon winds will shift to the northwest." The wind advisory expired at noon, Eastern Time.
Meanwhile, the remnant rains from Ike can be seen on the radar from Environment Canada's Canadian Weather Service. At 10:30 a.m. EDT, the rains were in the northeastern part of the Quebec Province. For live Canadian Radar, visit: http://www.weatheroffice.gc.ca/radar/index_e.html?id=que
A Cool Look at Remnant Ike's Clouds
NASA's Aqua satellite captured these infrared and visible images of Ike using data from Aqua's Atmospheric Infrared Sounder (AIRS), an instrument that flies aboard the satellite. The image was created on Sept. 14 at 18:29 UTC (2:29 p.m. EDT) when Ike's remnants were over the eastern Great Lakes region. The AIRS data creates an accurate 3-D map of atmospheric temperature, water vapor and clouds, all of which are helpful to forecasters.
The AIRS images show the temperature of the cloud tops or the surface of the Earth in cloud-free regions. The coldest cloud top temperatures appear in purple, indicating towering cold clouds and heavy precipitation.
The infrared signal of the AIRS instrument does not penetrate through clouds. Where there are no clouds the AIRS instrument reads the infrared signal from the surface of the ocean waters, revealing warmer temperatures in orange and red.
The Last U.S. Advisory on Ike's Remnants
The last advisory on Ike's remnants was officially issued on Sunday, Sept. 14 at 11:00 p.m. EDT by the National Weather Service's Hydrometeorological Prediction Center in Camp Springs, Md. At that time, the low pressure area formally known as Ike was located 70 miles northwest of Toronto, Canada near 44.8 north and 79.1 west. Ike's low was speeding northeast near 50 mph. The low is racing along a frontal boundary that stretched across southern Ontario and Quebec into Labrador.
Ike's sustained winds were near 30 mph, and minimum central pressure was 986 millibars on Sept. 14.
The National Weather Service's Hydrometeorological Prediction Center issued the following high wind observations and rainfall totals generated from Hurricane Ike, on Sept. 14, in their final advisory.
Selected High Wind Reports Since 8 a.m. ET, Sept. 14
LOUISVILLE KY 75 MPH
COVINGTON KY 74 MPH
HUNTINGBURG IN 67 MPH
FORT KNOX KY 64 MPH
OWENSBORO KY 63 MPH
WALNUT RIDGE AR 62 MPH
POPULAR BLUFF MO 61 MPH
CINCINNATI/LUNKIN 61 MPH
Selected Storm Total Rainfall Amounts (in Inches) Through 11 p.m. ET, Sept. 14
LOUISIANA
CALCASIEU RIVER NEAR GLENMORA 7.62
DENHAM SPRINGS 6.8N 5.78
AMITE RIVER AT GRANGEVILLE 4.98
OUISKA CHITTO CREEK NEAR OBERLIN 4.54
BAYOU COCODRIE NEAR CLEARWATER 4.27
NATCHITOCHES 3.69
GRAND ENCORE 3.77
JONESBORO 3.45
WEST MONROE 4.1 NW 4.42
CLEARWATER 2.91
TEXAS
HOUSTON 15.75
SPRING BRANCH (HARRIS COUNTY) 15.20
CYPRESS CREEK (HARRIS COUNTY) 14.21
HALLS BAYOU (HARRIS COUNTY) 13.94
CONROE 4S 13.55
PANTHER BRIDE NEAR SPRING 13.14
WESTFIELD 6W 12.72
NECHES RIVER AT EVADALE 12.53
EVADALE 12.32
COLE CREEK AT DEIHL ROAD 11.03
HOUSTON - C.R. RD BHG 10.95
HARRIS GULLEY (HARRIS COUNTY) 10.71
GOOSE CREEK (HARRIS COUNTY) 10.39
HUMBLE 2N 10.39
BUFFALO BAYOU (HARRIS COUNTY) 10.12
CLEVELAND (SITE 2) 10.01
MOUNT CALM 4E 9.84
HOUSTON 9.49
BUNKER HILL 1SW 9.46
ADDICKS - SO. MAYDE CK 9.22
HOUSTON - COLE CK DEIHL RD 9.21
SPRING 3NW 9.20
HOUSTON - BRAYS BAYOU S MAIN ST 9.14
HOUSTON 9.02
HOUSTON-LANGHAM CK@LITTLE YORK R 8.89
JERSEY VILLAGE 8.74
PASADENA 1NE 8.35
ARKANSAS
BIG FORK 2ENE 5.09
EUREKA SPRINGS 4.51
ATHENS 4.51
BERRYVILLE 5NW 4.07
WINSLOW 10WSW 3.97
WINFREY 3.82
BEAVER DAM-WHITE RIVER 3.76
DEER 3.73
MISSOURI
CLINTON 0.9 NNW 8.93
KIRKSVILLE 8.14
CLINTON 7.56
COLOMA 7.56
HOUSTON 4.5 WSW 7.41
COLUMBIA 3.6SW 7.19
NEVADA 2.3 WNW 7.11
DOWNING 6.93
KANSAS
MAIZE 5.7S 11.44
UDALL 4.2 ENE 11.02
PLYMOUTH 1SW 10.26
LEON 7.5 SW 10.01
WICHITA MID CONTINENT AIRPT 9.56
PARK CITY 3.0 WSW 9.18
EMPORIA 5.5 NNE 9.08
EL DORADO 7.9 NNW 8.90
SMILEYBERG 8.88
ROSE HILL 2.7 ESE 8.39
EL DORADO (CITY WATER PLANT) 7.79
NEOSHO RAPIDS 7.59
AUGUSTA 7.42
MADISON 6.80
OKLAHOMA (HIGHER TOTALS OVER 5 IN INCLUDE PRE-IKE RAINFALL)
FAIRVIEW 11.83
ORIENTA 1 SSW 10.45
HELENA 1 SSE 9.95
MUTUAL 8.76
GREAT SALT PLAINS LAKE 8.58
WAYNOKA 5 S 6.25
CHEROKEE 5.83
SAYRE 5.8 NW 4.66
TALIHINA 3ENE 4.30
ELDON 4.05
WINSLOW 7NE 4.01
MIAMI 4.00
COLCORD 4N 3.97
HINDSVILLE 3.85
DEVILS DEN STATE PARK 3.85
Additionally, a front in the Midwest combined with moisture from former east pacific Tropical Depression Lowell to produce heavy rains Friday into Saturday. The rainfall was later added to by the remains of Ike on Sunday. Here are the multi-day and multi-event totals through Sunday 7 pm CDT (September 12-14).
IOWA
OAKLAND MILLS 3W 7.60
DONNELSON 7.07
MOUNT PLEASANT 7.04
BURLINGTON 6.5N 6.97
LONDON 1.5 SW 6.96
WAPELLO 6.71
KEOSAUQUA 6.06
FORT MADISON 5.54
LE CLAIRE 0.2 ESE 5.35
DAVENPORT 0.9 SSW 5.12
BEDFORD 1 NNW 5.11
ILLINOIS
PEOTONE 10.40
WHEATON 1.7N 9.36
ELBURN 0.4 NW 9.29
PARK RIDGE 9.15
ST CHARLES 9.03
PARK FOREST 0.8 NNE 8.80
EVANSTON 1.4N 8.76
ELK GROVE 8.74
BARTLETT 8.58
ST CHARLES 7NW 8.48
PAW PAW 8.38
DES PLAINES 0.5 NW 8.18
KEITHSBURG 7.98
BRADLEY 7.90
WEST CHICAGO 2.7N 7.89
MILL CREEK NEAR BATAVIA 7.72
KEWANEE 1E 7.59
CARBON HILL 3N 7.45
ROGERS PARK 7.37
CHICAGO O'HARE AIRPORT 7.25
INDIANA
PORTAGE 0.8 SW 11.46
SOUTH BEND 3.7 SE 10.94
CROWN POINT 3.1 WSW 10.83
VALPARAISO 1.3 SSW 9.78
HART DITCH AT DYER 8.33
LA PORTE 1.2 7.97
PORTER 0.8 E 7.84
SOUTH BEND 7.72
LOWELL 4.48
GARY 3.64
MICHIGAN
SOUTH HAVEN 6.68
MARSHALL 6.32
BATTLE CREEK/W K KELLOGG AIRPORT 6.16
BLOOMINGDALE 5.92
BENTON HARBOR/SW MI RGNL APT 5.77
FARMINGTON HILLS 5.36
OKEMOS 5.22
KALAMAZOO INTL ARPT 4.57
JACKSON/REYNOLDS FIELD 4.47
OHIO
MILL CREEK AT TYLERSVL RD FAIRFLD 7.08
NORWALK 2NW 4.51
LAGRANGE 1NE 4.39
WADSWORTH 1SW 3.79
FINDLAY AIRPORT 3.17
MEDINA 3.12
AKRON/FULTON INTL ARPT 2.97
PENNSYLVANIA
MURRYSVILLE 5.41
NEW KENSINGTON (IFLOWS) 4.17
ALLISON PARK 3ESE (IFLOWS) 3.79
ACMETONIA (LOCK 3) 2.92
SLIPPERY ROCK 1SSW 2.90
CONEMAUGH DAM 2.85
WISCONSIN
GENOA CITY 3.25
FRANKLINSVILLE 2.50
NWS SULLIVAN 2.37
HALES CORNERS 2.32
TWIN LAKES 2.18
NEBRASKA
FALLS CITY 3.31
RULO 2W 3.00
SYRACUSE 2.92
LINCOLN 3S 2.28
PAWNEE CITY 2.24
OMAHA - 125TH & FORT STS 2.14
Text credit: Rob Gutro (from National Hydrometeorological Center reports), NASA's Goddard Space Flight Center
Sept. 14, 2008
Tropical Depression Ike Speeding Toward Mississippi Valley on Sunday
The once powerful Hurricane Ike that flooded and damaged the Texas coast has been downgraded to a tropical depression as it speeds northeast through the interior U.S. today, Sunday, Sept. 14. Ike will be passing through the middle Mississippi Valley today and will arrive in the eastern Great Lakes states by Sept. 15.
 Hurricane Ike's track over the last couple of days. Click on image to view video. Credit: NASA/NOAA GOES Project
This movie of Hurricane Ike's track over the last couple of days was created using satellite imagery from Sept.12-14 from the Geostationary Operational Environmental Satellite (GOES-12), which is operated by the National Oceanic and Atmospheric Administration. It was created by NASA's GOES Project, located at NASA's Goddard Space Flight Center, Greenbelt, Md.
Hurricane Ike's track over the last couple of days. Click on image to view video. Credit: NASA/NOAA GOES Project
This movie of Hurricane Ike's track over the last couple of days was created using satellite imagery from Sept.12-14 from the Geostationary Operational Environmental Satellite (GOES-12), which is operated by the National Oceanic and Atmospheric Administration. It was created by NASA's GOES Project, located at NASA's Goddard Space Flight Center, Greenbelt, Md.The movie shows Hurricane Ike in the Gulf of Mexico on Sept. 12, then making landfall in Galveston, Texas on Sept. 13, and moving through Arkansas on Sept. 14.
Where is Ike on Sept. 14?
At 5:00 a.m. EDT on Sunday, Sept. 14, Ike was packing sustained winds near 35 mph with higher gusts. Ike's center was located near 36.4 degrees north latitude and 92.5 degrees west longitude. That puts the center near Bull Shoals, Arkansas. It's also about 75 miles southeast of Springfield, Missouri and 115 miles north of Little Rock, Arkansas.
Now that Ike is inland, as with most tropical cyclones, he's speeding up and moving northeast near 30 mph. Ike's minimum central pressure is 986 millibars.
What Weather Can the Mississippi, Ohio and Tennessee Valleys Expect?
According to the National Hurricane Center, the Mid-Mississippi Valley states will get a good soaking from Ike, with the possibility of isolated tornadoes. Missouri, Illinois, northern Indiana, and southern lower Michigan can see between 3 and 5 inches of rain through tonight, Sept. 14.
Isolated tornadoes are possible today from southeastern Missouri and the Tennessee valley northeastward through the Ohio valley.
What's Next for Ike?
Either later today or on Monday, Tropical Depression Ike will lose its tropical characteristic as it merges with a cold front. Once merged, the bigger system with the additional energy can strengthen into a non-tropical low pressure system later tonight or Monday. That means winds along with that system will be sustained near 30-35 mph with higher gusts as it moves toward toward the U.S. east coast.
Rob Gutro
Goddard Space Flight Center
Three satellite images TS Ike at approximately 1:30 PM local standard time on 9/13/08
+ Image 1 Full Resolution
+ Image 2 Full Resolution
+ Image 3 Full Resolution
 Hurricane Ike Image 1. Click on image for full resolution. Image credit: NASA/JPL
NASA's Aqua satellite captured these infrared microwave and false-color visible images of Hurricane Ike using data from Aqua's Atmospheric Infrared Sounder (AIRS), an instrument that flies aboard the satellite. The images were created on Sept. 11 at 19:23 UTC (3:23 p.m. EDT). The AIRS data creates an accurate 3-D map of atmospheric temperature, water vapor and clouds, all of which are helpful to forecasters.
Hurricane Ike Image 1. Click on image for full resolution. Image credit: NASA/JPL
NASA's Aqua satellite captured these infrared microwave and false-color visible images of Hurricane Ike using data from Aqua's Atmospheric Infrared Sounder (AIRS), an instrument that flies aboard the satellite. The images were created on Sept. 11 at 19:23 UTC (3:23 p.m. EDT). The AIRS data creates an accurate 3-D map of atmospheric temperature, water vapor and clouds, all of which are helpful to forecasters.The AIRS infrared images show the temperature of the cloud tops or the surface of the Earth in cloud-free regions. The coldest cloud top temperatures appear in purple, indicating towering cold clouds and heavy precipitation.
The infrared signal of the AIRS instrument does not penetrate through clouds. Where there are no clouds the AIRS instrument reads the infrared signal from the surface of the ocean waters, revealing warmer temperatures in orange and red.
The microwave images show the temperature of the cloud tops where heavy precipitation is occurring, and deeper into the atmosphere, all the way to the warmer surface in other areas.
Now a Tropical Storm, Ike Was Over Northeastern Texas Headed North
By the evening hours of Sept. 13, Hurricane Ike had smashed into the Texas coast and was over northeastern Texas dumping heavy rains, with the threat of isolated tornadoes.
Ike is expected to produce additional rainfall amounts of 2 to 5 inches over portions of eastern Texas and western Louisiana, which will bring storm total amounts of 15 inches. Rainfall amounts of 3 to 6 inches with maximum amounts of 8 inches are possible across southeastern Oklahoma, western Arkansas, southern and eastern Missouri, Illinois, northern Indiana, and southern lower Michigan through Sunday. A threat for tornadoes exists through tonight over portions of Northeastern Texas, northern Louisiana much of Arkansas and Southern Missouri.
By 5:00 p.m. EDT, Sept. 13, Hurricane Ike's powerful winds had decreased to 45 mph and as drenching northeastern Texas, headed into Arkansas. The center was located near latitude 32.4 north and longitude 95.3 west, about 50 miles south-southwest of Mount Pleasant, Texas, and 170 miles southwest of Texarkana, Arkansas. Ike is speeding north near 18 mph, and will turn north-northeast and speed up more late today or Sunday. Estimated minimum central pressure was 980 millibars.
Damage Reports Trickling In
Downtown Houston is closed for damage clean up, Ike's powerful winds smashed windows in skyscrapers, and left millions of people in the dark. Thousands of homes were flooded from Ike's powerful storm surge.
According to CNN, the Galveston City Manager, Steve LeBlanc, noted that Galveston Island would be closed so teams can assess damages. The causeway was reported in "bad shape" because of debris and road damage.
Meanwhile, Louisiana fared poorly as well. Ike’s storm surge flooded thousands of homes and businesses. A spokesman for the Sheriff of Plaquemines Parish, which is located near New Orleans, told CNN that "levees were overtopped and floodwaters were higher than either hurricane Katrina or Rita."
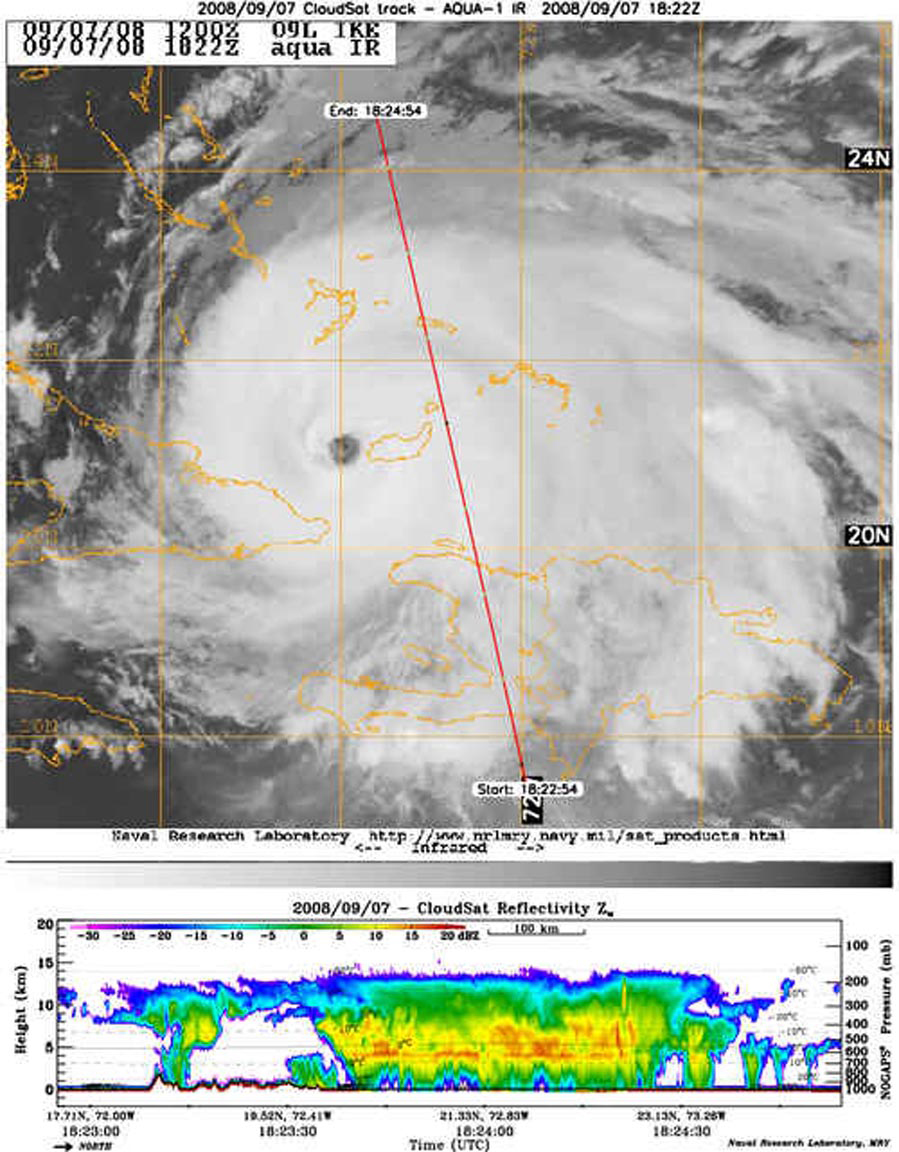
CloudSat Scans Hurricane Ike Right After Landfall
NASA's CloudSat satellite's Cloud Profiling Radar captured a sideways look across Ike on Sept. 13 at 6:58 UTC (2:58 a.m. EDT), about 48 minutes after his eye made landfall in Galveston, Texas.
CloudSat didn't directly pass over the eye, but over the left side of the storm. The image shows that the section of the storm that CloudSat crossed over (the brightly colored red, yellow, blue and green clouds) is about 400km (250 miles) wide.
 Hurricane Ike. Click on thumbnail for full image. Photo Credit: NASA/JPL/Colorado State University/Naval Research Laboratory-Monterey
In that section, the clouds extended from the surface to almost 20 km (~12 miles) high in the
atmosphere, and these clouds were raining heavily everywhere, as shown by the surface signal that disappears (the bright white stripe at the bottom of the clouds). At the time of this overpass, the storm had just crossed from the ocean over to the land. This is shown by the blue line on the left changing into the brown line on the right just below the image.
Hurricane Ike. Click on thumbnail for full image. Photo Credit: NASA/JPL/Colorado State University/Naval Research Laboratory-Monterey
In that section, the clouds extended from the surface to almost 20 km (~12 miles) high in the
atmosphere, and these clouds were raining heavily everywhere, as shown by the surface signal that disappears (the bright white stripe at the bottom of the clouds). At the time of this overpass, the storm had just crossed from the ocean over to the land. This is shown by the blue line on the left changing into the brown line on the right just below the image.The blue areas along the top of the clouds indicate cloud ice, while the wavy blue lines on the bottom center of the image indicate intense rainfall. Notice that the solid line along the bottom of the panel, which is the ground, disappears in this area of intense precipitation. It is likely that in the area the precipitation rate exceeds 30mm/hr (1.18 inches/hour) based on previous studies.
See Live Radar from Little Rock, Arkansas, as Ike heads in that direction

Hurricane Ike. Image credit: NASA/JPL Ike Roared Ashore in Texas
Hurricane Ike is seen in infrared by NASA's Aqua spacecraft about an hour after making landfall Sept. 13 in Galveston, Texas.
Full resolution of image
Powerful Ike Slams Texas at 2 a.m. CDT on Verge of Category 3
Hurricane Ike came ashore in Texas at 2:10 a.m. CDT, Sept. 13, when forecasters expected it to, and brought a wall of water over 20 feet high, sweeping through Galveston Island, and on the mainland. Ike made landfall with sustained winds near 110 mph, just 1 mph short of a Category 3 hurricane.
 The image above from the National Hurricane Center depicts the area where hurricane force winds are experienced. Click on image to view high resolution. Credit: NOAA
Galveston took a direct hit, and the storm surge flooded much of the island. CBS radio reports spoke to a Galveston resident who didn't evacuate until Ike hit, and tried getting out of his house with his young daughter. He reported that water rose from his ankles to his next very quickly, and was one of the lucky ones to make it to safety. He noted that other neighbors were trapped in their homes.
According to the Galveston County Office of Emergency Management's website, "Much of the Galveston Island is currently flooded, and there are several fires in that area. Many roads in the county are impassable [due] to rising water and debris. The Governor has declared a disaster due to Hurricane Ike."
Much of the Galveston Island is currently flooded, and there are several fires in that area," the Galveston County Office of Emergency Management said on its Web site. "Many roads in the county are impassable [due] to rising water and debris."
CNN reports at 7:00 a.m. EDT that more than 4 million were without power in the coastal Texas area. At that time, Ike's eye was beginning to move away from the Houston area. Ike was centered 15 miles east-northeast of Houston International Airport, near 30.1 north and 95.1 west. Ike had maximum sustained winds near 100 mph, and he was moving 15 mph near the north-northwest. The estimated minimum central pressure is 956 millibars.
The National Hurricane Center reported "Ike should weaken as the center moves farther inland...with the cyclone forecast to drop below hurricane strength by late Saturday afternoon and below tropical storm strength on Sunday. Ike is expected to lose tropical characteristics by 48 hr and be absorbed into a frontal zone thereafter."
Ike is expected to produce rainfall amounts of 5 to 10 inches over Eastern Texas and extreme southwestern Louisiana...with isolated amounts of 15 inches possible.
Isolated tornadoes are possible today over portions of eastern and southeastern Texas...and southern and western Louisiana. Isolated tornadoes are possible tonight over portions of western Louisiana...much of Arkansas...and southern Missouri.
Rob Gutro
Goddard Space Flight Center
Latest Visualization of Ike from September 12, 2008
 Credit: NASA/Goddard Space Flight Center Scientific Visualization Studio
> Watch 512x288 animation
> Watch 1280x720 animation
Sept. 12, 2008
NASA's Aqua Satellite Sees Monster Hurricane Ike Fill Gulf of Mexico
At 4 p.m. EDT on Friday, Sept. 12, the Texas coast was experiencing high seas and gusty winds from Hurricane Ike as he lumbered to landfall.
 > Full resolution
Hurricane Ike. Image credit: NASA/JPL Hurricane Ike is a monster-sized storm and tropical storm force winds extend more than 500 miles from end to end. In this image from NASA's Aqua satellite, Hurricane Ike's clouds (depicted in blue and purple) fill up the entire Gulf of Mexico.
At 2:00 p.m. EDT (1:00 p.m. CDT) Ike was packing sustained winds near 105 mph, and is a Category 2 hurricane. Ike could strengthen into a Category 3 hurricane before his eye reaches the coast. Galveston Island at 4 p.m. EDT was already reporting flooding.
Ike was located about 165 miles southeast of Galveston, Texas and about 270 miles east of Corpus Christi, Texas near latitude 27.4 north and longitude 93.1 west. Ike is moving toward the west-northwest near 12 mph and a turn toward the northwest is expected later today. Estimated minimum central pressure from a reconnaissance aircraft is 957 millibars.
Galveston, Texas is the site of the greatest loss of life during a hurricane in the history of the United States, when the "Great 1900 Galveston Hurricane" took more than 6,000 lives, so residents are not taking this threat lightly.

> Larger image
Credit: NASA/Hal Pierce Ike's Intense Rainfall Concentrated Around Eye
The Tropical Rainfall Measuring Mission (TRMM) satellite passed over enormous Hurricane Ike that filled much of the Gulf of Mexico on the morning of September 12 at 1033 UTC (5:33 a.m. CDT). The TRMM Precipitation Radar (PR) and TRMM Microwave Imager (TMI) instruments made it clear by peering through the cloud canopy that hurricane Ike had a large eye and a very large area of intense rainfall mostly concentrated in the southeastern part of the storm. Bands of rainfall in this area were shown by the TRMM satellite to exceed 50 millimeters (~2 inches) per hour.
See Ike's Live Rainfall from the National Weather Service at the Texas Coast:
> NWS radar
QuikSCAT Watching Ike's Strengthening Winds

> Larger image
Credit: NASA NASA's Quick Scatterometer satellite (QuikScat) has been watching Hurricane Ike's winds increase, by using microwaves to peer into the clouds. QuikScat can determine the speed of the rotating winds. This image from QuikScat shows Ike's wind speeds in different colors and wind direction are indicated by small barbs. White barbs point to areas of heavy rain. The highest wind speeds are shown in purple, indicating winds over 40 knots (46 mph) as represented in the center of circulation. This image was captured on Sept. 11 at 23:59 UTC (7:59 p.m. EDT).
The National Hurricane Center discussion notes "Reconnaissance aircraft and microwave data (such as provided by QuikScat) indicate that Ike has not developed a tight inner core as anticipated. Once again this reemphasizes the difficulties in forecasting changes in the inner core structure of a hurricane which leads to changes in intensity."
For most recent positions and information: > National Hurricane Center Text credit: Rob Gutro/NASA Goddard Space Flight Center
National Weather Service Warning on Ike: Leave or Perish
A warning from the National Weather Service is never to be taken lightly, and the residents along Galveston Bay in Texas heard a "leave or perish" warning as Hurricane Ike approaches the Texas coast. About 3.5 million people live in Ike's path.
The National Weather Service statement reads ""All neighborhoods ... and possibly entire coastal communities ... will be inundated during the peak storm tide," the weather service warned. Persons not heeding evacuation orders in single family one- or two-story homes will face certain death."
Why the evacuation? At 8:00 a.m. EDT, Hurricane Ike had maximum sustained winds near 105 mph, making him a Category Two storm on the Saffir-Simpson Scale. However, forecasters at the National Hurricane Center expect Ike to strengthen into a Category 3 storm before landfall, making it a Major Hurricane.
The National Hurricane Center is expecting a storm surge of near 20 feet high over the Galveston Bay coast, and it could push floodwaters all the way to Houston, some 20 miles inland.
 Credit: NASA JPL
> Larger image At 8 a.m. EDT (7 a.m. CDT) Ike's center was located near 365 miles of Corpus Christi, Texas and about 230 miles southeast of Galveston, Texas, near latitude 26.9 north and longitude 92.2 west. Ike is moving toward the west-northwest near 13 mph. A turn toward the northwest is expected later today with a turn toward the north expected on Saturday after landfall. The estimated minimum central pressure is 956 millibars.
How Huge is Hurricane Ike?
Although Ike's center will be near the upper Texas coast late today, Friday, Sept. 12, the weather will deteriorate long before the eye makes landfall because Ike is a huge hurricane with a big reach. Hurricane force winds extend 120 miles out from the center, so from one side to the other side they cover 240 miles!
Tropical storm force winds extend 275 miles outward from the center, if you double that from one side to the other, that's 550 miles! That's greater than the distance from Richmond, Virginia to Boston, Massachusetts (which is 539 miles).
 Credit: NASA JPL
> Larger image NASA Satellite Views Ike's Strength
NASA's Aqua satellite captured these infrared and visible images of Hurricane Ike using data from Aqua's Atmospheric Infrared Sounder (AIRS), an instrument that flies aboard the satellite. The images were created on Sept. 11 at 19:35 UTC (3:35 p.m. EDT). The AIRS data creates an accurate 3-D map of atmospheric temperature, water vapor and clouds, all of which are helpful to forecasters.
The images were created on Sept. 11 at 19:35 UTC (3:35 p.m. EDT). The AIRS data creates an accurate 3-D map of atmospheric temperature, water vapor and clouds, all of which are helpful to forecasters.
The AIRS images show the temperature of the cloud tops or the surface of the Earth in cloud-free regions. The coldest cloud top temperatures appear in purple, indicating towering cold clouds and heavy precipitation.
The infrared signal of the AIRS instrument does not penetrate through clouds. Where there are no clouds the AIRS instrument reads the infrared signal from the surface of the ocean waters, revealing warmer temperatures in orange and red.
Dangerous Storm Surges, Isolated Tornadoes, Heavy Rain
The National Hurricane Center issued the following forecast on Friday, Sept. 12 at 8:00 a.m. EDT: "Coastal storm surge flooding of up to 20 feet above normal tide levels...along with large and dangerous battering waves...can be expected near and to the east of where the center of Ike makes Landfall...extending a greater than usual distance from the center due to the large size of the cyclone. Surge flooding of up to 25 feet...and possibly higher...could occur at the heads of bays.
Coastal storm surge flooding of 6 to 8 feet above normal tide levels...along with large and dangerous waves...can be expected within the tropical storm warning area along the northern Gulf coast. Above normal tides in the eastern Gulf of Mexico should gradually subside over the next day or so.
Ike is expected to produce rainfall amounts of 5 to 10 inches over eastern Texas and extreme southwestern Louisiana...with isolated amounts of 15 inches possible. Isolated tornadoes are possible today over portions of southern Louisiana and extreme southern Mississippi. Isolated tornadoes are possible tonight over portions of southwestern Louisiana and Southeastern Texas."
Text credit: Rob Gutro, NASA's Goddard Space Flight Center
Sept. 11, 2008, second update
Ike Leaves Cuba and Enters the Gulf with an Eye on Texas
 Credit: Hal Pierce (SSAI/NASA GSFC)
> Larger image Although Ike is not technically a "major" hurricane, which is considered to be category 3 or higher, its effects, particularly on the upper Texas coast, could be tremendous. What Ike lacks in peak intensity, is more than made up for by its enormous size. Hurricane force winds extend up to 120 miles (195 km) from the center and tropical storm force winds up to 275 miles (445 km) from the center. Ike is nearly double the size of an average hurricane, and as a result, its vast wind field is capable of pushing a lot of water towards the coast, which could result in a large, dangerous storm surge. Storm surge can be very deadly. The greatest loss of life ever from a natural disaster in the US occurred in Galveston, Texas back in 1900 when a storm surge from a hurricane killed an estimated 8,000 to 12,000 people. Galveston is currently directly in the path of Ike whose surge, aided by the shallow slope of the underwater shelf of the Gulf, is forecast by the National Hurricane Center (NHC) to crest at up to 20 feet.
 Credit: Hal Pierce (SSAI/NASA GSFC)
> Larger image Back when it was in the Atlantic, Ike was a much different looking storm. Ike, which became a tropical storm in the central Atlantic back on the 2nd of September 2008, strengthened into a small but intense category 4 storm with maximum sustained winds of 125 knots (144 mph) as it was moving west-northwest through the central Atlantic about 520 miles (~840 km) northeast of the Leeward Isles. A strengthening ridge of high pressure in the western Atlantic north of Ike, steered the storm to the west-southwest through the southern Bahamas towards Cuba. The Tropical Rainfall Measuring Mission satellite (better known as TRMM) has been in service for over 10 years now and continues to provide valuable images and information on tropical cyclones around the Tropics using a combination of passive microwave and active radar sensors. TRMM has been monitoring Ike's progress since it formed in the Atlantic. This first image of Ike was obtained by TRMM at 18:34 UTC (2:34 pm EDT) on the 7th of September 2008 as the storm was bearing down on the northeast coast of Cuba. It shows the horizontal pattern of rain intensity within the storm. Rain rates in the center swath are based on the TRMM Precipitation Radar (PR), and those in the outer swath on the TRMM Microwave Imager (TMI). The rain rates are overlaid on infrared (IR) data from the TRMM Visible Infrared Scanner (VIRS). Ike is in the process of weakening slightly from a lower-end category 4 storm to a strong category 3 storm after having just passed over Great Inagua Island in the southern Bahamas. At the time of this image, Ike's maximum sustained winds were reported to be 115 knots (132 mph) by NHC. Ike has a well- defined eye bordered to its north by an eyewall composed of moderate to intense (green and red areas, respectively) rain (small green and red arc just north of the darker center). Overall, the storm is quite symmetric, which is consistent with having a strong, well- developed circulation that smooths out and elongates features in a circular fashion about the center. Surrounding the inner eyewall is a larger concentric ring containing a large area of intense rain (large dark red area). This outer ring is actually the beginning of an outer eyewall that is trying to form. It is fairly common for mature, intense tropical cyclones to undergo what is known as an "eyewall replacement cycle", wherein a newer, outer eyewall forms around the smaller, original, inner eyewall associated with the core of the storm. This outer eyewall chokes off the inner eyewall, which can temporarily weaken the storm's peak intensity. If the eyewall replacement cycle continues to completion, the outer eyewall contracts and becomes a new, inner eyewall, which can allow the storm to re-strengthen.
 Credit: Hal Pierce (SSAI/NASA GSFC)
> Larger image Ike was unable to complete its eyewall replacement cycle before it made landfall on the northeast coast of Cuba near Punto de Sama on the evening of the 7th as a category 3 storm with sustained winds estimated at 125 mph. This next image was taken at 11:02 UTC (7:02 am EDT) September 8th as Ike was tracking westward across central Cuba. Showing the effects of being over land, Ike now appears weaker. The eye is now gone, although there is still good banding (curvature) evident in the surrounding rainbands. Gone too is most of the intense rain; however, the well-defined banding visible in the rainbands well away from the center provides evidence that the size of the storm has increased. After crossing over the island, the center re-emerged over water south of Cuba early on the afternoon of the 8th (local time). Ike then took a more northerly track and began moving to the west-northwest, paralleling the southern coastline of Cuba. Around midday on the 9th while at category 1 intensity after having been weakened further by its close proximity to Cuba over the previous day, the center again made landfall in Cuba, this time in western Cuba, which was struck and devastated just 9 days earlier by a then powerful category 4 Hurricane Gustav. Ike is being blamed for 7 deaths in Cuba. Torrential rains from Ike added to the misery in Haiti were it was blamed for 71 more deaths in the flood-ravaged nation already hit hard by earlier storms.
 Credit: Hal Pierce (SSAI/NASA GSFC)
> Larger image After crossing western Cuba, Ike emerged over open waters again, this time in the southeastern Gulf of Mexico. TRMM captured this next image of Ike at 10:48 UTC (6:48 am EDT) September 10th as Ike was heading northwest out into the central Gulf of Mexico. Although still just a category 1 hurricane at the time with sustained winds of 75 knots (86 mph), Ike was in the process of tapping into the warm waters of the Gulf as was manifest by its falling central pressure. Similar in appearance to when it was approaching Cuba in the first image, Ike's structure shows a smaller inner eye-wall separated from the surrounding rainbands. The storm is now larger, however, and not nearly as symmetric with most of the rain shield east of the center (large area of blue, green, and embedded reds indicating light to moderate and heavy rain, respectively). Ike's central pressure continued to fall throughout the rest of the day, and the storm was upgraded to category 2 intensity that afternoon with sustained winds reported at 85 knots (98 mph) by NHC. Ike's peak winds, however, remained anomalously low given its relatively deep central pressure. This was due to its large size, which spread the pressure gradient (which is proportional to the wind speed) over a broader area and results in lower peak winds but stronger winds spread over a larger area.
Over the next two days, with a ridge of high pressure to its north, Ike continued to head northwestward through the central Gulf of Mexico. Ike continued to maintain a steady category 2 peak wind intensity, despite having a central pressure consistent with that of a strong category 3 hurricane, as it began to take aim at the northern Texas coastline. A similar situation occurred with Hurricane Katrina, which made landfall as a category 3 storm despite having a borderline category 5 central pressure. TRMM obtained this last image of Ike at 10:33 UTC (5:33 am CDT) September 12th as Ike was passing south of Louisiana in the general direction of Galveston Bay. TRMM reveals that Ike no longer has a small inner eye but a single larger eye instead (note the rather large white circular area in the center of the storm devoid of rain). This feature is often found with older cyclones. The storm remains somewhat asymmetric similar to the 3rd image when it entered the Gulf with most of the rain east of the center. A large area of intense rain is now located southeast of the center (dark red area).
Ike is expected to make landfall on the night of September 12th near Galveston, Texas as a strong category 2 or possibly a minimal category 3 storm. Its effects, however, are being felt throughout the Gulf Coast states. Water levels have already risen 9 feet above normal along some sections of the northwestern Gulf Coast in advance of the storm. Above normal tides are expected to reach all the way back into Alabama. After making landfall, Ike is expected to weaken and turn northward ahead of an advancing upper-level trough before eventually recurving northeastward into the central or southern Mississippi Valley.
TRMM is a joint mission between NASA and the Japanese space agency JAXA.
Text credit: Steve Lang, SSAI/NASA's Goddard Space Flight Center
Sept. 11, 2008, first update
 > Full resolution
Image credit: NASA/JPL Ike Advances on the Gulf Coast
A very large and growing Hurricane Ike steams toward the Texas coast in this Sept. 11 afternoon infrared image from NASA's Aqua spacecraft.
Hurricane Ike Larger, Eyeing Landfall Early Saturday in Texas
 > Larger image
Credit: Hal Pierce, SSAI/NASA Hurricane Ike hasn't been strengthening yet as of Thursday morning, Sept. 11, but he is getting larger. Ike is a very large tropical cyclone with hurricane force winds as far out as 115 miles from Ike's center and tropical storm force winds outward to 275 miles!
As of 10:00 a.m., Sept. 11, hurricane warnings are up from Morgan City Louisiana to Baffin Bay, Texas. Hurricane conditions could reach the coast within the warning area by late Friday, Sept. 12. At that time, Ike's center was located near 25.5 north and longitude 88.4 west, or 580 miles east-southeast of Corpus Christi, Texas. That's also about 470 miles east-southeast of Galveston, Texas.
Ike is a Category 2 hurricane with maximum sustained winds near 100 mph. He is forecast to strengthen to a Category 3 storm before reaching the Texas coastline. Ike is moving west-northwest near 10 mph and will be near the coast late on Sept. 12, however, because Ike is large, tropical storm force winds will be felt far in advance. The minimum central pressure is 945 millibars.
 > Click to view animation
Credit: NASA/Goddard Scientific Visualization Studio TRMM spacecraft observed this view of Hurricane Ike on September 10, 2008 at 1745 UTC. The storm was a category 2 hurricane with sustained winds of 85 knots (97.75 mph) and a pressure reading of 958 millibars. At this time, the storm has two nearby well-defined wind maxima of roughly equal strength. There is a 17 km tower in the ou ter eye.
NASA's TRMM Satellite Analyzes Rainfall from Space
The image above was made from data captured by the Tropical Rainfall Measuring Mission (TRMM) satellite on Sept. 10 at 10:48 UTC (6:48 a.m. EDT), after Hurricane Ike entered the warm waters of the Gulf of Mexico. This TRMM image shows the horizontal pattern of rain intensity within Ike. The center is located near the yellow, green and red areas, which indicate rainfall between 20 and 40 millimeters (.78 to 1.57 inches) per hour. The red area is considered moderate rainfall.
For more information about how TRMM looks at rainfall, visit NASA's TRMM website at: http://trmm.gsfc.nasa.gov/. TRMM is a joint mission between NASA and the Japanese space agency JAXA.
Ike's Rainfall and Storm Surges Expected
 > Click to view animation
Credit: NASA/Goddard Scientific Visualization Studio NASA's TRMM spacecraft observed this view of Hurricane Ike on September 10, 2008 as slammed into Cuba. The storm was a category 1 hurricane with sustained winds of 75 knots (86.25 mph) and a pressure reading of 963 millibars. TRMM's data and aircraft reports confirm the small inner eye is eroding as the outer bands, shown here as red towers, are becoming better defined. This could limit rapid intensity development in the very near term, but the storm is projected to strengthen before it makes landfall. The cloud cover in this animation is taken by TRMM's Visible and Infrared Scanner (VIRS) and the GOES spacecraft. The rain structure is taken by TRMM's Tropical Microwave Imager (TMI) and TRMM's Precipitation Radar (PR) instruments. TRMM looks underneath of the storm's clouds to reveal the underlying rain structure. The colored isosurface under the clouds show the rain seen by the PR instrument. This surface is colored according to cloud height where yellow represents 10 km thunderclouds and red represents 12 km more intense thunderclouds.
The National Hurricane Center noted, "Ike is expected to produce rainfall amounts of 5 to 10 inches along the central and upper Texas coast and over portions of southwestern Louisiana with isolated maximum amounts of 15 inches possible. Rainfall amounts of 1 to 2 inches are possible as far south as over portions of the Yucatan peninsula."
Coastal storm surge flooding of up to 20 feet above normal tide levels along with large and dangerous battering waves can be expected near and to the east of where the center of Ike makes landfall. Coastal storm surge flooding of 5 to 7 feet above normal tide levels along with large and dangerous waves can be expected within the tropical storm warning area along the northern Gulf coast. Above normal tides in the eastern Gulf of Mexico should gradually subside over the next day or so.
NASA's Aqua Satellite Shows Ike's Cloud Temperatures

> Larger image
Credit: NASA/JPL This infrared image of Hurricane Ike was created by data from the Atmospheric Infrared Sounder (AIRS), an instrument that flies aboard NASA's Aqua satellite. The image was created on Sept. 10 at 18:47 UTC (2:47 p.m. EDT).
The AIRS image shows the temperature of the cloud tops or the surface of the Earth in cloud-free regions. The lowest temperatures (in purple) are associated with high, cold clouds that make up Ike's cloud tops. The AIRS data creates an accurate 3-D map of atmospheric temperature, water vapor and clouds, all of which are helpful to forecasters.
The infrared signal of the AIRS instrument does not penetrate through clouds. Where there are no clouds the AIRS instrument reads the infrared signal from the ocean and land surfaces, revealing warmer temperatures in orange and red.
Related link:
> NASA'S Johnson Space Center Closes For Ike
Text credit: Rob Gutro, NASA's Goddard Space Flight Center
Sept. 10, 2008
Hurricane Ike Expected to Strengthen; Now Raining on Lower Florida Keys, Cuba
 Credit: NASA JPL
> Larger image On Wednesday, Sept. 10, Hurricane Ike was raining and blowing on the Lower Florida Keys and western Cuba, and is expected to gather strength in the warm waters of the Gulf of Mexico over the next couple of days.
The National Hurricane Center's forecast track now takes Ike somewhere near Corpus Christi, Texas early Saturday morning, Sept. 13, but that can change. The actual area that Ike can strike is anywhere from northeast Mexico to the Texas/Louisiana border.
At 8:00 a.m. EDT on Sept. 10, Ike's maximum sustained winds were near 85 mph, and he's a category one hurricane on the Saffir-Simpson Scale. Ike is forecast to become a major hurricane (Category 3 and up) in the central Gulf of Mexico.
Ike's center was located 45 miles north of the western tip of Cuba and about 430 miles southeast of the mouth of the Mississippi River! That's near 23.9 degrees north latitude and 85.3 degrees west longitude. Ike is moving northwest near 8 mph, and should again resume a west-northwest track. Minimum central pressure was near 959 millibars.
To see live National Weather Service Radar of the Ike's rains, go to the National Weather Radar Mosaic at http://radar.weather.gov/Conus/index_loop.php.
At 9:30 a.m. EDT, Ike's rains stretched from western Cuba to the Florida Keys and was moving away toward the northwest.
Hurricane Ike Captured Dumping Heavy Rains on Western Cuba
Hurricane Ike was over western Cuba when the Tropical Rainfall Measuring Mission (TRMM) satellite captured Ike at 18:18 UTC (2:18 p.m. EDT) on September 9. Ike was a category one hurricane on the Saffir-Simpson scale with wind speeds of about 65 knots (75 mph) at the time of this image. This meant that the mountains of eastern Cuba had taken a toll on Ike which was a powerful category four hurricane with wind speeds of 105 knots (121 mph) before Cuban landfall. This image shows rainfall from Ike ranging from 10 to 40 millimeters (.4 to 1.6 inches) per hour.
How Much Rain is Ike Expected to Bring for Cuba and Southern Florida?
According to the National Hurricane Center, "Ike is expected to produce rainfall accumulations of 6 to 12 inches over western Cuba today, with isolated maximum amounts of up to 20 inches possible. These rains are likely to cause life-threatening flash Floods and mud slides over mountainous terrain. Rainfall accumulations of 1 to 3 inches are possible over the Florida Keys and rainfall amounts of 2 to 4 inches are possible over portions of southwest Florida this morning." For more information about how TRMM looks at rainfall, visit NASA's TRMM website at http://trmm.gsfc.nasa.gov/.
TRMM is a joint mission between NASA and the Japanese space agency JAXA.
Florida Keys, Cuba: Coastal Storm Surges, Isolated Tornadoes, Rip Currents
The National Hurricane Center notes that coastal storm surge flooding and waves along the coasts of Cuba should gradually subside today. Storm surge flooding of 1 to 3 feet along with large and dangerous waves are possible in the Lower Florida Keys.
Large swells generated by Ike will continue to affect the east and west coasts of Florida for the next day or so. These swells could generate dangerous and life-threatening rip currents. Isolated tornadoes and waterspouts are possible over the Florida Keys and extreme south Florida this morning.
Text credit: Rob Gutro, NASA's Goddard Space Flight Center
Sept. 9, 2008
NASA Satellites Providing Forecasters With Lots of Satellite Data on Ike
 Credit: NASA/JPL
> Larger image Hurricane Ike is poised to enter the Gulf of Mexico on Sept. 9th, as he exits Cuba. Several NASA satellites are continually feeding data to forecasters at the National Hurricane Center to help them get a better understanding of Ike and how he may behave once back in open waters. NASA satellites are analyzing winds, cloud temperatures, cloud heights, and rainfall rates, all of which help determine if a storm is getting stronger or weaker.
QuikSCAT Watching Ike's Winds
NASA's Quick Scatterometer satellite (QuikScat) has been watching Ike's winds by using microwaves to peer into the clouds. QuikScat can determine the speed of the rotating winds, and its data is used by forecasters at the National Hurricane Center.
This image from QuikScat shows Ike's wind speeds in different colors and wind direction are indicated by small barbs. White barbs point to areas of heavy rain. The highest wind speeds, are shown in purple, which indicate winds over 40 knots (46 mph). This image was captured on Sept. 8 at 11:12 UTC (7:12 a.m. EDT), when Ike was over central Cuba. You can see Ike's center by the area of purple circulating over the land.
Where is Ike on Sept. 9?
At 11:00 a.m. EDT, Ike was packing maximum sustained winds near 80 mph. Due to the interaction with land he's weakened to a Category One hurricane. He's expected to re-strengthen upon entering the Gulf later today.
Ike's center was near latitude 22.6 north and longitude 83.0 west or about 55 miles southwest of Havana, Cuba. Ike made landfall around 10:30 a.m. EDT in the extreme southeastern part of the province of Pinar del Rio, Cuba. Ike is moving toward the west-northwest near 13 mph and should continue, entering the southeastern Gulf of Mexico during the afternoon. Minimum central pressure is 965 millibars.
CloudSat Captures Ike's Arm's Length from the Side
 Credit: NASA/JPL/Colorado State University/Naval Research Laboratory-Monterey
> Larger image NASA's CloudSat satellite's Cloud Profiling Radar captured a sideways look across one of the arms of Hurricane Ike on Tuesday, Sept. 9 at 7:15 Zulu Time (3:15 a.m. EDT). This is a combination of the CloudSat image (on the bottom) and an image from NASA's Aqua satellite (top).
The top image from NASA's Aqua satellite was supplied through the U.S. Naval Research Laboratory and Ike's eye is visible in the middle of the storm. It was created using data from the Advanced Microwave Scanning Radiometer- EOS (AMSR-E). Over the ocean, AMSR-E microwave frequencies probe through smaller cloud particles to measure the microwave emissions from larger raindrops. AMSR-E provides improved measurements of rainfall rates.
The image on the bottom is from NASA's CloudSat satellite. Deborah Vane, CloudSat Mission Project Manager at NASA's Jet Propulsion Laboratory, Pasadena, Calif. said "There is still plenty of rain in the bands, observable as areas where the surface reflectance disappears due to the attentuation of the radar signal in the heavy rain."
The red line through the Aqua satellite image shows the vertical cross section of radar, basically what Ike's clouds looked like sideways. The colors indicate the intensity of the reflected radar energy. The top of Ike's clouds reach over 14 kilometers, or approximately 8.7 miles high.
The blue areas along the top of the clouds indicates cloud ice, while the wavy blue lines on the bottom center of the image indicate intense rainfall. Notice that the solid line along the bottom of the panel, which is the ground, disappears in this area of intense precipitation. It is likely that in the area the precipitation rate exceeds 30mm/hr (1.18 inches/hour) based on previous studies.
NASA's Aqua Satellite Captures an Impressive Shot of Ike's Cold Clouds
 Credit: NASA/JPL
> Larger image This infrared image of Hurricane Ike was created by data from the Atmospheric Infrared Sounder (AIRS), an instrument that flies aboard NASA's Aqua satellite. The image was created on Sept. 9 at 7:11 UTC (3:11 a.m. EDT), just minutes before the CloudSat image above, while he was over western Cuba.
The AIRS images show the temperature of the cloud tops or the surface of the Earth in cloud-free regions. The coldest cloud temperatures are in purple located around Ike's center. The second coolest temperatures are in blue, which make up the clouds outside of Ike's eye. Those areas in purple have some of the strongest storms.
Scientists use the AIRS data to create an accurate 3-D map of atmospheric temperature, water vapor and clouds, all of which are helpful to forecasters. AIRS' infrared signal doesn't penetrate through clouds. Where there are no clouds the AIRS instrument reads the infrared signal from the surface of the ocean waters, revealing warmer temperatures in orange and red. You can see that the waters of the Gulf of Mexico are warm, and exceed 80 degrees Fahrenheit, the threshold for temperatures to keep powering a tropical cyclone.
Where is Ike Going in the Gulf?
Much to the relief of Louisiana residents, but not to people who live in Texas, forecast models now take Ike into southeastern Texas early Sat. Sept. 13.
Text credit: Rob Gutro, NASA's Goddard Space Flight Center
Sept. 8, 2008, second update
Hurricane Ike Slams Cuba on September 8, 2008

NASA's TRMM spacecraft observed this view of Hurricane Ike on September 8, 2008 as slammed into Cuba . At this time the storm had weakened to a category 2 hurricane with sustained winds of 85 knots (98 mph) and a pressure reading of 960 millibars. Hurricane-force winds were extending outward 60 miles from the center, while tropical storm-force winds extended up to 200 miles from the center. The cloud cover in this animation is taken by TRMM's Visible and Infrared Scanner(VIRS) and the GOES spacecraft. The rain structure is taken by TRMM's Tropical Microwave Imager (TMI) and TRMM's Precitation Radar(PR) instruments. TRMM looks underneath of the storm's clouds to reveal the underlying rain structure. Blue represents areas with at least 0.25 inches of rain per hour. Green shows at least 0.5 inches of rain per hour. Yellow is at least 1.0 inches of rain and red is at least 1.5 inches of rain per hour.
> View and download video from the Scientific Visualization Studio
Credit: NASA's Goddard Space Flight Center's Scientific Visualization Studio
Sept. 8, 2008, first update
Hurricane Ike Pounding Cuba Today
 Credit: NASA JPL
> Larger image The National Hurricane Center reported that around mid-day, Sept. 8, Hurricane Ike was battering Camaguey, Cuba and moving toward western Cuba.
At 11:00 a.m. EDT Hurricane Ike was packing maximum sustained winds near 100 mph making him a category two hurricane on the Saffir-Simpson scale. Slight weakening is possible today until Ike moves back over water, where he is expected to gain strength once again. The center of Hurricane Ike was located near latitude 21.1 north and longitude 78.5 west. That's about 45 miles west-southwest of Camaguey, Cuba and about 290 miles east-southeast of Havana, Cuba. Ike is moving toward the west near 14 mph, but a turn toward the west-northwest should begin later today. The estimated minimum central pressure is 960 millibars.
NASA's Aqua Satellite Checks Ike's Temperature
This infrared image of Ike was created by data from the Atmospheric Infrared Sounder (AIRS), an instrument that flies aboard NASA's Aqua satellite. The image was created on September 8 at 6:29 UTC (2:29 a.m. EDT). Ike was centered right on the coastline of Cuba during this satellite pass.
The AIRS images show the temperature of the cloud tops or the surface of the Earth in cloud-free regions. The lowest temperatures (in purple) are associated with high, cold cloud tops that make up the top of the tropical cyclone. The AIRS data creates an accurate 3-D map of atmospheric temperature, water vapor and clouds, all of which are helpful to forecasters.
The infrared signal of the AIRS instrument does not penetrate through clouds. Where there are no clouds the AIRS instrument reads the infrared signal from the surface of the ocean waters, revealing warmer temperatures in orange and red.
Florida Posts Hurricane Watches, Tropical Storm Warnings
On Sept. 8, a hurricane watch remains in effect for the Florida Keys from Ocean Reef southward to the Dry Tortugas. A tropical storm warning is in effect for the Florida Keys from ocean reef southward to the Dry Tortugas, including Florida Bay. A tropical storm warning means that tropical storm conditions are expected within the warning area within the next 24 hours.
 Credit: NASA JPL/Colorado State University/Naval Research Laboratory-Monterey
> Larger image CloudSat's Sideways View of Ike as a Powerful Category 4 Storm
NASA's CloudSat satellite's Cloud Profiling Radar captured a sideways look across Hurricane Ike on Sept. 7 at 18:24 UTC (4:24 p.m. EDT) when he was a Category 4 hurricane.
For comparison of what the storm looked like from the top down, the top image from NASA's Aqua satellite was supplied through the U.S. Naval Research Laboratory and Ike's eye is visible in the middle of the storm. It was created using data from the Advanced Microwave Scanning Radiometer- EOS (AMSR-E). Over the ocean, AMSR-E microwave frequencies probe through smaller cloud particles to measure the microwave emissions from larger raindrops. AMSR-E provides improved measurements of rainfall rates.
The image on the bottom is from NASA's CloudSat satellite. The red line through the Aqua satellite image shows the vertical cross section of radar, basically what Ike's clouds looked like sideways. The colors indicate the intensity of the reflected radar energy. The blue areas along the top of the clouds indicate cloud ice, while the wavy blue lines on the bottom center of the image indicate intense rainfall. Notice that the solid line along the bottom of the panel, which is the ground, disappears in this area of intense precipitation. It is likely that in the area the precipitation rate exceeds 30mm/hr (1.18 inches/hour) based on previous studies.
Storm Surges, Swells, Isolated Tornadoes, Heavy Rainfall
The southern coast of Cuba can expect coastal storm surge flooding of 9-12 feet above normal tide levels. Storm surge flooding of 1-3 feet are possible in the Florida Keys. Meanwhile, large swells generated by Hurricane Ike will continue to affect portions of the southeast U.S. coast during the next couple of days. These waves could generate dangerous and life-threatening rip currents.
Ike is expected to produce rainfall accumulations of 6 to 12 inches over Cuba with isolated maximum amounts of up to 20 inches. Jamaica can see between 3-6 inches; the Cayman Islands between 2-4 inches; and Florida Keys 1-3 inches.
Isolated tornadoes are possible over the extreme southern Florida peninsula and the Florida Keys through tomorrow.
Turks and Caicos Damages
CNN News reported on Monday morning, Sept. 8, that Grand Turk Island is without power, and 40 percent of the island was underwater. The report also noted that as much as 90 percent of all structures were damaged on the island. Grand Turk, the capital of the Turks and Caicos, is home to about 3,000 people. Hurricane Ike was the second hurricane to slam the islands in only six days, following Hanna. Hanna struck the islands as a Category 1 hurricane on Sept. 1.
Text credit: Rob Gutro/Goddard Space Flight Center
Sept. 7, 2008, second update
Hurricane Ike off the Coast of Cuba
 Credit: Jeff Schmaltz, NASA's MODIS Rapid Response Team
> Larger image
Just an hour and a half after this image of Hurricane Ike was captured by the Moderate Resolution Imaging Spectroradiometer (MODIS) on NASA’s Aqua satellite on September 7, 2008, the National Hurricane Center released its 2:00 p.m. EDT public advisory, warning residents of Cuba and other Caribbean islands, as well as the Florida Keys, that Ike was a dangerous Category 4 hurricane, with winds near 135 mph (215 kilometers per hour), with higher gusts.
The image shows Ike approaching eastern Cuba, the eye just west of Great Inagua Island (one of the Turks and Caicos Islands). According to later advisories, Ike made landfall as a Category 3 storm, with winds around 125 miles per hour. Heavy rains were predicted to cause deadly floods and mudslides in mountainous parts of Hispaniola (Haiti and the Dominican Republic) and Cuba.
Text credit: Rebecca Lindsey, NASA's Earth Observatory
Sept. 7, 2008, first update
Ike's Eye in Southern Bahamas on Sunday - Cuba, Florida Keys Preparing
On Sunday, Sept. 7, the Southeastern Bahamas were under a hurricane warning as Hurricane Ike was plowing his way through on a course to Cuba. Cuba and the Florida Keys have posted Hurricane Watches. A hurricane watch means that hurricane conditions are possible within the watch area...generally within 36 hours.
 > Larger image
Credit: NASA/NOAA GOES Project This visible image of Ike was created on Sept. 7 at 14:32 UTC (10:32 a.m. EDT) from the Geostationary Operational Environmental Satellite (GOES-12). GOES-12 is operated by the National Oceanic and Atmospheric Administration. It was created by NASA's GOES Project, located at NASA's Goddard Space Flight Center, Greenbelt, Md.
At 11:00 a.m. EDT Ike's maximum sustained winds are near 135 mph with higher gusts. Ike is an extremely dangerous category four hurricane on the Saffir-Simpson scale.
He was located about 15 miles west-southwest of Great Inagua Island and about 130 miles east-northeast of Guantanamo, Cuba, near latitude 21.0 north and longitude 73.4 west. Ike is moving toward the west near 13 mph and will continue today with a turn toward the west-northwest expected on Monday. On this track, Ike's center will move through the southeastern Bahamas today and move near or over eastern Cuba tonight, and near or over central Cuba late Monday. The estimated minimum central pressure is 949 millibars.
Storm Surges and Rainfall
The National Hurricane center said "Storm surge flooding of 13 to 18 feet above normal tide levels is expected. Large swells generated by Ike will affect portions of the southeast U.S. coast during the next couple of days. These waves could generate dangerous and life-threatening rip currents."
Rainfall amounts of 4 to 8 inches with isolated maximum amounts of 12 inches are expected over the Turks and Caicos islands and the southeastern Bahamas. Hispaniola and eastern Cuba could see 6 to 12 inches of rain with isolated maximum amounts of up to 20 inches possible.
 > Larger image
Credit: NASA/JPL NASA's AIRS Instrument Sees Lots of Cold High Clouds, Rain
This infrared image of Ike was created by data from the Atmospheric Infrared Sounder (AIRS), an instrument that flies aboard NASA's Aqua satellite. The image was created on Sept. 6 at 17:35 UTC (1:35 p.m. EDT).
The AIRS image shows the temperature of the cloud tops or the surface of the Earth in cloud-free regions. The coldest cloud temperatures are in purple. There is clearly a lot of purple in Ike, meaning high clouds and heavy rains. The eye is also visible as the circular area of blue in the center of the purple area. The second coolest temperatures are in blue. The AIRS data creates an accurate 3-D map of atmospheric temperature, water vapor and clouds, all of which are helpful to forecasters.
The infrared signal of the AIRS instrument does not penetrate through clouds. Where there are no clouds the AIRS instrument reads the infrared signal from the surface of the ocean waters, revealing warmer temperatures in orange and red. Text credit: Rob Gutro/ Goddard Space Flight Center
Sept. 6, 2008
Ike Still Category 3 Threatening the Bahamas, Hispaniola
On Saturday, Sept. 6, Hurricane Ike was still a powerful Category 3 storm on the Saffir-Simpson Scale, and he's eyeing the Bahamas and Hispaniola on Sept. 7.
Ike will likely pass near or over the Turks and Caicos Islands and the southeastern Bahamas later in the day on Sat. Sept. 6, or early Sunday, Sept. 7, and near the central Bahamas and the northern coast of eastern Cuba on Sunday night and early Monday.
As Ike continues west-southwestward, eastern Cuba may be posting a hurricane watch. Meanwhile, residents in south Florida and the Gulf of Mexico need to keep an eye on his track.
NASA's AIRS Instrument Sees Lots of Cold High Clouds, Rain
 > Larger image
Credit: NASA/JPL This infrared image of Ike was created by data from the Atmospheric Infrared Sounder (AIRS), an instrument that flies aboard NASA's Aqua satellite. The image was created on Sept. 5 at 5:53 UTC (1:53 a.m. EDT).
The AIRS image shows the temperature of the cloud tops or the surface of the Earth in cloud-free regions. The coldest cloud temperatures are in purple. There is clearly a lot of purple in Ike, meaning high clouds and heavy rains. The eye is also visible as the circular area of blue in the center of the purple area. The second coolest temperatures are in blue. The AIRS data creates an accurate 3-D map of atmospheric temperature, water vapor and clouds, all of which are helpful to forecasters.
The infrared signal of the AIRS instrument does not penetrate through clouds. Where there are no clouds the AIRS instrument reads the infrared signal from the surface of the ocean waters, revealing warmer temperatures in orange and red.
Where is Ike on Saturday, Sept. 6?
 > Larger image
Credit: NASA/NOAA GOES Project At 5:00 a.m. EDT, on Sept. 6, Ike was packing maximum sustained winds near 115 mph and may fluctuate in intensity, as happens with powerful storms. Ike's center was located near latitude 22.0 north and longitude 67.9 west or about 210 miles east of Grand Turk Island. He's moving west-southwest near 16 mph and will continue on that track for a day before turning west on Sunday. The estimated minimum central pressure is 962 millibars.
Storm surge flooding of 9 to 12 feet above normal tide levels. Rainfall amounts of 4 to 8 inches with isolated maximum amounts of 12 inches is expected over the Turks and Caicos Islands and Southeastern Bahamas.
This visible image of Ike was created on Sept. 6 at 12:25 UTC (8:25 a.m. EDT) from the Geostationary Operational Environmental Satellite (GOES-12), which is operated by the National Oceanic and Atmospheric Administration. It was created by NASA's GOES Project, located at NASA's Goddard Space Flight Center, Greenbelt, Md.
Text credit: Rob Gutro/Goddard Space Flight Center
Sept. 5, 2008, third update
Ike Causes a Hurricane Watch in Bahamas, Turks and Caicos Islands
 Credit: NASA/JPL/Colorado State University/Naval Research Laboratory-Monterey
> Larger image On Friday, Sept. 5 in the afternoon, the government of the Bahamas has issued a Hurricane watch for the southeastern Bahamas as well as for the Turks and Caicos Islands.
At 11:00 a.m. EDT. Ike had maximum sustained winds near 120 mph. His center was located near latitude 23.2 north and longitude 62.7 west or about 425 miles north of the Leeward Islands and about 550 miles. Ike is moving toward the west near 16 mph. Minimum central pressure is 954 millibars.
NASA's CloudSat satellite's Cloud Profiling Radar captured a sideways look across Hurricane Ike on Friday, Sept. 5 at 06:00 Zulu Time (2:00 a.m. EDT). This is a combination of the CloudSat image (on the bottom) and an image from NASA's Aqua satellite (top).
The top image from NASA's Aqua satellite was supplied through the U.S. Naval Research Laboratory and Ike's eye is visible in the middle of the storm. It was created using data from the Advanced Microwave Scanning Radiometer- EOS (AMSR-E). Over the ocean, AMSR-E microwave frequencies probe through smaller cloud particles to measure the microwave emissions from larger raindrops. AMSR-E provides improved measurements of rainfall rates.
The image on the bottom is from NASA's CloudSat satellite. The red line through the Aqua satellite image shows the vertical cross section of radar, basically what Ike's clouds looked like sideways. The colors indicate the intensity of the reflected radar energy. The top of Ike's clouds reach over14 kilometers, or approximately 8.7 miles high.
The blue areas along the top of the clouds indicates cloud ice, while the wavy blue lines on the bottom center of the image indicate intense rainfall. Notice that the solid line along the bottom of the panel, which is the ground, disappears in this area of intense precipitation. It is likely that in the area the precipitation rate exceeds 30mm/hr (1.18 inches/hour) based on previous studies.
Text credit: Rob Gutro, NASA's Goddard Space Flight Center
Sept. 5, 2008, second update
Hurricane Ike on September 4, 2008

NASA's TRMM spacecraft observed this view of Hurricane Ike on September 4, 2008 as it strengthened in the Atlantic. At this time the storm was an extremely dangerous category 4 hurricane with sustained winds of 125 knots (143 mph) and a pressure reading of 935 millibars. Hurricane-force winds were extending outward 45 miles from the center, while tropical storm-force winds extend up to 140 miles. The cloud cover in this animation is taken by TRMM's Visible and Infrared Scanner(VIRS) and the GOES spacecraft. The rain structure is taken by TRMM's Tropical Microwave Imager (TMI) and TRMM's Precitation Radar(PR) instruments. TRMM looks underneath of the storm's clouds to reveal the underlying rain structure. Blue represents areas with at least 0.25 inches of rain per hour. Green shows at least 0.5 inches of rain per hour. Yellow is at least 1.0 inches of rain and red is at least 2.0 inches of rain per hour.
> Download video from the Scientific Visualization Studio
Sept. 5, 2008, first update
All Eyes Are Turning Toward Hurricane Ike, the Powerhouse
 Credit NASA/JPL
> Larger image Hurricane Ike is a powerful Category 3 hurricane tracking through the tropical Atlantic Ocean, and headed toward the Bahamas and Turks and Caicos. Those islands just finished with Hanna, as she's now moving toward a U.S. landfall.
Looking ahead, computer models at the National Hurricane Center take Ike's 5 day track into southern Florida, so residents need to prepare now.
NASA satellites are being used to analyze powerful Hurricane Ike in many ways, and help forecasters at the National Hurricane Center. QuikSCAT can confirm Ike's powerful winds, the Aqua satellite's AIRS instrument sees the temperature inside Ike's clouds giving insight into his strength, and CloudSat can see how high and wide Ike is, giving forecasters an idea about how strong Ike is, and how widespread his clouds and winds are.
NASA's Aqua Satellite Checks Ike's Temperature
This infrared image of Ike was created by data from the Atmospheric Infrared Sounder (AIRS), an instrument that flies aboard NASA's Aqua satellite. The image was created on September 4 at 5:11 UTC (12:11 a.m. EDT) after Ike achieved Category 4 hurricane status on the Saffir-Simpson Scale. His eye, in blue, is clearly visible near the center.
The AIRS images show the temperature of the cloud tops or the surface of the Earth in cloud-free regions. The lowest temperatures (in purple) are associated with high, cold cloud tops that make up the top of Ike. The AIRS data creates an accurate 3-D map of atmospheric temperature, water vapor and clouds, all of which are helpful to forecasters.
The infrared signal of the AIRS instrument does not penetrate through clouds. Where there are no clouds the AIRS instrument reads the infrared signal from the surface of the ocean waters, revealing warmer temperatures in orange and red.
Where is Ike?
At 5:00 a.m. EDT Ike's maximum sustained winds are near 125 mph with higher gusts. The National Hurricane Center noted "Ike is a dangerous category three hurricane on the Saffir-Simpson hurricane scale. Although some weakening is forecast during the next day or two, Ike is still forecast to be a major hurricane in a couple of days."
 Credit NASA/JPL/Colorado State University/Naval Research Laboratory-Monterey
> Larger image Ike's eye was located about 460 miles north of the Leeward Islands, near latitude 23.7 north and longitude 61.0 west. He's moving west near 15 mph and will turn west-southwest tonight or early on Saturday then turn back to the west by Sunday. Estimated minimum central pressure is 945 millibars.
CloudSat Looks at Ike Sliced in Half
NASA's CloudSat satellite's Cloud Profiling Radar captured a sideways look across Ike on Sept. 2 at 16:15 UTC (2:15 p.m. EDT). For comparison, the top image is from the National Oceanic and Atmospheric Administration's Geostationary Operational Environmental Satellite (GOES-12) around the same time.
The red line through the GOES satellite image shows the vertical cross section of radar, basically what Hanna's clouds looked like sideways. The colors indicate the intensity of the reflected radar energy. The top of Ike's clouds are over 14 kilometers (8.7 miles) high.
The blue areas along the top of the clouds indicate cloud ice, while the wavy blue lines on the bottom center of the image indicate intense rainfall. Notice that the solid line along the bottom of the panel, which is the ground, disappears in this area of intense precipitation. It is likely that in the area the precipitation rate exceeds 30mm/hr (1.18 inches/hour) based on previous studies.
Text credit: Rob Gutro (from NHC reports), NASA's Goddard Space Flight Center
Sept. 4, 2008
 Hurricane Ike. Image credit: NASA/JPL
> Full resolution Unlikable Ike Looms Large
Hurricane Ike, a compact but powerful storm with maximum sustained winds of 217 kilometers (135 miles) per hour, marches west in this Sept. 4 early morning infrared image from NASA's Aqua spacecraft.
Ike Becomes a Major Hurricane: Category 4
Around 11:00 p.m. EDT on Sept. 3, Hurricane Ike intensified into a Category 4 hurricane on the Saffir-Simpson Scale. Classified a major hurricane, he was packing sustained winds near 135 miles per hour in the open waters of the Atlantic.
 Credit: NASA/Jesse Allen/MODIS Rapid Response Team
> Larger image By 5:00 a.m. EDT Sept. 4, his winds intensified further to 145 mph. He's expected to fluctuate in intensity between a Category 4 and 3 over the next day or two.
Ike's center was located about 550 miles northeast of the Leeward Islands, near Latitude 22.7 north and longitude 55.8 west. He's moving west-northwest near 17 mph, and is expected to turn west, then west-southwest. His minimum central pressure is 935 millibars.
This image from the Moderate Resolution Imaging Spectroradiometer (MODIS) on NASA’s Aqua satellite on September 2 shows Ike getting organized in the central Atlantic. In the northwest (upper left) quadrant of the storm and in the western half of the eye, distinct clusters of thunderstorms give the storm a boiling appearance. In the east, the cloud deck is more diffuse, with wispy streamers like tassels around the edge.
 Credit: NASA/JPL
> Larger image NASA's Aqua Satellite Sees Cloud Temperatures
The top satellite image of Hurricane Ike was created by data from the Atmospheric Infrared Sounder (AIRS) on NASA's Aqua satellite. It shows the temperature of Ike's cloud tops on Sept. 3, 13:05 UTC (9:05 a.m. EDT). The lowest temperatures (in purple) are associated with high, cold cloud tops that make up Ike's center. There are large areas of strong convection (rising air and rainfall) shown here in purple. Where there are no clouds the AIRS instrument reads the infrared signal from the surface of the Earth (over both land and water), revealing warmer temperatures (red).
The AIRS data creates an accurate 3-D map of atmospheric temperature, water vapor and clouds, all of which are helpful to forecasters.
Text credit: Rob Gutro and Rebecca Lindsey, NASA's Goddard Space Flight Center
Sept. 3, 2008
Tropical Storm Ike in South Central Atlantic, Almost a Hurricane
 Credit: NASA JPL
 > Larger image Tropical Storm Ike is on the verge of becoming another Atlantic Ocean hurricane. His winds were around 70 mph on Sept. 3 at 11:00 a.m. EDT. He's currently in the south central Atlantic Ocean, but forecast models take his track into the southern Bahamas and Hispaniola by the weekend. After Gustav and Hanna, those areas certainly don't need the rain.
NASA's TRMM Satellite Checks Ike's Rainfall from Space
The image above was made from data captured by the Tropical Rainfall Measuring Mission (TRMM) satellite on August 2 at 11:50 UTC (7:50 a.m. EDT). This TRMM image shows the horizontal pattern of rain intensity within Hanna. The center is located near the yellow, green and red areas, which indicate rainfall between 20 and 40 millimeters (.78 to 1.57 inches) per hour. The red area is considered moderate rainfall. In this image, Ike was east of the Leeward Islands and moving westward.
For more information about how TRMM looks at rainfall, visit NASA's TRMM website at: http://trmm.gsfc.nasa.gov/. TRMM is a joint mission between NASA and the Japanese space agency JAXA.
 Credit: NASA JPL
 > Larger image NASA's Aqua Satellite Reveals Cold Clouds in Ike
This infrared image of Hanna was created by data from the Atmospheric Infrared Sounder (AIRS), an instrument that flies aboard NASA's Aqua satellite. The image was created on Sept. 2 at 16:17 UTC (12:17 p.m. EDT).
The AIRS image shows the temperature of the cloud tops or the surface of the Earth in cloud-free regions. The lowest temperatures (in purple) are associated with high, cold cloud tops that make up the top of Ike. The AIRS data creates an accurate 3-D map of atmospheric temperature, water vapor and clouds, all of which are helpful to forecasters.
The infrared signal of the AIRS instrument does not penetrate through clouds. Where there are no clouds the AIRS instrument reads the infrared signal from the ocean and land surfaces, revealing warmer temperatures in orange and red.
Where is Ike on Sept. 3?
At 11:00 a.m. EDT, Sept. 3, Ike had maximum sustained winds near 70 mph, and will likely become a hurricane later today. Ike's center was located near latitude 20.8 north and longitude 51.2 west or about 740 miles east-northeast of the Leeward Islands. Ike is moving toward the west-northwest near 18 mph. A gradual turn toward the west is expected over the next 48 hours. Estimated minimum central pressure is 991 millibars.
Text credit: Rob Gutro, NASA's Goddard Space Flight Center
September 02, 2008
Bahamas Dealing With Hanna, Now Eyeing Ike For Weekend
 > Larger image Credit: NASA JPL
The Bahamas can't seem to get a break this hurricane season. On Sept. 2, they're being drenched with heavy rains from Tropical Storm Hanna. Now, in the eastern Atlantic, Tropical Storm Ike appears to be heading their way.
> Larger image Credit: NASA JPL
The Bahamas can't seem to get a break this hurricane season. On Sept. 2, they're being drenched with heavy rains from Tropical Storm Hanna. Now, in the eastern Atlantic, Tropical Storm Ike appears to be heading their way.
Tropical Storm Ike strengthened from a tropical depression nine, which formed around 11:00 a.m. EDT Sept. 1, half way between Africa and the Leeward islands.
The NASA Satellite Images
These infrared and visible images of Ike were created by data from the Atmospheric Infrared Sounder (AIRS), an instrument that flies aboard NASA's Aqua satellite. They were created on Sept. 1 at 15:35 UTC (11:35 a.m. EDT).

> Larger image
Credit: NASA JPL The infrared AIRS image shows the temperature of the cloud tops or the surface of the Earth in cloud-free regions. The lowest temperatures (in purple) are associated with high, cold cloud tops that make up the top of Tropical Storm Ike. The AIRS data creates an accurate 3-D map of atmospheric temperature, water vapor and clouds, all of which are helpful to forecasters.
The infrared signal of the AIRS instrument does not penetrate through clouds. Where there are no clouds the AIRS instrument reads the infrared signal from the surface of the ocean waters, revealing warmer temperatures in orange and red.
Ike Moving Westward Across Open Atlantic Ocean
On Sept. 2 at 5:00 a.m. EDT, Tropical Storm Ike was packing maximum sustained winds near 50 mph, and is expected to strengthen in the next two days. The center of Ike was located near 18.6 degrees north latitude, and 43.1 degrees west longitude, about 1,235 miles east of the Leeward Islands. Ike is moving west near 15 mph, and that motion is expected to continue for a couple of days. His minimum central pressure is 1005 millibars. The National Hurricane Center forecast brings Ike near the Bahamas as a hurricane by Sunday, Sept. 7.
Text credit: Rob Gutro, NASA's Goddard Space Flight Center