EMBARGOED UNTIL RELEASE AT 8:30 A.M. EDT, Thursday, June 5, 2008
| Technical: Clifford Woodruff | (202) | 606–9234 | |
| Media: Ralph Stewart | (202) | 606–2649 | BEA 08—24 |
| E–mail inquiries: | gdpbystate@bea.gov | ||
STATE ECONOMIC GROWTH SLOWED IN 2007
New estimates released today by the U.S. Bureau of Economic Analysis show that economic growth slowed in most states and regions of the U.S. in 2007. Real GDP growth slowed in 36 states, with declines in construction and finance and insurance restraining growth in many states.1 Nationally, real economic growth slowed from 3.1 percent in 2006 to 2.0 percent in 2007, one percentage point below the average growth of 3.0 percent for 2002–2006.

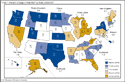
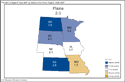
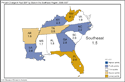
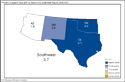
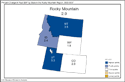
Real economic growth either slowed substantially or was unchanged in all eight BEA regions. The Far West region experienced the largest deceleration, dropping from 4.1 percent growth in 2006 to 1.9 percent in 2007. Even the Southwest region, which led all regions in growth in 2006 and 2007, slowed to 3.7 percent, down from 5.1 percent in 2006. The two regions that did not experience a slowdown in 2007—the Great Lakes and Plains—were already the slowest–growing regions in 2006.
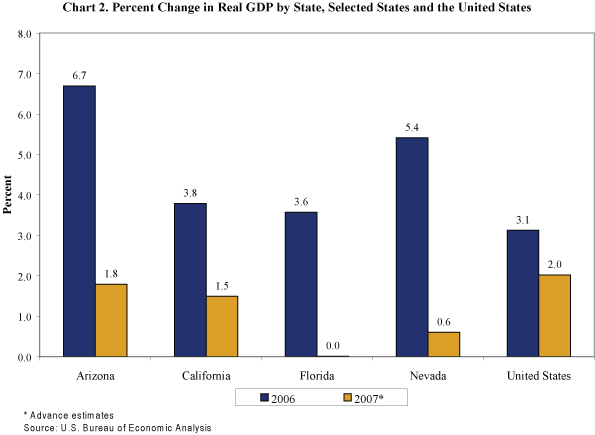
The deceleration in growth in 2007 was most pronounced in Arizona, California, Florida, and Nevada. Each of these states had experienced faster real growth than the nation since 2003, but slowed dramatically between 2006 and 2007, to rates below the national average (chart 2). In 2006, Arizona and Nevada were in the highest growth quintile, and California and Florida were in the second–highest quintile. But in 2007, Arizona dropped to the third quintile; California dropped to the second–lowest quintile; and Florida and Nevada dropped to the lowest quintile. In Arizona, Florida, and Nevada, construction subtracted more than one percentage point from real GDP growth. In California, construction and finance and insurance combined subtracted one percentage point from real growth.
Three states—Delaware, Michigan, and New Hampshire—saw their economies contract in 2007. Like the states above, construction– and finance–related industries were largely responsible for the weakness. In Delaware, the decline was primarily due to a large decline in finance and insurance, and secondarily due to a decline in construction. In Michigan and New Hampshire, declines in these industries and in real estate, rental, and leasing were largely responsible for the decreases in real GDP.
In contrast, Utah had the fastest economic growth in 2007 (5.3 percent), growing at more than twice the national rate. Durable goods manufacturing, retail trade, and real estate, rental, and leasing led the way in Utah, accounting for more than half the state's growth. New York was the only eastern state among the ten fastest–growing states. Contrary to the nation and most states, finance and insurance was a strong contributor to growth in New York. Finance and insurance along with real estate, rental, and leasing accounted for 53 percent of New York's growth.
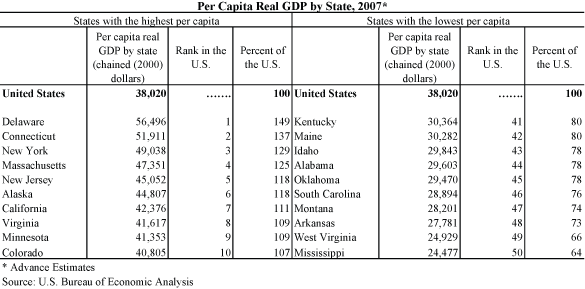
Per capita real GDP by state in 2007. Delaware's per capita real GDP of $56,496 was the highest in the nation, 49 percent above the national average. Delaware's ranking reflects a large concentration in the highly capitalized finance and insurance sector. Mississippi's per capita real GDP of $24,477 was the lowest in the nation, 36 percent below the national average. Nine of the top ten states and all of the bottom ten states were in these groups, respectively, in 2006 and 2007. In the top ten states, Colorado replaced Nevada.
Several states experienced actual declines in per capita real GDP in 2007. In addition to the states with contractions in real GDP, economic growth slowed in several states to rates below population growth, causing lower per capita real GDP.
Revisions. For 2004 and 2005, the annual revisions to percent change were modest. Not unexpectedly, the advance estimates for 2006, released in June 2007, had larger revisions. For 2006, only in the states of Idaho, Wyoming, New Mexico, Alaska, and Oklahoma did the absolute change exceed three percentage points. The advance estimates released in June 2007 correctly indicated the direction of change for 48 states and the District of Columbia.
The GDP–by–state estimates for 2004–2006 incorporate new and revised data from the U.S. Census Bureau, specifically, new Annual Survey of Manufactures (ASM) data for 2006 and revised ASM for 2005, new State and Local Government Finances data for 2005, and new State Government Finances data for 2006. These estimates also incorporate the annual revision to BEA's GDP–by–industry estimates released January 29, 2008 and state personal income estimates released March 26, 2008.
Tables 1–5 show these results in more detail; complete detail is available on BEA's Web site at www.bea.gov.
The advance estimates by NAICS sector for 2007 are based primarily on preliminary estimates of earnings by industry from BEA's regional economic accounts released March 26, 2008 and on the advance GDP–by–industry estimates from BEA's annual industry accounts released April 29, 2008. Preliminary farm sector cash receipts data from the U.S. Department of Agriculture are incorporated in the agriculture, forestry, fishing, and hunting estimates. Preliminary value of production and price data from the U.S. Department of the Interior and the U.S. Department of Energy are incorporated in the mining estimates.
More information on the methodology used to produce the advance 2007 estimates, on the regular (revised) GDP–by–state estimates for 2004–2006, and on revisions to the GDP–by–state estimates will appear in an article in the July 2008 issue of the Survey of Current Business, BEA's monthly journal.
Definitions. GDP by state is the state counterpart of the Nation's gross domestic product (GDP), the Bureau's featured and most comprehensive measure of U.S. economic activity. GDP by state is derived as the sum of the GDP originating in all the industries in a state.
The estimates of real GDP by state are prepared in chained (2000) dollars. Real GDP by state is an inflation-adjusted measure of each state's gross product that is based on national prices for the goods and services produced within that state. The estimates of real GDP by state and of quantity indexes with a base year of 2000 were derived by applying national implicit price deflators to the current-dollar GDP-by-state estimates for the 64 detailed NAICS-based industries for years 1997 forward and for the 63 detailed SIC-based industries for years 1977-1997. Then, the chain-type index formula that is used in the national accounts is used to calculate the estimates of total real GDP by state and of real GDP by state at more aggregated industry levels.
Real GDP by state may reflect a substantial volume of output that is sold to other states and countries. To the extent that a state's output is produced and sold in national markets at relatively uniform prices (or sold locally at national prices), real GDP by state captures the differences across states that reflect the relative differences in the mix of goods and services that the states produce. However, real GDP by state does not capture geographic differences in the prices of goods and services that are produced and sold locally.
BEA is working toward a long–term goal of replacing the national implicit price deflators used to deflate state–level current–dollar GDP by industry with state–specific prices. A paper now posted on BEA's Web site, "Estimates of State and Metropolitan Price Levels for Consumption Goods and Services in the United States, 2005, by Bettina H. Aten (http://www.bea.gov/papers/pdf/aten_estimates_state_metro_2005.pdf), estimates spatial price deflators that may be used for adjusting price level differences across geographic areas (but not across time). The work is based on micro–level price data from the Consumer Price Index of the U.S. Bureau of Labor Statistics and the American Community Survey of the U.S. Census Bureau. It represents an important first step in deriving producer–type price indexes–which currently are the basis for the national implicit price deflators used in BEA's GDP–by–state accounts–at the state level. BEA's plans to continue research into developing state–level prices and to explore estimating GDP by state on an expenditure basis.
Relation of GDP by state to U.S. Gross Domestic Product (GDP). An industry's GDP by state, or its value added, in practice, is calculated as the sum of incomes earned by labor and capital and the costs incurred in the production of goods and services. That is, it includes the wages and salaries that workers earn, the income earned by individual or joint entrepreneurs as well as by corporations, and business taxes such as sales, property, and Federal excise taxes–that count as a business expense.
GDP is calculated as the sum of what consumers, businesses, and government spend on final goods and services, plus investment and net foreign trade. In theory, incomes earned should equal what is spent, but due to different data sources, income earned, usually referred to as gross domestic income (GDI), does not always equal what is spent (GDP). The difference is referred to as the "statistical discrepancy."
Starting with the 2004 comprehensive revision, BEA's annual industry accounts and its GDP–by–state accounts allocate the statistical discrepancy across all private–sector industries. Therefore, GDP–by–state estimates are now conceptually more similar to GDP estimates in the national accounts than they had been in the past.
Except for small differences resulting from the GDP–by–state accounts excluding Federal military and civilian activity located overseas (because it cannot be attributed to a particular state) and the GDP–by–industry NIPA (National Income and Product Account) reconciliation item, U.S. growth rates of real GDP by state are nearly identical to GDP–by–industry growth rates when these were originally published in January and April 2008. The GDP–by–industry growth rates are identical to those from the annual revision of the NIPAs released in July 2007. Due to revisions since July 2007, the national rates of GDP growth in the NIPAs may differ from the U.S. growth rates of real GDP by state.
BEA's national, international, regional, and industry estimates; the Survey of Current Business; and BEA news releases are available without charge on BEA's Web site at www.bea.gov. By visiting the site, you can also subscribe to receive free e–mail summaries of BEA releases and announcements.
1. Real GDP is an inflation–adjusted measure of each state's production, wherever sold. It is not a measure of the prices of goods and services sold in each state. For a further description, see the "Explanatory Notes" section in this release.