skip to content
Seal of U.S. Department of Labor
U.S. Department of Labor
Employment & Training Administration

Photos representing the workforce - Digital Imagery© copyright 2001 PhotoDisc, Inc.

www.doleta.gov
Advanced Search
About Us Find Job & Career Information Business and Industry Workforce Professionals Grants and Contracts ETA Library Foreign Labor Certification Performance and Results Regions and States
ETA Home  >  Performance and Administration >  Charts > 
Sitemap   Printer Friendly Version
     
     
  veteran07  
     
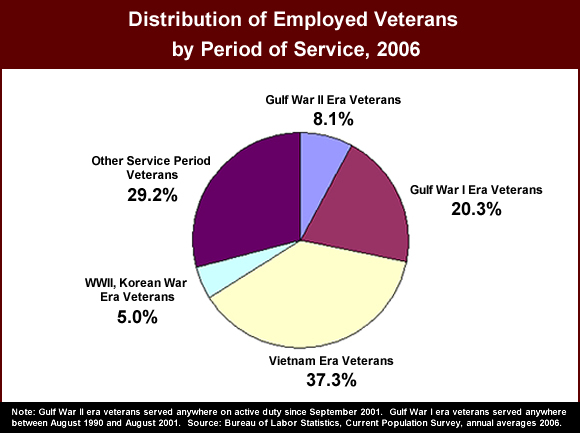
  Employed Veterans Pie Chart:  This chart shows the distribution of employed veterans by period of service in 2006.  Gulf War II era veterans were 8.1 percent of the total employed veterans, Gulf War I era veterans were 20.3 percent of the total, Vietnam War era veterans were 37.3 percent, World War II and Korean War era veterans were five percent.  Veterans from other service periods constituted 29.2 percent of the total.

Note: Gulf War II era veterans served anywhere on active duty since September 2001.  Gulf War I era veterans served anywhere between August 1990 and August 2001.  The source was the Bureau of Labor Statistics, Current Population Survey, annual averages 2006.


  Distribution of Employed Veterans by Period of Service, 2006
 
Gulf War II Era Veterans 8.1%
Gulf War I Era Veterans 20.3%
Vietnam Era Veterans 37.3%
WWII, Korean War Era Veterans 5.0%
Other Service Period Veterans 29.2%


Created: January 31, 2008
Updated: May 13, 2008