
10.1
SIGNIFICANT EXTRATROPICAL TORNADO OCCURRENCES IN FLORIDA DURING STRONG EL NINO AND STRONG LA NINA EVENTSBartlett C. Hagemeyer National Weather Service Melbourne, Florida 32935
1. INTRODUCTION
Extensive research by the staff of National Weather Service (NWS) Office Melbourne, Florida has resulted in a significant advance in the understanding Florida tornado environments (see: research.html ). Recently, research has expanded to refine the knowledge of environments that favor significant Florida tornadoes (F2 or greater or fatalities). Tornadoes of F2 or greater intensity are rare in Florida, but are responsible for 93% of tornado deaths. Hagemeyer (1998) presented results of a study of significant tropical and hybrid cyclone tornadoes. This paper relates to significant extratropical (ET) cyclone tornadoes. A locally developed Florida hazardous weather database (Hagemeyer and Carney 1995) and statistics from the Storm Prediction Center (SPC) through 1995 were used in this study.
Tornadoes associated with ET cyclones in the dry season (November - April) have been responsible for 65% of tornado deaths. Peak ET tornado activity generally occurs from January through April with a sharp decrease in early May. Fifty-eight percent of tornado deaths have occurred in January through April, and these months are considered the primary severe weather season in Florida. Prior to 1998, the worst Florida tornado outbreaks with respect to intensity and deaths had occurred from mid March through mid April. The majority of ET killer tornadoes occurred in the late night and morning hours with more than 60% occurring between midnight and noon.
Figure 1 shows F2 and greater dry season tornadoes reported in Florida from 1950
through 1998. The most F2 and greater tornadoes by far occurred in the 1983 dry season. At
the same time this study began, NOAA's Climate Prediction Center (CPC) released a forecast
of a very strong El Nino rivaling that of 1982-83. The impact of the 1982-83 El Nino on
Florida was not widely remembered since relatively few deaths occurred and the Media focus
was on California. However, El Nino's impact was well known among NWS offices in Florida.
Colin (1983) studied the statewide severe weather outbreak of February 1-2 1983 and Hagemeyer and Carney (1995) noted the importance of the unusually
strong jet stream in the Gulf of Mexico to the same outbreak - one of the most widespread
in state history.
To prepare for the El Nino event forecast by the CPC, the author expedited the study of significant ET tornadoes in El Nino/La Nina years. The 1982-83 El Nino was a record warm ENSO event and the 1983 ET severe weather season was the most active in Florida history. The La Nina of 1988-89 was an extreme cool ENSO event and the 1989 ET severe weather season was one of the least active, tying with several years for no significant tornadoes. The contrast between Storm Data reports in these two years was compelling (see: http://www.nws.fit.edu/83-89stormdata.html), however, no obvious correlation could be found between weaker El Nino/La Nina or neutral events and significant tornadoes. Based on these preliminary results the author presented "The Relationship Between El Nino and Severe Weather in Florida" at the Florida El Nino Summit sponsored by the Florida Department of Emergency Management on December 15th 1997. The message to government agencies, the Media, and the public from the Summit was to be prepared for the potential of a more active severe weather season based on the CPC forecast of historic El Nino conditions.
The 1998 Florida severe weather season was indeed very active. The most noteworthy
events were the deadliest tornado outbreak in Florida history on February 22-23 which killed 42 people, and the February 2nd
outbreak that was the most damaging weather event not associated with a tropical cyclone
or freeze in south Florida history.
As a result of the tornado outbreak of February 22-23 and those that followed, media
attention and professional debate was sparked about whether increased tornadic activity
was indeed related to El Nino. The issue was perhaps clouded by the Media's tendency to
blame specific tornado events on El Nino. The debate is important because it relates to
severe weather preparedness in Florida and public response to tornado watches and
warnings. What has been missing from the debate so far are analyses of regional
meteorological data and an accurate regional historical perspective. The first step in
this process is to bring objective meteorological data to the forefront of the issue and
begin to understand the processed involved. To address this issue, brief case studies of
ET severe weather seasons in two strong El Nino years (1983 and 1998) and one strong La
Nina year (1989) as they relate to ET tornado forecast parameters in Florida will be
presented.
2. STRONG EL NINO AND LA NINA SEVERE WEATHER SEASON CASE STUDIES
Figure 2 shows the idealized synoptic pattern favorable for strong and violent ET
tornado outbreaks in Florida. In this simple conceptual model warm, moist low level air is
drawn north over Florida ahead of a deepening low pressure system in the Gulf of Mexico.
Low level flow gradually strengthens and favorable low level shear develops, setting the
stage for the approach of a mid and upper level jet maxima to trigger the outbreak.
Hagemeyer (1992 and 1997) observed that ET tornado outbreaks
are almost always associated with maxima in the subtropical jet, but the event most
closely correlated with the onset of Florida tornado outbreaks is the approach of a
westerly 500 mb speed maxima. In an analysis of 20 upper air indices in close proximity to
Florida tornadoes Hagemeyer and Matney (1993) found the parameter with the highest
correlation to tornado strength was the bulk mean wind. In other words, given that
tornadoes occur, the higher the mean environmental wind, the stronger the tornadoes are
likely to be. However, the favorable convergence of conditions necessary for significant
tornadogenesis in the same space and time is usually extremely rare.

To relate these general concepts to El Nino, northern hemisphere charts of mean
February 250 mb isotachs and 850 mb geopotential height anomalies, axes of maximum winds,
and specific humidity (q) are shown for years 1983,
1998 and 1989 as Figures 3A-F. The 250 mb chart for February 1983 (3a) illustrates the
effect of the strong El Nino on the position and strength of the jet stream. The axis of
maximum winds extends from the eastern Pacific across Mexico and central Florida. The
highest mean wind speeds of 55 m/s are found over central Florida. If California storms of
winter 82-83 were linked with El Nino, it should be clear that Gulf of Mexico storms were
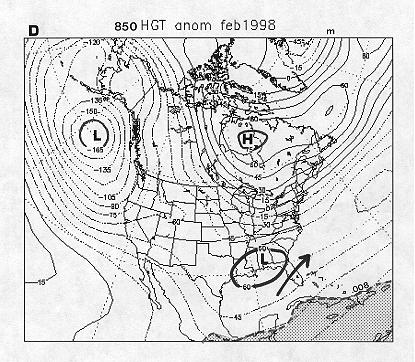
just as closely linked. Indeed, on Figure 3B two well-defined negative 850 mb height
anomalies are found over the northeast Pacific Ocean and the northeast Gulf of Mexico.
This is indicative of more frequent low pressure centers forming over the Gulf due the
nearly continuous presence of the jet stream in the region. The axis of highest 850 mb
mean winds is over south central Florida and the leading edge of 850 mb q representing 160% of normal (.008 kg/kg)is just south of
Florida. During February 1983 much of Florida was in the warm sector of a low in the
northeast Gulf of Mexico, experiencing stronger than normal southerly 850 mb flow,
abundant low level moisture, and a jet stream averaging 50-55 m/s. A composite chart of mean
severe weather parameters for the entire month would look very similar to Figure 1!
The unusual appearance of the jet stream over Florida in 1983 began in January, peaked in
March, and ended in late April (time lapse of mean monthly jet stream 82-83250.gif ).
Figure 3a-f. Mean monthly 250 mb isotachs (m/s) for February 1983 (3a), February 1998
(3c), and February 1989 (3e) with wind speeds greater than 50 m/s shaded. Mean monthly 850
mb geopotential height anomalies (m) for February 1983 (3b), February 1998 (3d), and
February 1989 (3f) with axises of maximum 850 mb winds indicated by heavy lines with
arrowheads, and areas of 850 mb specific humidity (q) greater than .008 kg/kg
shaded.


The 1997-98 El Nino was forecast to be as strong as the 1982-83 event. Figures 3c-d
illustrate the similarity between February conditions for these two events. Figure 3c
shows a nearly identical jet stream pattern with a 55 m/s maximum over central Florida.
The 850 mb negative height anomaly is stronger (-60 m) and to the north of 1983. Maximum
850 mb winds are over central Florida and the leading edge of 850 mb .008 kg/kg q is nearly the same. The abnormal appearance of the jet
stream over Florida began in December, peaked in February and weakened in late March (time
lapse 97-98250.gif).

The 1988-89 strong La Nina resulted in nearly the opposite meteorological conditions of
1983 and 1998. Figure 3e shows that the mean jet stream was over the northeastern United
States and 250 mb mean winds were abnormally low over the eastern Pacific and Gulf of
Mexico. The mean position of the jet stream never got any closer than the Tennessee Valley
(time lapse 88-89250.gif). A positive 850 mb height
anomaly (+45 m) is found over the northeast Gulf of Mexico, 850 mb winds are light over
Florida, and the leading edge of higher 850 mb q is
nearly off the map. Clearly Figures 3a-d illustrate a mean monthly atmosphere favorable
for severe weather in the vicinity of Florida and Figures 3e-f are indicative of an
environment generally unfavorable for severe weather. To better understand how strong El
Nino and La Nina events influence severe weather development an analysis of daily mean
conditions will be presented.


Time series of daily mean 500 mb U (m/s) for Orlando, Florida with severe
weather occurrences in Florida indicated from January 1st through April 30th
for 1983, 1998, and 1989 are shown as Figures 4a-c respectively. Figure 4a shows
significant variability in 500 mb U for 1983 with 23 peaks above normal, 8 of which
were at least 200% of normal. These 500 mb peaks generally correspond to peaks in 250 mb
U. There were 10 severe weather events during this period, all tornadic, and 7 of the
10 events had F2 or greater tornadoes. In all cases the tornadoes occurred at or after
peaks in 850 mb q and prior to peaks in 500 mb U. The tornado outbreaks of
February 1-2 and April 9, 1983 were historic events. Fortunately, only 7 people died in
these two outbreaks. The February 1-2 outbreak produced 7 F2 tornadoes, the greatest ever
for any ET event. Perhaps most unusual was the occurrence of five consecutive tornado
events of F2 intensity or greater in March and early April, unprecedented in Florida
history. The time series of mean daily 500 mb U for 1998 (Fig. 4b) also shows
significant
Figure 4a-c. Daily mean 500 mb U over Orlando, FL for January 1-April 30 1983,
1998, and 1989 with severe weather occurrences indicated in time by maximum F-scale. Mean
500 mb U indicated by heavy line. Arrows point to historic tornado outbreaks.


variability in 500 mb U with 18 peaks above normal, 5 of which were at least 200%
of normal. There were 11 severe weather events during the period (as of publication actual
number and strength of tornadoes not final). The February 22-23rd event produced 3 F3
tornadoes, the most F3 or greater tornadoes in any outbreak, and the second longest F2 and
greater tornado path length in a day (4/4/66 the most). Severe weather events are
concentrated in February and early March during a 30-day period of normal or above 500 mb U.
In contrast to 1983 and 1998, the time series of daily mean 500 mb U for 1989 (Fig. 4c) shows only six peaks above normal. Indeed, Figure 4c is almost the inverse of 1983 and 1998 indicating the predominance of high pressure and a general lack of storminess over Florida. Only 6 isolated tornado events occurred and 5 of them had only F0's. There were two periods of more than 30 days in which 500 mb U was at or below normal.
In summary, 500 mb U from January 1st through April 30th was at or above normal 70%, 73%, and 26 % of the time for 1983, 1998, and 1989 respectively. There were approximately 23 chances of organized severe weather during the severe weather season of 1983, 10 tornado events occurred and 7 were significant. There were 18 chances in 1998, 11 were severe and 2 were significant. There were 6 chances in 1989 and 4 were severe, none organized or significant. Clearly these significant El Nino/La Nina events produced significant climatological anomalies over the Gulf of Mexico and Florida that had a major impact on the potential for an environment favorable for significant tornadogenesis.
3.0 CONCLUDING REMARKS
The historic El Nino's of 1983 and 1998 set the stage for historic tornado activity in Florida. This brief study indicates that El Nino's of the magnitude of 1983 and 1998 increase the chances of severe weather outbreaks and stronger ET tornadoes simply by providing more opportunities for all the right ingredients to come together. The only recorded F4's in Florida history (4/4/66 and 4/15/58) occurred in relatively strong, but lesser El Nino years. The deadliest tornado outbreak prior to February 1998 occurred in a neutral year (3/31/62). History tells us we cannot rule out devastating tornadoes in any severe weather season, regardless of the state of El Nino. History indicates tells the threat of increased severe weather activity when significant El Nino's are forecast should be taken very seriously. There are very clear preparedness lessons for Florida: tornado watches and warnings issued in the dry season in the presence of strong jet stream dynamics in the late evening to mid morning represent particularly dangerous situations. This scenario could occur in any year, but is more likely in a strong El Nino year.
As long range forecasts of extreme climatic events continue to improve, they should be applied to state and regional forecast problems and used to increase preparedness and mitigate the effects of hazardous weather. With increased interest in El Nino's affects, much research will be stimulated in the coming years. The next step beyond initial case studies should be to establish physical links between ENSO and observed meteorological elements then attempt to forecast specific aspects of EL Nino such as the strength and location of the jet streams. If it were known that mean monthly conditions over Florida might resemble Figures 3a-d several months in advance then seasonal severe weather forecasts might be possible. Statistical studies that correlate specific meteorological elements such as the jet stream or 500 mb U, rather than gross measures of ENSO, to significant tornado activity would do more to advance the understanding of the physical processes involved.