

Use these links to access detailed analyses of Global and U.S. data. 
|
   |
|
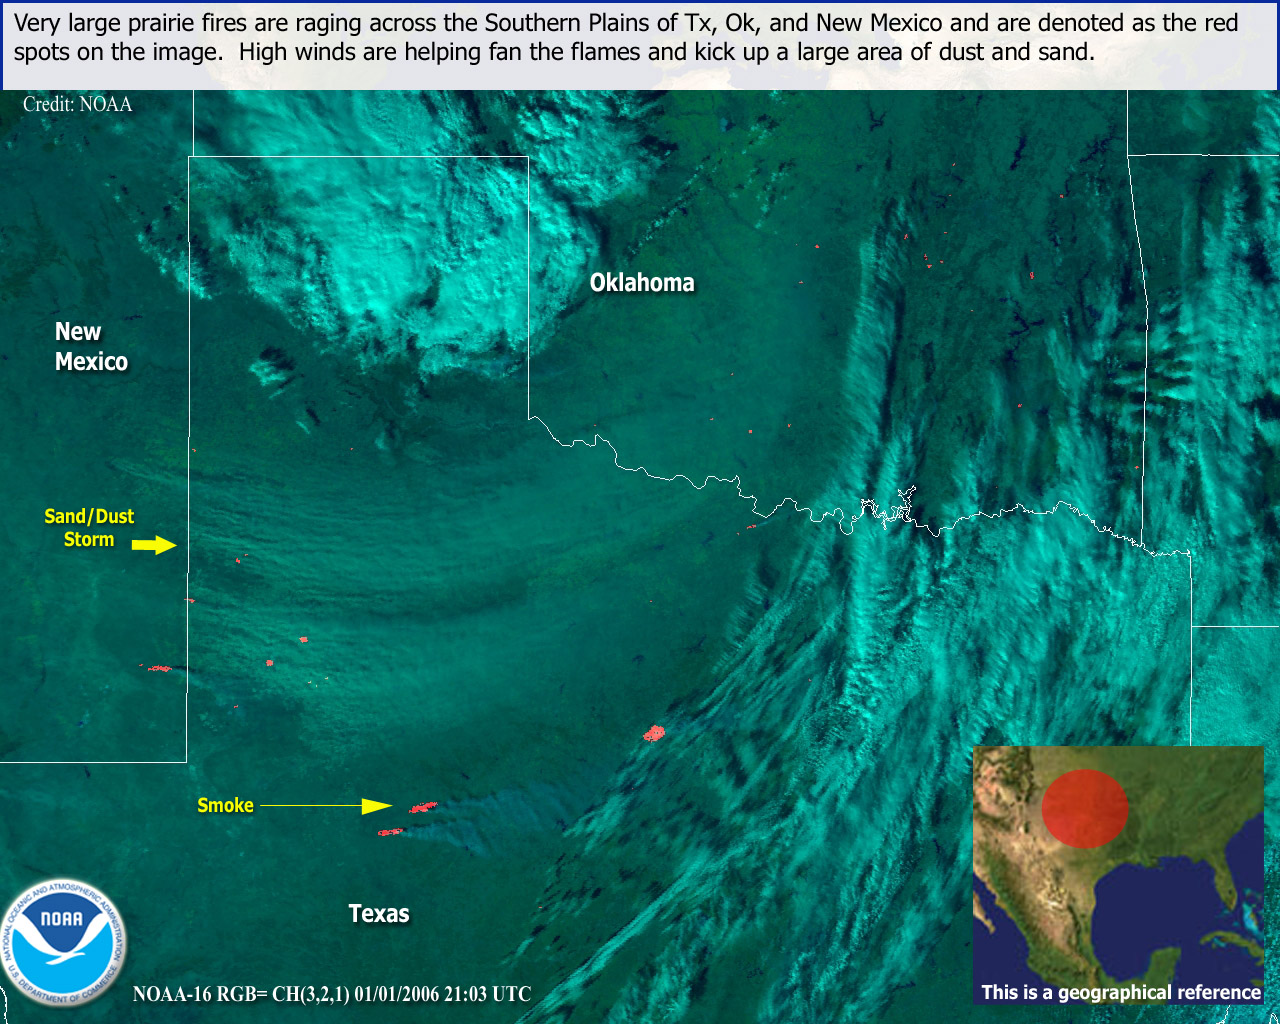
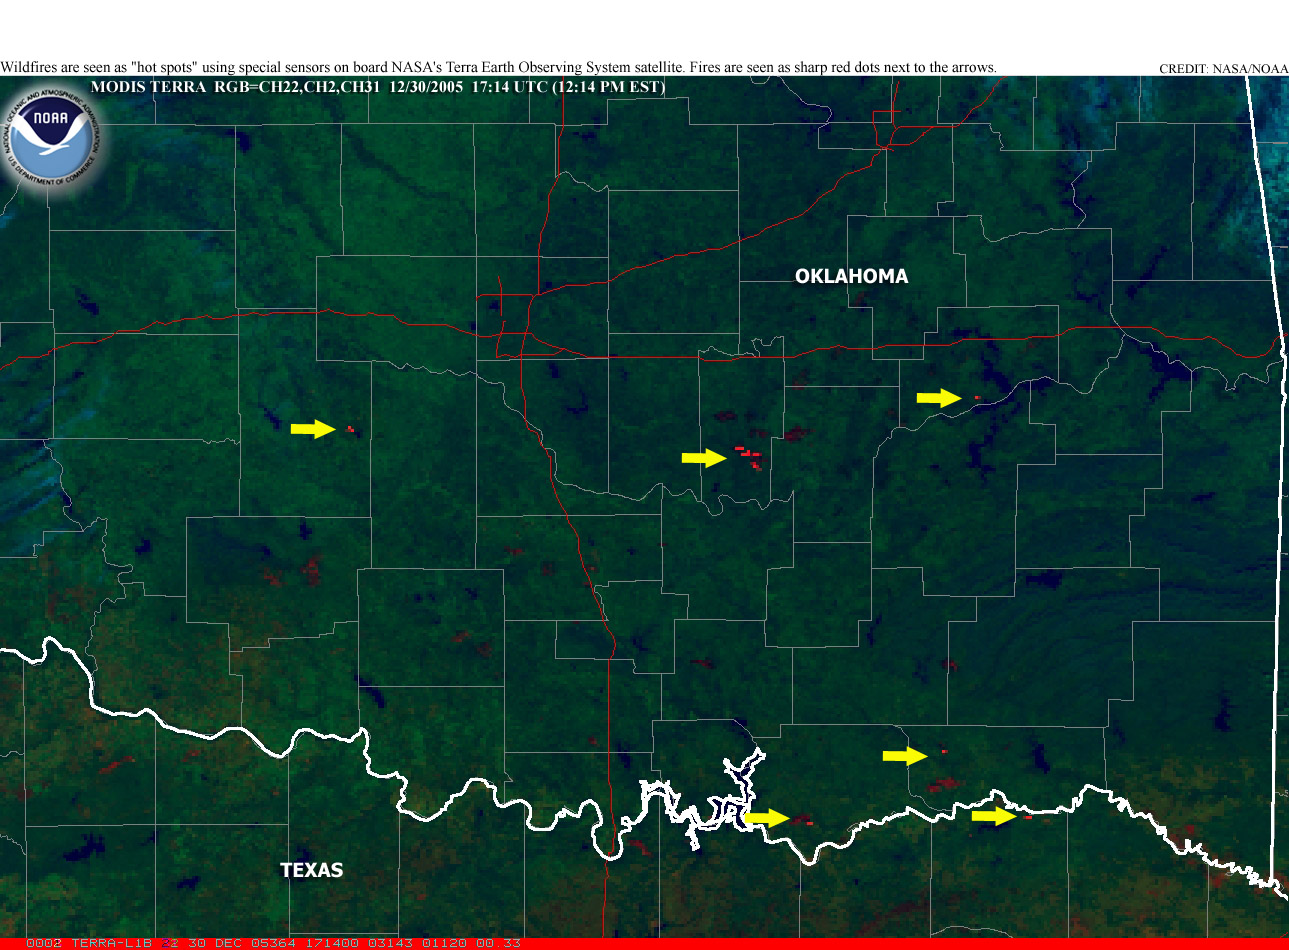
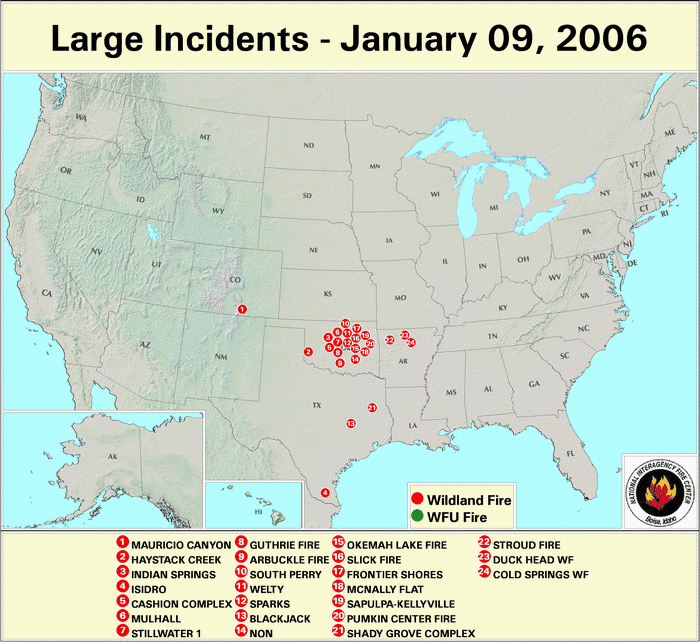
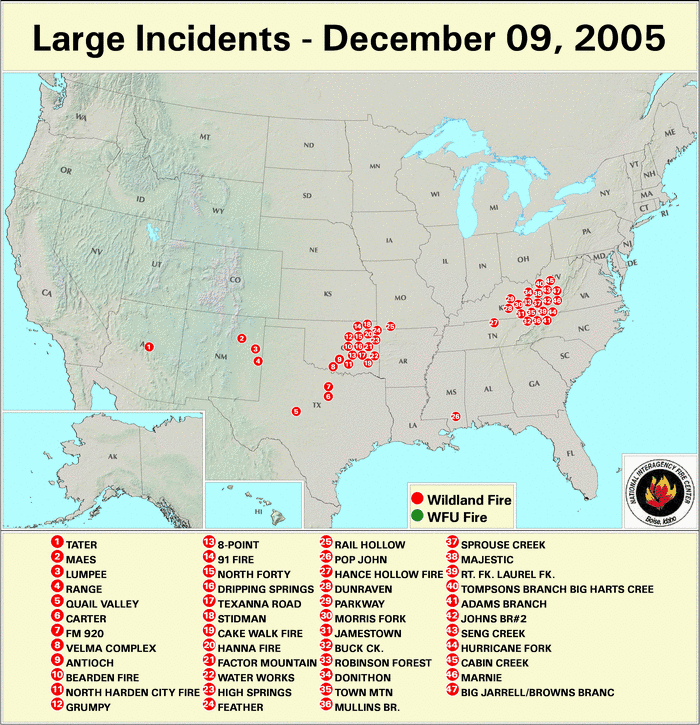
Dead fuel moisture levels across the southern and central Plains states decreased during December. In particular, fine fuel moisture levels (i.e. 10-hour fuels) decreased below 5% across parts of Texas, Oklahoma, Arizona, New Mexico and the Front Range of Colorado during the past month.
|
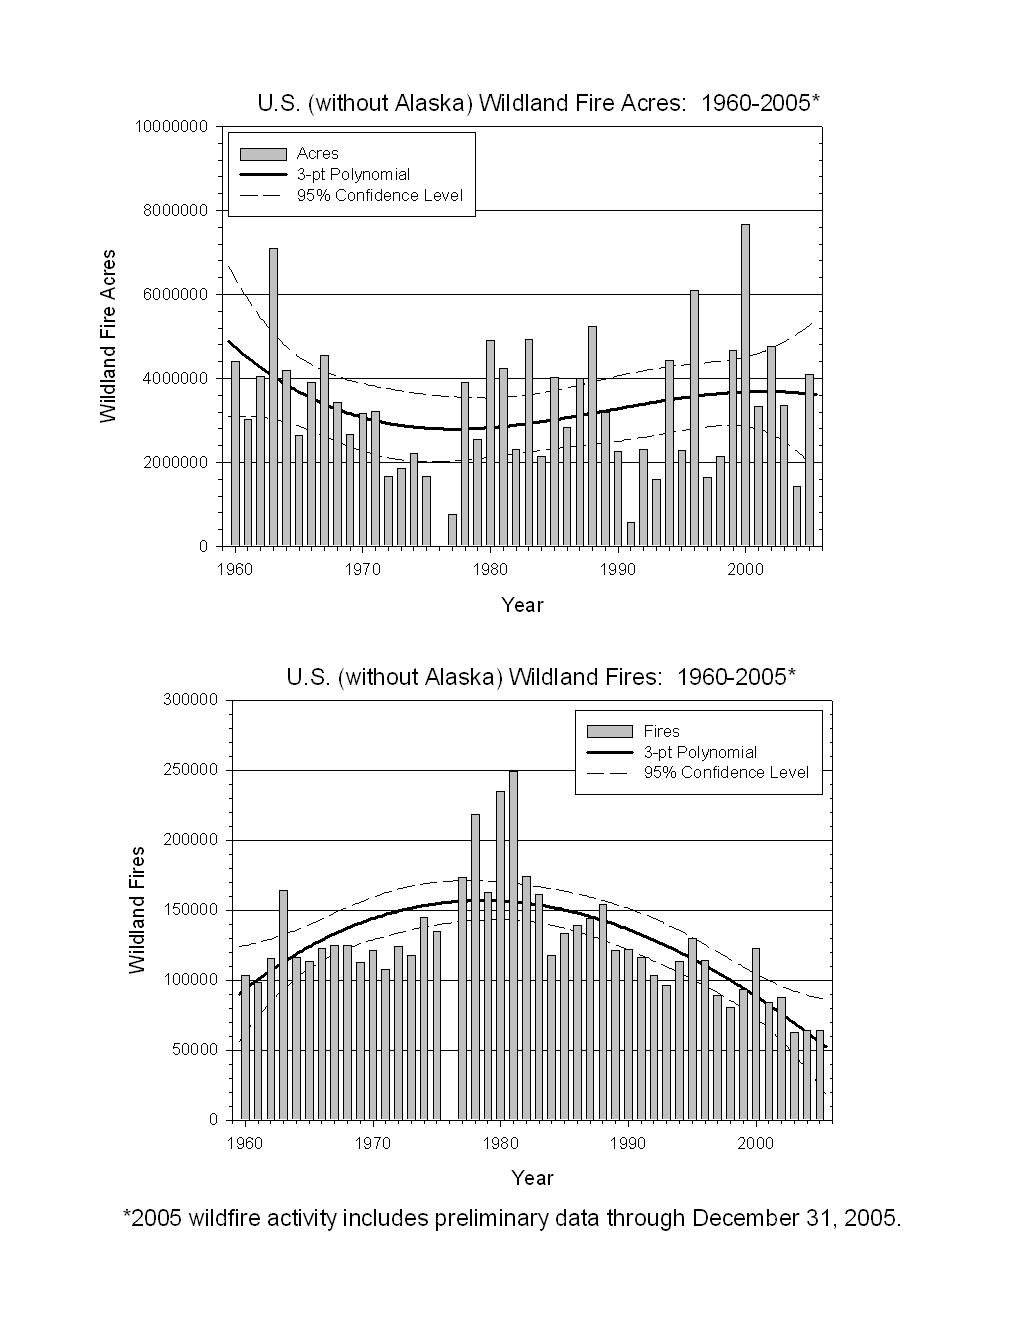
2005 Preliminary wildfire statistics (from NIFC):
  |
 November - Preliminary Season Summary
 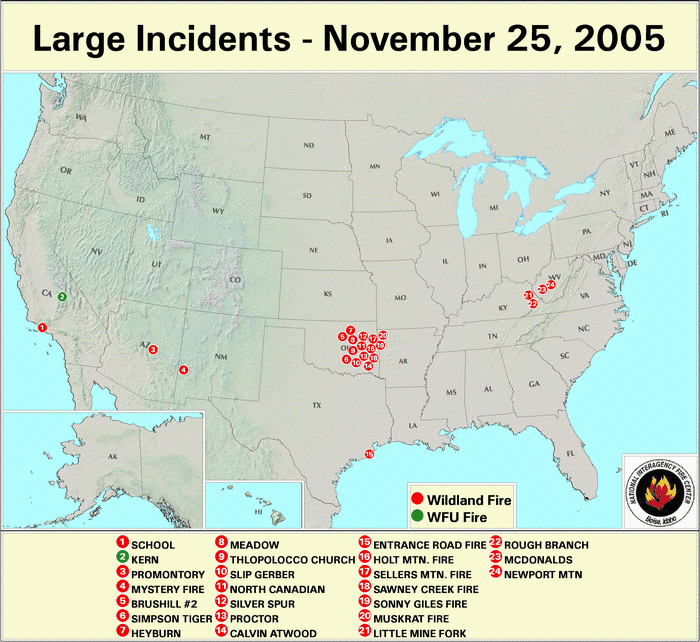 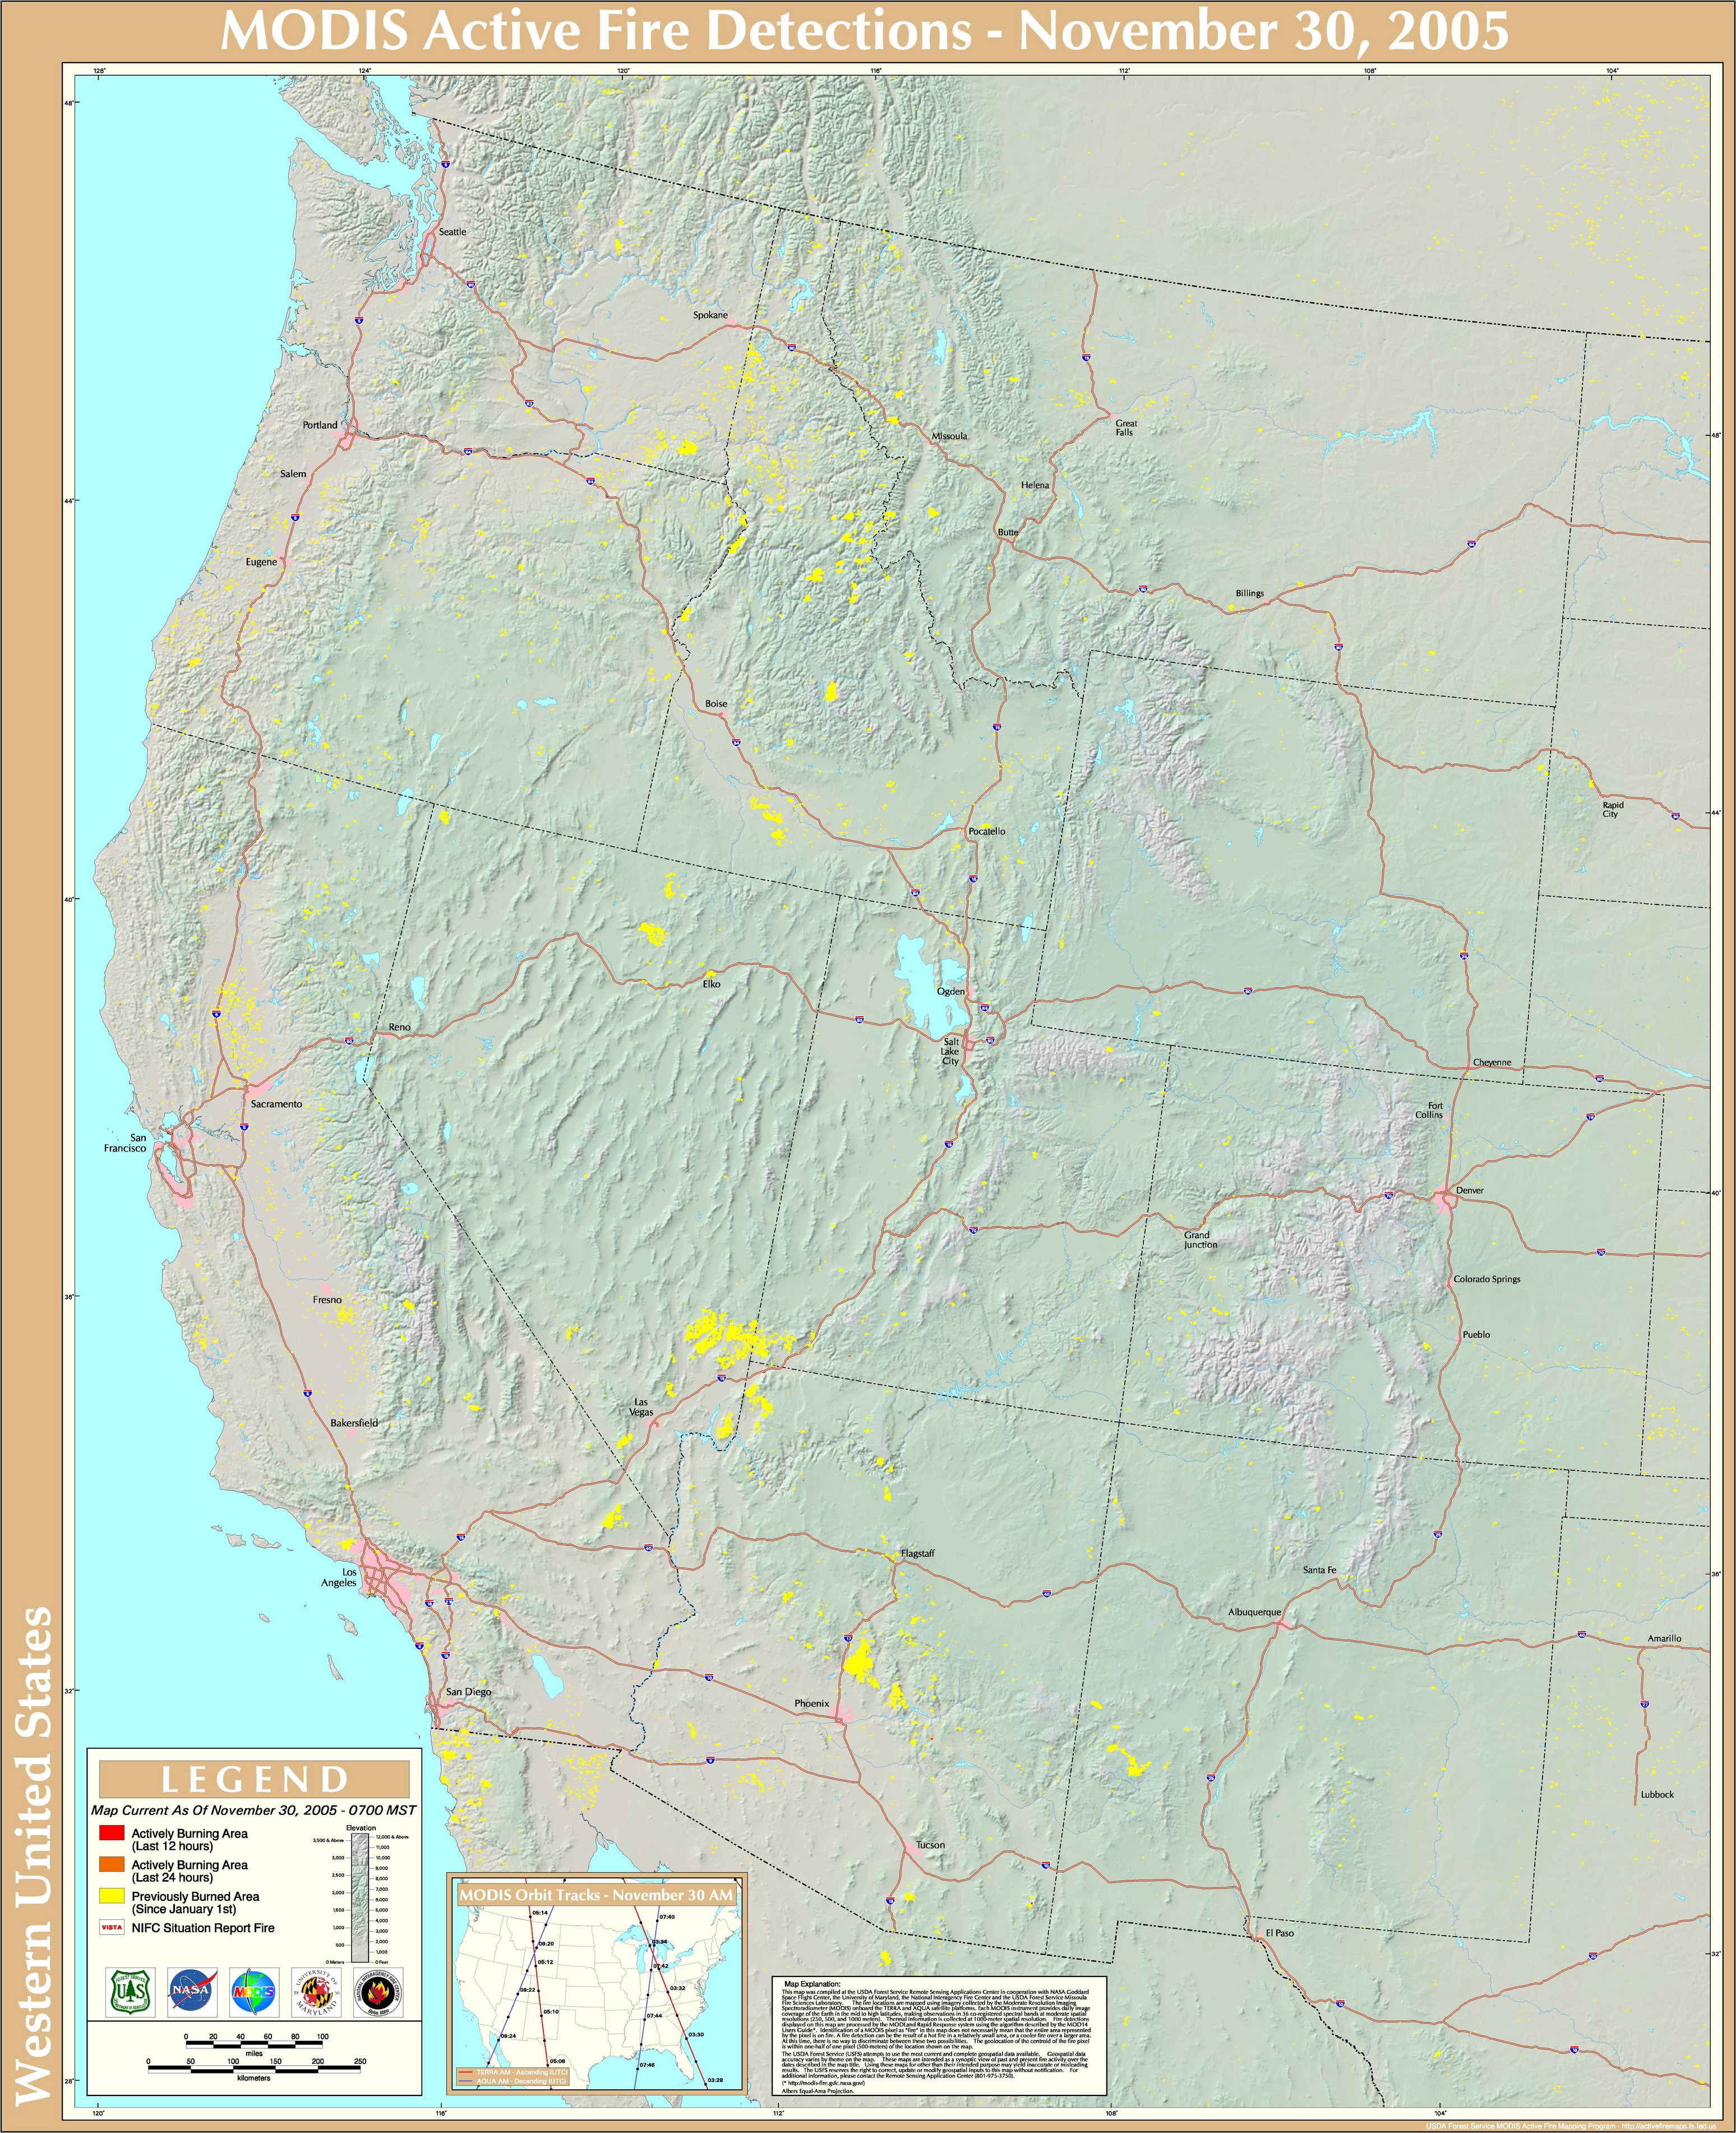 |
|
Dead fuel moisture levels across the western U.S. and High Plains slowly increased during November. In particular, fine fuel moisture levels (i.e. 10-hour fuels) increased above 10% across most western states during the past month, with the exception of the southern Plains.
|
Year-to-date wildfire statistics (from NIFC):
  |
October  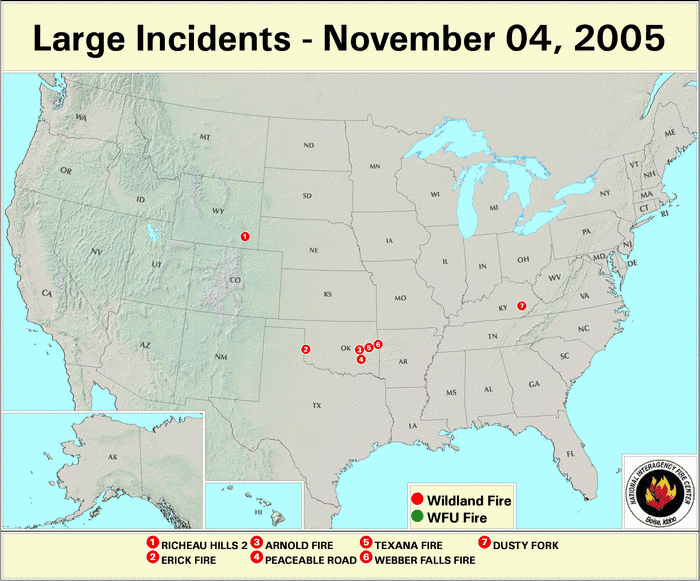  |
|
Dead fuel moisture levels across the western U.S. and High Plains were dry during October. In particular, fine fuel moisture levels (i.e. 10-hour fuels) remained below 5% across most western states during the past month, with the exception of the Pacific Northwest.
|
Year-to-date wildfire statistics (from NIFC):
  |
September  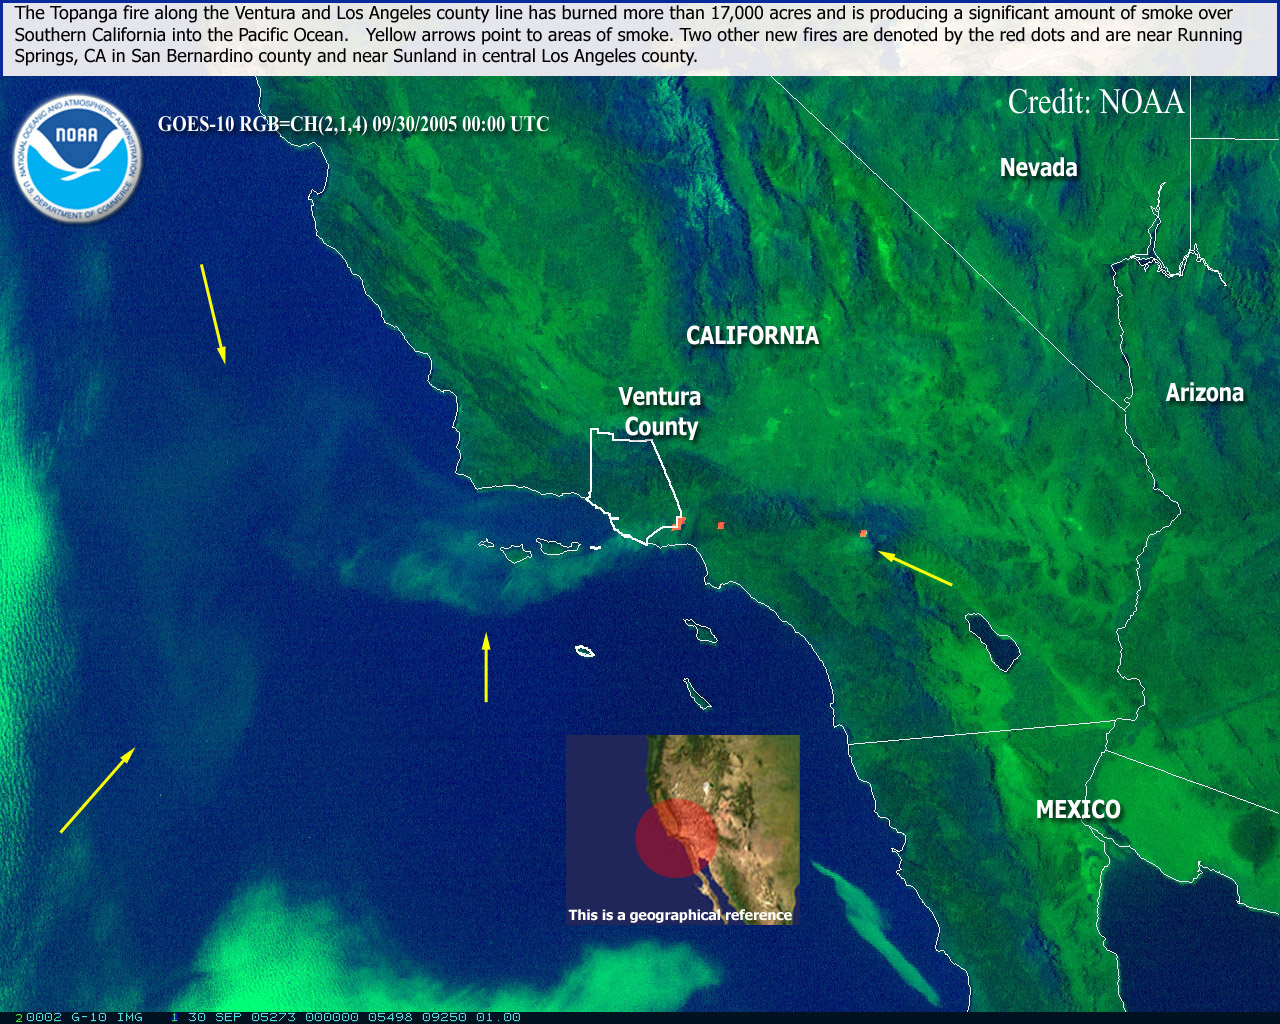 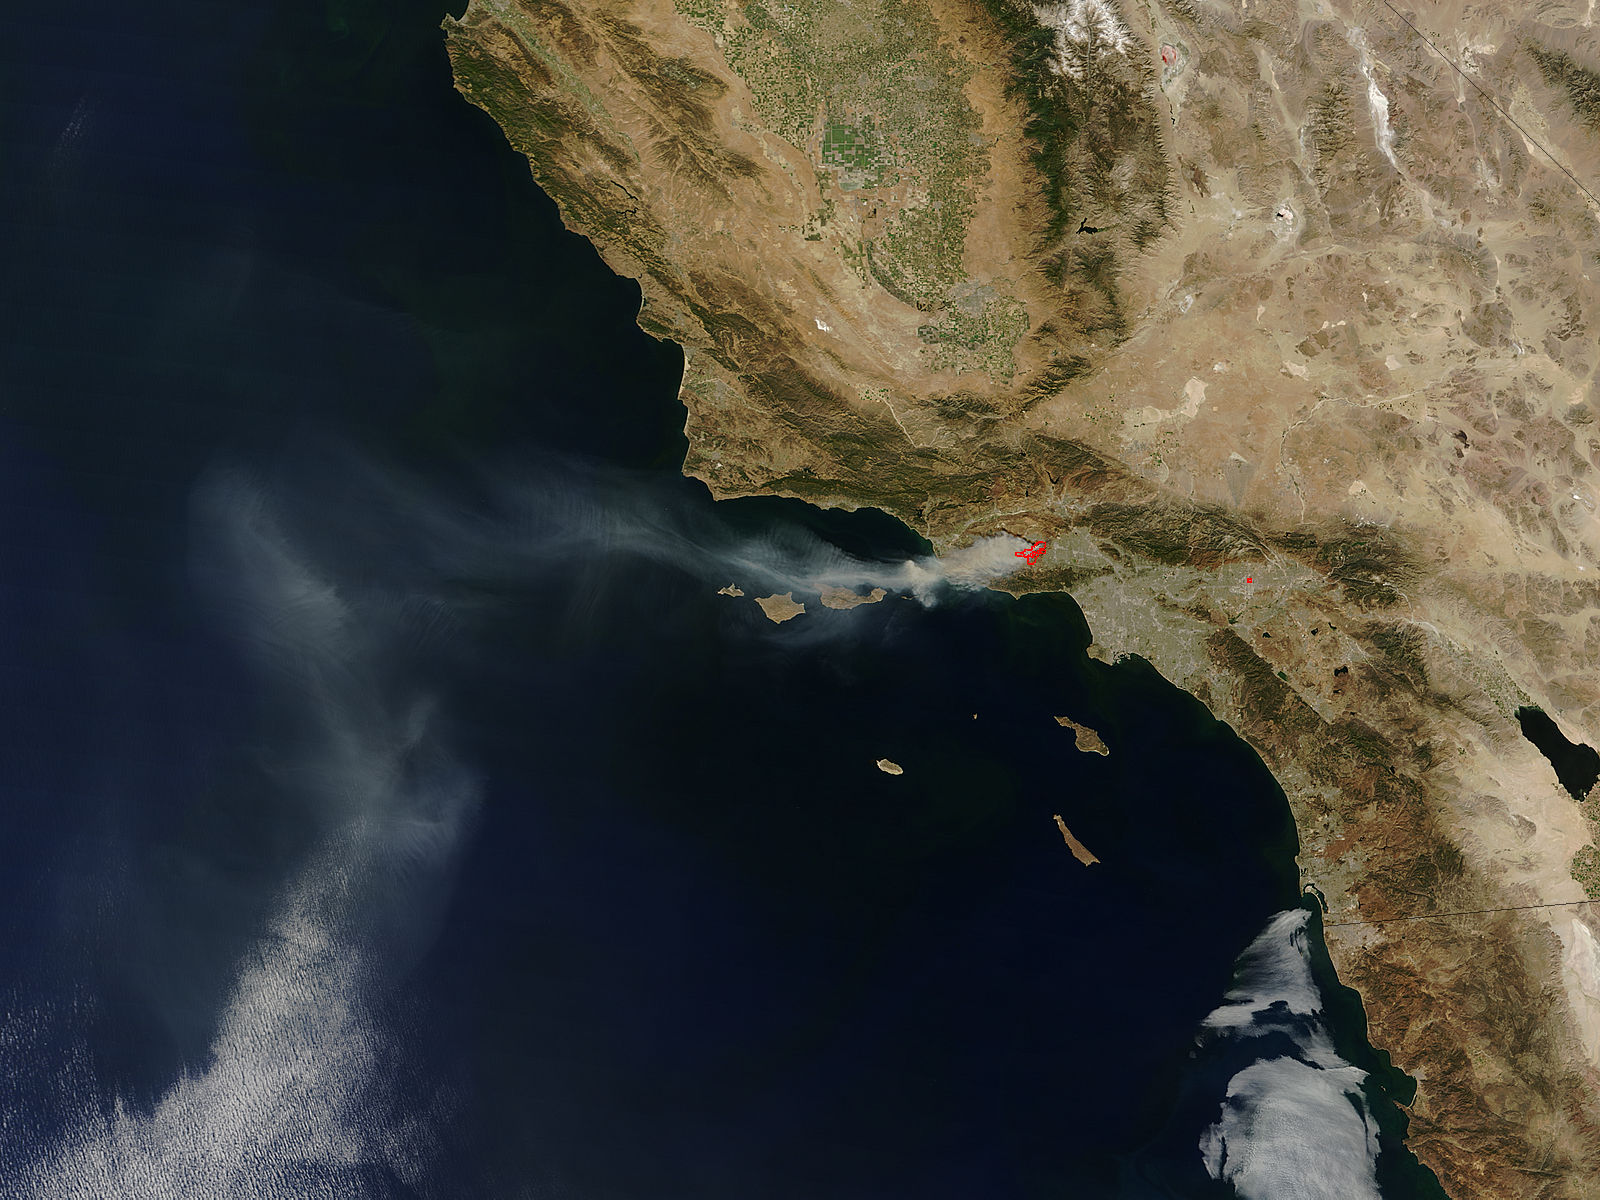 |
|
As is typical during the early fall, dead fuel moisture levels across the western U.S. and High Plains were dry during September. In particular, fine fuel moisture levels (i.e. 10-hour fuels) remained below 5% across most western states during the past month. Medium to larger fuels (i.e. the 29 September 100-hr and 29 September 1000-hr fuel moistures) were moderately dry at the end of September, especially across the Southwest and Great Basin areas.
|
Year-to-date wildfire statistics (from NIFC):
  |
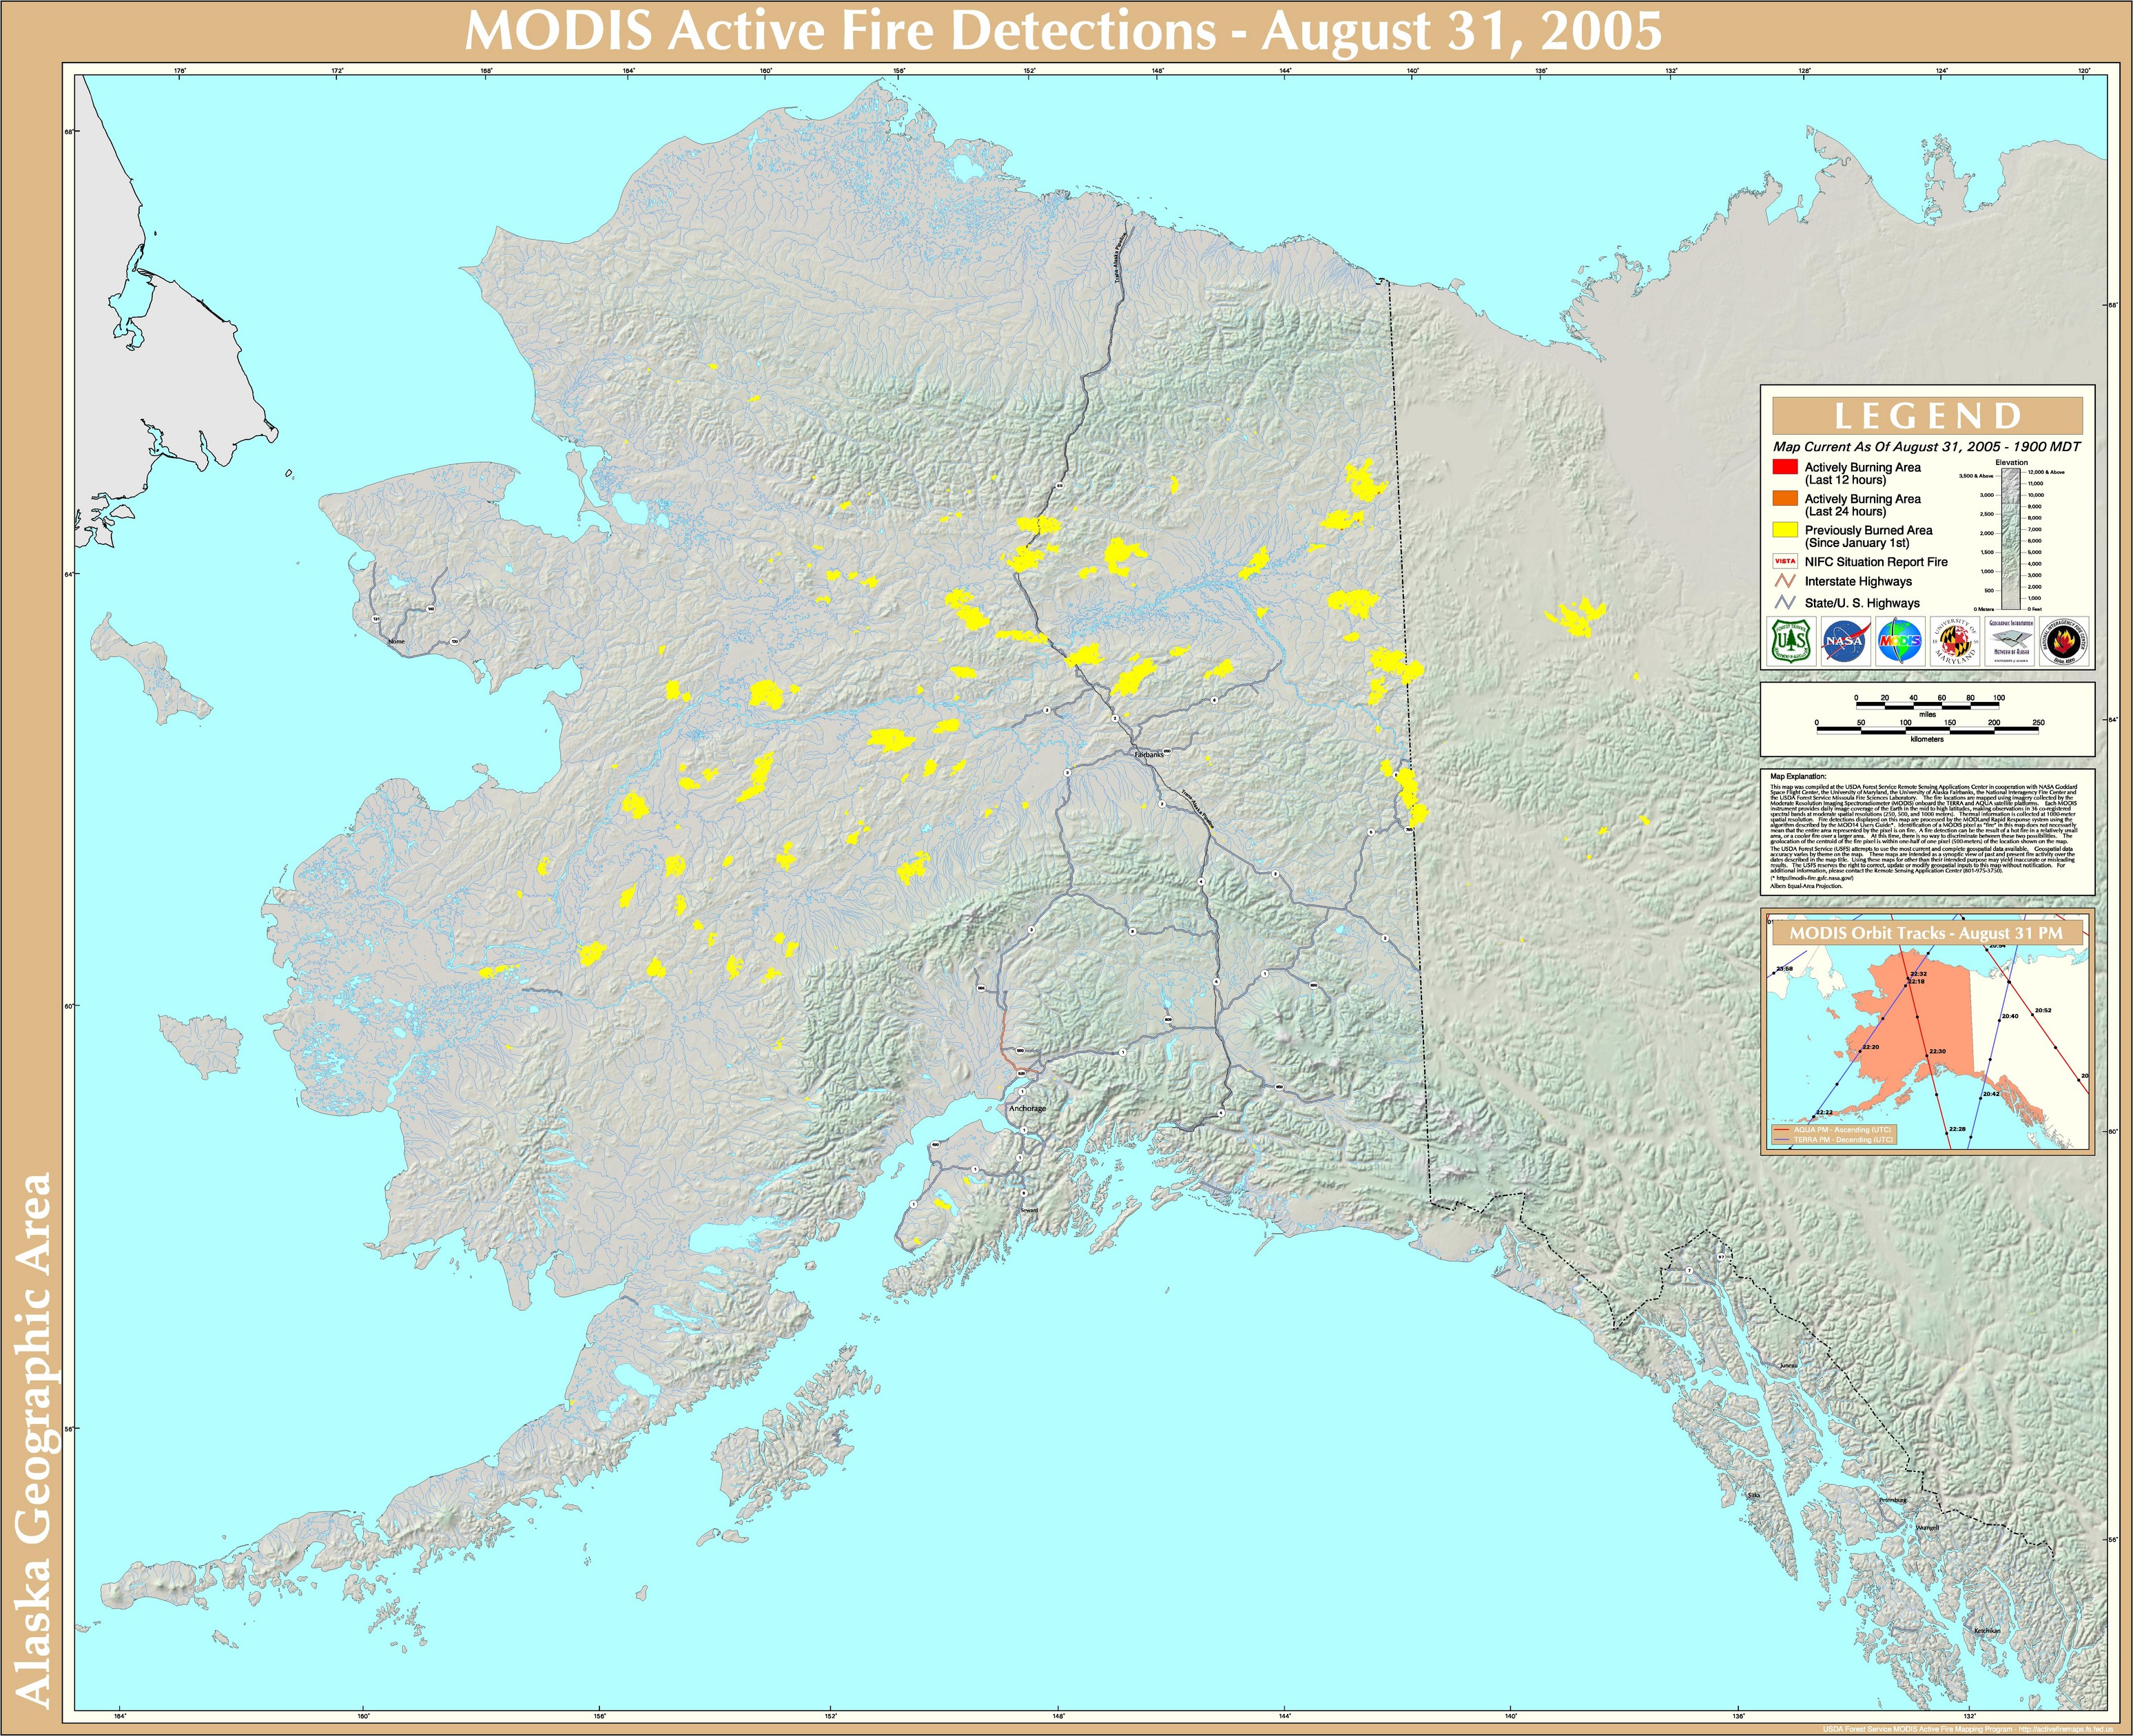
August 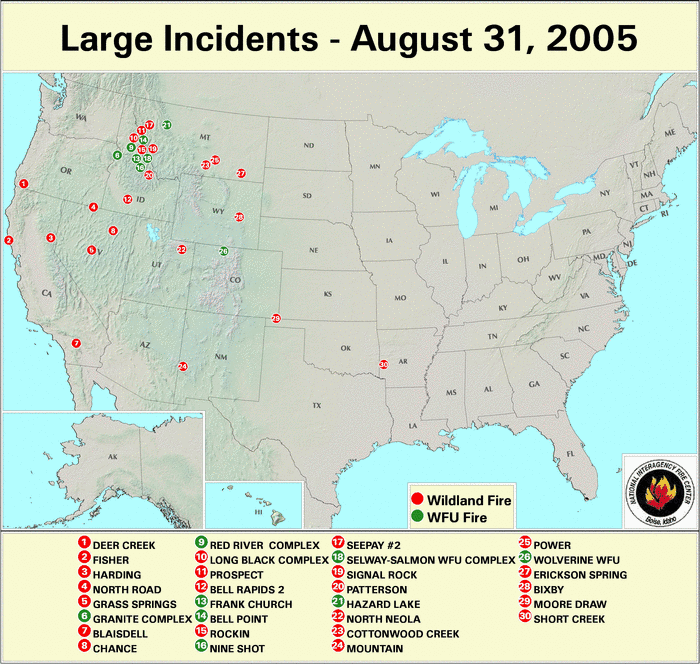   |
Wildfire activity continued across the U.S. during August, as numerous large fires burned in Alaska, the Northern Rockies, and Columbia Plateau regions. As reported by the National Interagency Fire Center, over 7.4 million acres had burned across the U.S. by the end of the month, ranking the 2005 season in the top five since 1960 for acres burned. The 2000 fire season is currently the record year for the U.S. with over 8.4 million acres burned.
|
Medium to larger fuels were also extremely dry at the end of August, especially across California, southern Idaho and the Great Basin (i.e. the August 31st 100-hr and August 31st 1000-hr fuel moistures).
|
Year-to-date wildfire statistics (from NIFC):
 |
July 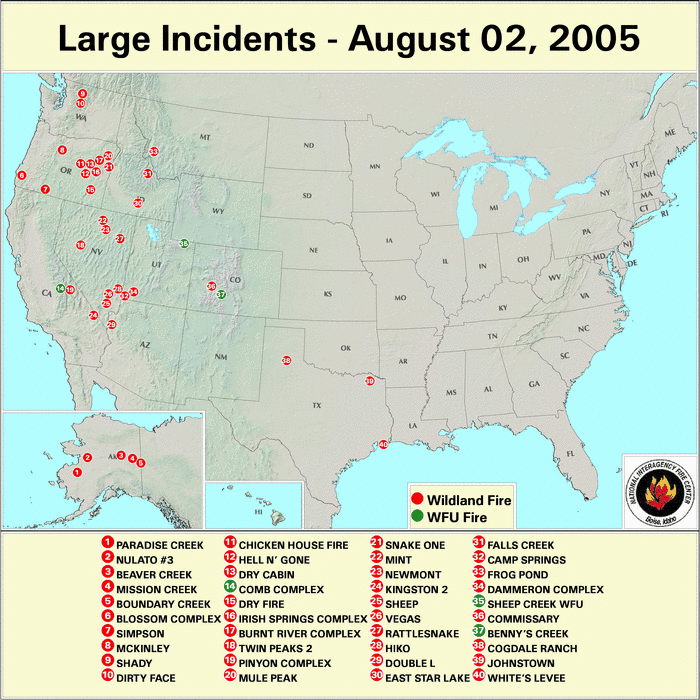  |
Fire activity spread northward across the U.S.during July, as numerous large fires developed across the Pacific Northwest, Northern Rockies, and Columbia Plateau regions. As reported by the National Interagency Fire Center, over 4.6 million acres had burned across the U.S. by the end of July. The area burned had surpassed 5 million acres as of mid-August, with activity increasing significantly along the Bitterroot Mountains of Idaho and Montana during the first half of August.
|
Medium to larger fuels dried out east of the Cascade Mountain range across the Columbia Plateau during July (i.e. the July 31st 100-hr and July 31st 1000-hr fuel moistures), with 100-hr fuels below 5% over most of eastern Washington and Oregon by the end of the month. The observed fuel moistures at the end of July were a significant change from those measured at the end of June for this region (i.e., see the June 30th 100-hr fuel moistures).
|
Year-to-date wildfire statistics (from NIFC):
 |
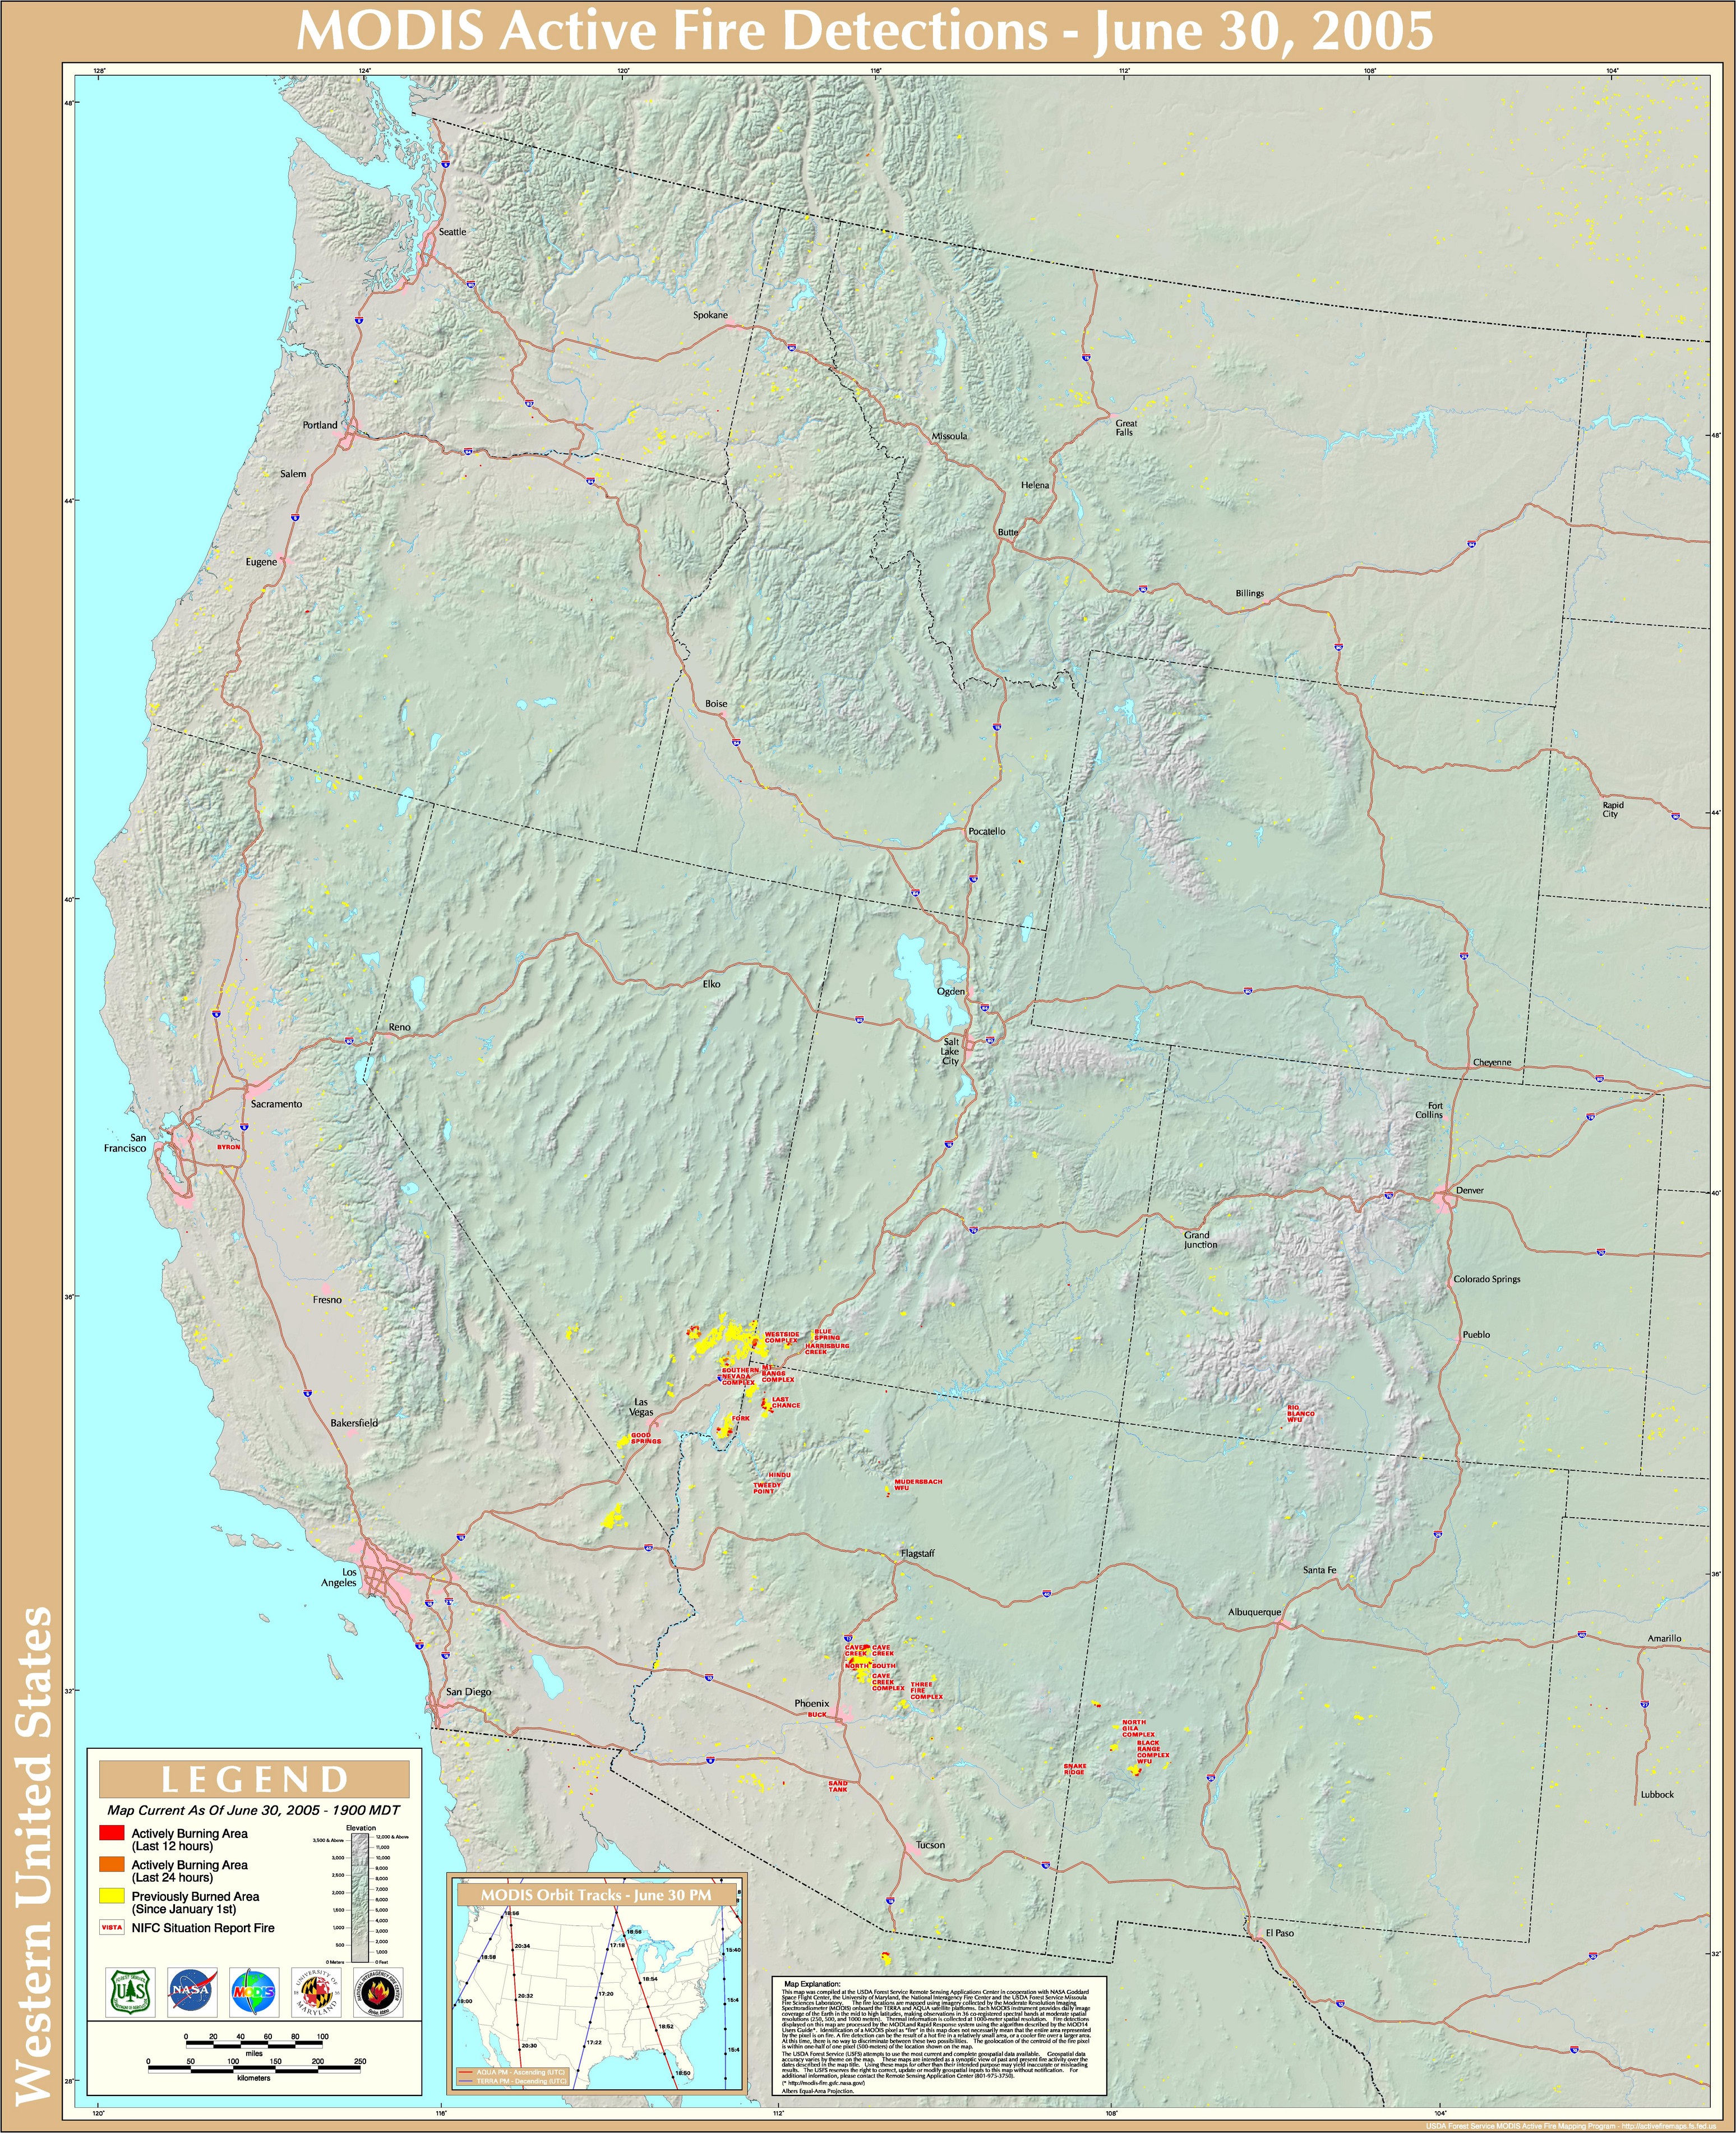
June   |
Fire activity increased dramatically during June, as numerous large fires developed across the Southwest and Great Basin regions, with activity concentrated across Arizona and Nevada. As reported by the National Interagency Fire Center, over 2.1 million acres had burned across the U.S. by the end of June. The number of acres burned had surpassed 3 million as of mid-July, with fire activity spreading eastward into New Mexico and Colorado.
|
Medium to larger fuels dried out across the region during June (i.e. the June 30th 100-hr and June 30th 1000-hr fuel moistures), with 1000-hr fuels below 10% over most of Arizona by the end of the month. The observed fuel moistures at the end of June were a dramatic change from those measured at the end of May, at which point the area of extremely dry fuels (below 5%) was confined to the lower Colorado River valley for both the medium (May 31st 100-hr) and large (May 31st 1000-hr) fuels.
|
Year-to-date wildfire statistics (from NIFC):
 |
Questions?For all climate questions other than questions concerning this report, please contact the National Climatic Data Center's Climate Services Division:
| Climate Services Division NOAA/National Climatic Data Center 151 Patton Avenue Asheville, NC 28801-5001 fax: 828-271-4876 phone: 828-271-4800 email: questions@ncdc.noaa.gov |
|
David Levinson NOAA/National Climatic Data Center 151 Patton Avenue Asheville, NC 28801-5001 fax: 828-271-4328 email: David.Levinson@noaa.gov |
|
Jay Lawrimore NOAA/National Climatic Data Center 151 Patton Avenue Asheville, NC 28801-5001 fax: 828-271-4328 email: Jay.Lawrimore@noaa.gov |


