|
|
Charts from the American Time Use Survey
About the Charts
The American Time Use Survey collects information about the
activities people do during the day and how much time they spend
doing them. For example, on an average day in 2006, Americans age 15
and over slept about 8.6 hours, spent 5.1 hours doing leisure and
sports activities, worked for 3.8 hours, and spent 1.8 hours doing
household activities. The remaining 4.7 hours were spent in a
variety of other activities, including eating and drinking,
attending school, and shopping.
[Chart in PDF]
[Chart data—TXT]
|
|
|
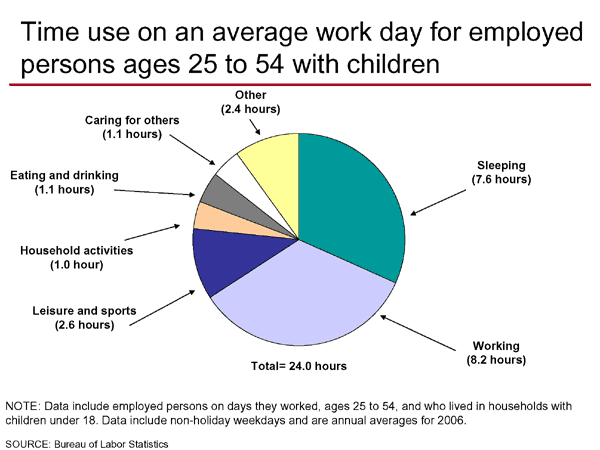
If this "average day" does not sound like a typical day in your
household, it is because these numbers are for all persons in the
U.S. age 15 and over, and for all days of the week combined. The
information can be further analyzed by age, sex, employment status,
day of the week, or presence and age of household children. Looking
at information for certain groups in the population provides a more
accurate picture of how each group spends its time. For example, the
chart above shows how employed persons ages 25 to 54, who live in
households with children under 18, spent their time on an average workday.
These individuals spent an average of 8.2 hours working, 7.6 hours
sleeping, 2.6 hours doing leisure and sports activities, and 1.1
hours caring for others, including children.
The following charts provide a snapshot of how people use their
time. These lists are not exclusive—they only contain some of the
most interesting or commonly cited statistics from the survey.
|
|
List of ATUS charts
Older
Americans
- Leisure time of individuals age 65 and over: employed vs. not
employed (PDF) (TXT)
- Hours per day that individuals age 55 and over spent doing
selected activities (PDF) (TXT)
- Hours per day of waking, non-work time that individuals age 65
and over spent with others (PDF) (TXT)
Students
- Time use on an average weekday for full-time university and
college students (PDF) (TXT)
- Percent of university and college students who did educational
activities, by hour of day on weekdays (PDF) (TXT)
- Average hours per weekday spent by high school students in
various activities (PDF) (TXT)
Care of
household children (by adults living in households with
children)
- Weekday time use of married women living with young children,
by employment status (PDF) (TXT)
Household
activities
- Average hours per day men and women spent in various
activities (PDF) (TXT)
- Percent of population who did household activities on an
average day (PDF) (TXT)
Leisure and
sports activities
- Leisure time on an average day (PDF) (TXT)
- Average hours spent per day in leisure and sports activities,
by youngest and oldest populations (PDF) (TXT)
Sleep
- Average sleep times per day, by age and sex (PDF) (TXT)
Volunteer activities
- Percent of population who volunteered on an average day, by age (PDF) (TXT)
- Percent of population who volunteered on each day of the week (PDF) (TXT)
- Percent of persons who volunteered that did selected volunteer activities on an average day (PDF) (TXT)
- Percent of population who volunteered and hours spent volunteering, by educational attainment (PDF) (TXT)
- Percent of persons who volunteered, by presence and age of youngest child (PDF) (TXT)
Work and
employment
- Time use on an average work day for employed persons ages 25
to 54 with children (PDF) (TXT)
- Percent of population who worked on weekdays and weekend days
(PDF) (TXT)
- Percent of employed persons who worked at home on an average
workday (PDF) (TXT)
- Percent of employed persons who worked at home on an average
workday, by education level (PDF) (TXT)
- Percent of employed persons who did selected activities on
workdays by hour of the day (PDF) (TXT)
|
 Back to
Top Back to
Top |
Other resources for finding ATUS data
Visual essays and data spotlights:
ATUS news releases:
-
NEW Married Parents' Use of Time, 2003-06 (HTML) (PDF)
NEW ATUS tables:
- Table A-1. Time spent in detailed primary activities, and percent of the civilian population engaging in each detailed primary activity category, averages per day by sex (PDFs) (2007) (2006)
- Table A-2. Time spent in detailed primary activities, and percent of the civilian population engaging in each detailed primary activity category, averages per day on weekdays and weekends (PDFs) (2007) (2006)
Unpublished tables of time-use estimates by age, ethnicity, employment status, educational attainment, marital status, presence and age of household children, and other categories are available upon request by e-mailing the ATUS staff.
BLS papers and
publications
American Time Use Survey (ATUS) Early Results Conference
|
Back to
Top |
Last Modified Date: June 25, 2008
|