Charts by Topic: Older Americans
[Chart in PDF]
[Chart data—TXT]
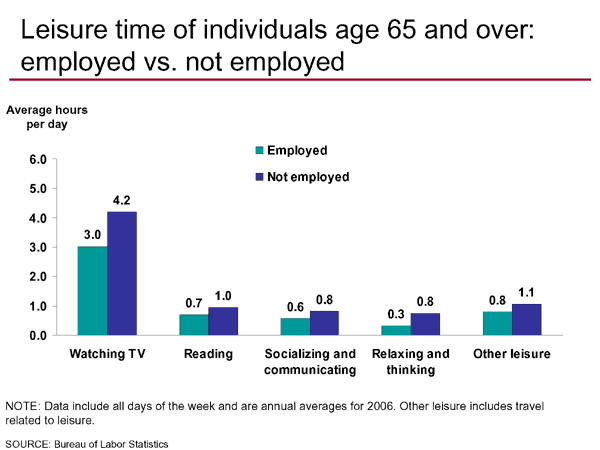
- Employed individuals age 65 and over spent 2.5 fewer hours on
average engaged in leisure time than those who were not employed. Those
who were not employed spent most of their additional leisure time
watching TV (1.2 hours) and relaxing and thinking (0.5 hour). (Data are from the 2006
survey).
[Chart in PDF]
[Chart data—TXT]
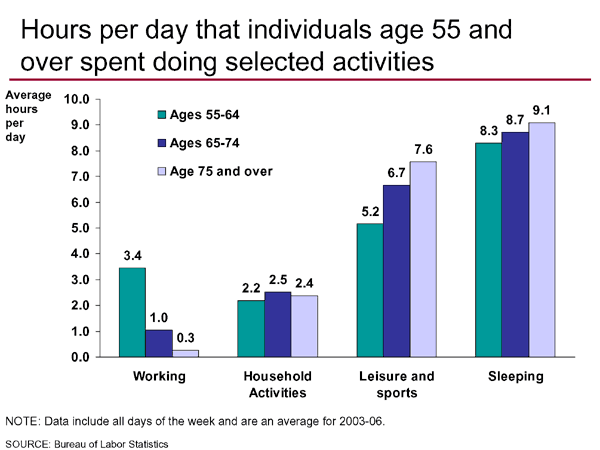
- For Americans age 55 and over, average time spent working decreased
with age, while leisure and sleep time increased. Individuals ages 55 to
64 spent 3.1 more hours working than individuals age 75 and over. Those
age 75 and over spent 2.4 more hours in leisure and 0.8 more hour
sleeping than those ages 55 to 64. (These data are four-year averages
for 2003 to 2006).
[Chart in PDF]
[Chart data—TXT]
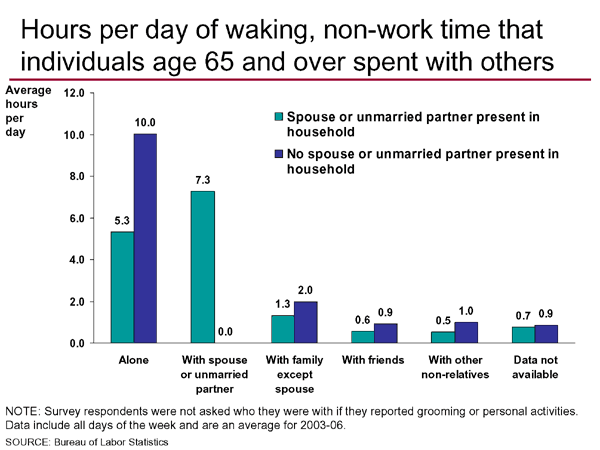
- Individuals age 65 and over who did not live with a spouse or
unmarried partner spent 10.0 hours of their waking non-work time alone,
compared to 5.3 hours for those who lived with a spouse or unmarried
partner. Those who did not live with a spouse or unmarried partner spent
more time with other family members (0.7 hour), friends (0.3 hour), and other non-relatives (0.5 hour)
than those who lived with a spouse or unmarried partner. (These data are
four-year averages for 2003 to 2006).
Last Modified Date: August 28, 2007
|