|
Fires
|
|
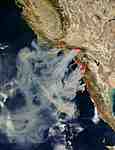
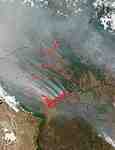
 Fire managers can access daily
maps showing the locations of active fires in the conterminous United
States and Alaska. The United States Forest Service's Remote Sensing
Applications Center produces daily regional fire maps based on MODIS
Rapid Response Data. The maps are distributed through the National
Interagency Fire Center, which coordinates all the national and regional
fire agencies across the United States. The maps are used to allocate
firefighting resources during the fire season. The Rapid Response staff
also supplies the Forest Service with science software to generate rapid
fire products from the MODIS data collected regionally by their Direct
Broadcast antenna.
Fire managers can access daily
maps showing the locations of active fires in the conterminous United
States and Alaska. The United States Forest Service's Remote Sensing
Applications Center produces daily regional fire maps based on MODIS
Rapid Response Data. The maps are distributed through the National
Interagency Fire Center, which coordinates all the national and regional
fire agencies across the United States. The maps are used to allocate
firefighting resources during the fire season. The Rapid Response staff
also supplies the Forest Service with science software to generate rapid
fire products from the MODIS data collected regionally by their Direct
Broadcast antenna.
The Remote Sensing Applications Center also provides maps of recently
burned areas to the Burn Area Emergency Response (BAER) program, a
program within the United States Department of Agriculture Forest Service.
BAER uses MODIS imagery and fire maps to determine the extent to fire
damage in planning to restore fire damaged areas.
The Web Fire Mapper at the University of Maryland provides access to
current and archived fire locations detected by the MODIS Rapid Response
System through an interactive ArcIMS interface with an extensive database of
region-specific layers and ancillary information. The Global
Observation of Forest and Land Cover Dynamics (GOFC-GOLD) user
community can access MODIS Rapid Response fire location data to make fire
maps of any region of interest in the world. Many international science
and natural resources management groups access MODIS fire data through
GOFC-GOLD. The UN Global Fire Monitoring Center also provides
MODIS-based fire data for the international fire community.
SIAM-SERVIR, the Mesoamerican Monitoring and
Visualization System is an online data archive and distribution system for
free satellite imagery of Mesoamerica designed to educate people about
regional ecological issues and provide decision support tools. The MODIS
Rapid Response Team provides daily images of Central America during the
dry fire season to support personnel involved in environmental monitoring
and disaster management. The fire images are available here. The MODIS Rapid Response System has been
instrumental in developing a fire alert system used by Eskom, the South
African power company, and Conservation International. Fire was cutting into
the South African power company’s ability to operate. In an average
year, more fires burn in Sub-Saharan Africa than any other part of the world,
and some of these fires caused power outages. Fires burning near transmission
lines can cause outages when f lames ionize the air around the lines, breaking
down the normal isolating properties of air. These conditions cause power
arcs or surges on the lines, and the transmission protection system shuts down
momentarily and recloses the breakers to restore the power. The result is a
fluctuation in power that causes havoc in electronic equipment and certain
manufacturing plants. Power outages also occur when air pollution rising from
the fires pollutes the system’s insulators. When the polluted insulators
get wet in fog or light rain, short circuits and the same fluctuations in
power occur. Approximately 20 percent of the outages experienced in South
Africa in any given year could be blamed on fires. So when the South African
government bought a direct broadcast station through which they could receive
MODIS data the moment the satellites passed overhead, Eskom was quick to set
up a fire early warning system. In cooperation with NASA, the University of
Maryland, and the Council for Scientific and Industrial Research (CSIR), Eskom
installed the MODIS Rapid Response System software to help them get fire
locations from the data quickly. The system worked, but not everyone who
needed the alerts had easy, rapid access to the Internet. The University of
Maryland and Eskom developed an alert system that works on cell phone text
messages. When MODIS detects a fire, the system automatically sends a text
message to both the National Control Manager and the manager of the region in
which the fire was detected. The National Control manager can then reroute
power away from the affected region to prevent an outage, and the regional
manager can send crews out to fight the fire. In 2005, more than 6,147 fires
were detected in Eskom right-of-ways, and at least 15 fire-related outages
were prevented in one region alone. With the success of the alert system
in South Africa, the University of Maryland set out to expand the system for
other land managers worldwide. After getting fire locations from MODIS Rapid
Response, the University of Maryland sends an email and text message alert
with the fire location to land managers and governments responsible for
fragile ecosystems, parks, reserves, and other protected land. The fire
locations are also available online from the Web Fire Mapper. As the system
develops, daily MODIS images of the protected regions will be generated by the
MODIS Rapid Response Team. The images will allow decision makers to see the
extent of the burn, which helps remediation planning. The alert system is
being developed in collaboration with Conservation International.
|
|
|
Floods
|
|
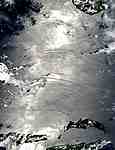
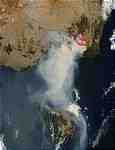
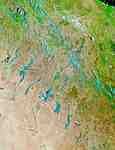 A false-color MODIS image taken on January 18, 2004, left, shows flooding in
Australia. The Dartmouth Flood Observatory used this image and others
collected during the flood period create a map showing the
extent of the flooding. The Flood
Observatory uses MODIS to observe known floods around the world,
and, on a limited basis, detect new floods. The maps they generate are
available to governments and relief organizations. For flood detection,
the Flood Observatory has defined at least 710 sections of rivers
worldwide. Each section is 20 to 30 kilometers in length and 20 to 30
kilometers in width. MODIS monitors the sections, called reaches, to
determine the status of each. When water levels rise to flood status, the
river can be targeted by higher-resolution sensors.
A false-color MODIS image taken on January 18, 2004, left, shows flooding in
Australia. The Dartmouth Flood Observatory used this image and others
collected during the flood period create a map showing the
extent of the flooding. The Flood
Observatory uses MODIS to observe known floods around the world,
and, on a limited basis, detect new floods. The maps they generate are
available to governments and relief organizations. For flood detection,
the Flood Observatory has defined at least 710 sections of rivers
worldwide. Each section is 20 to 30 kilometers in length and 20 to 30
kilometers in width. MODIS monitors the sections, called reaches, to
determine the status of each. When water levels rise to flood status, the
river can be targeted by higher-resolution sensors.
The Dartmouth Flood Observatory also compiles yearly catalogs, maps,
and images of river floods from 1985 to the present, primarily for
researchers. The Observatory publishes a comprehensive Atlas
of Global Flood Hazard online that illustrates the complete history of
river flooding as observed by MODIS since launch. The Atlas is being used
by the international insurance industry and by national and local
government for assistance in determining flood hazard.
|
|
|
Land
|
|
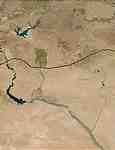 The U.S. Department of Agriculture's Foreign Agricultural Service (FAS) is
using MODIS satellite data to estimate the predicted yield of crops. MODIS
provides daily, high-quality, photo-like images that can be used to
observe large areas across the world. These images help FAS improve the
accuracy and timeliness of the crop yield predictions, which are needed to
make decisions affecting U.S. agriculture, trade policy, and food
aid. MODIS products allow FAS analysts to distinguish between different
crops
like wheat and rice and permit analysts to measure other features like
surface temperature and snow cover. Analysts can gauge the overall health
of agriculture by comparing current data with previous years. MODIS
products, first used by FAS in the summer of 2003, demonstrated their
utility by helping analysts identify new areas of irrigated agriculture in
the Middle East. On August 24, 2003, only the irrigated land was still
green in the MODIS image on the left.
MODIS collects data twice daily, from the Terra satellite in the morning
and the Aqua satellite in the afternoon, which helps analysts observe how
events such as fires, volcanic eruptions, floods, storms, or extreme
temperatures affect crops. The MODIS Rapid Response System processes and
delivers MODIS data to the USDA within three to four hours after it is
acquired. FAS posts the data in the Crop
Explorer. University of Maryland also provides USDA crop analysts with a
web interface for analyzing MODIS temporal composites of vegetation index
data.
The U.S. Department of Agriculture's Foreign Agricultural Service (FAS) is
using MODIS satellite data to estimate the predicted yield of crops. MODIS
provides daily, high-quality, photo-like images that can be used to
observe large areas across the world. These images help FAS improve the
accuracy and timeliness of the crop yield predictions, which are needed to
make decisions affecting U.S. agriculture, trade policy, and food
aid. MODIS products allow FAS analysts to distinguish between different
crops
like wheat and rice and permit analysts to measure other features like
surface temperature and snow cover. Analysts can gauge the overall health
of agriculture by comparing current data with previous years. MODIS
products, first used by FAS in the summer of 2003, demonstrated their
utility by helping analysts identify new areas of irrigated agriculture in
the Middle East. On August 24, 2003, only the irrigated land was still
green in the MODIS image on the left.
MODIS collects data twice daily, from the Terra satellite in the morning
and the Aqua satellite in the afternoon, which helps analysts observe how
events such as fires, volcanic eruptions, floods, storms, or extreme
temperatures affect crops. The MODIS Rapid Response System processes and
delivers MODIS data to the USDA within three to four hours after it is
acquired. FAS posts the data in the Crop
Explorer. University of Maryland also provides USDA crop analysts with a
web interface for analyzing MODIS temporal composites of vegetation index
data.
|
|
|
Oceans
|
|
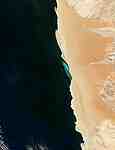
Oceanspace at the University of Cape Town, South Africa,
relies on satellite data to monitor ocean resources in South Africa for decision makers and
scientists. Specifically, Dr. Scarla Weeks uses MODIS Rapid Response images to detect plumes of sulfur off the coast of Namibia. Anaerobic bacteria on
the ocean floor produce hydrogen sulfide gas. When the gas reaches the surface, it reacts with oxygen in the upper layers of the ocean producing pure
sulfur. The sulfur is visible in MODIS imagery as green plumes in the ocean. Hydrogen sulfide gas is highly toxic to fish, and large die-offs often
accompany hydrogen sulfide upwelling.
In images where the sun reflects off the surface of the ocean, MODIS
can detect the presence of internal waves. Chris Jackson of Global Ocean
Associates has been using MODIS data to help compile An Atlas of
Internal Solitary-like Waves and
Their Properties. The work, which is sponsored by the Office of Naval Research, has relied on MODIS and other satellite images to map the
occurrence of internal waves around the world. As the name implies,
internal waves are waves that travel in the interior of the ocean. They move through regions of the ocean where the
water density changes sharply in the same way surface waves travel along the interface between the dense ocean and the less dense atmosphere. The
internal waves are generated when the tide pulls the boundary between the lower, dense layer of the ocean and the lighter surface water over an obstacle
such as a sill, bank, or the edge of the continental shelf. The wave forms as the boundary moves to return to its former position. Internal waves manifest themselves on the sea surface in alternating bands of rough and smooth water, which appear as light and dark strips
in MODIS sunglint images. The strips can be tens to hundreds of kilometers in length and persist on the surface for several days as the internal waves
move through the ocean. Internal waves are found mainly on the continental shelves and happen wherever strong tides and stratification occur near irregular
topography. Internal waves "stir" the ocean, changing the temperature and salinity of different layers and the way nutrients and other objects in the
water are distributed and carried. This affects marine productivity, pollutant dispersal, and ultimately, the entire local marine environment.
|
| |
|
Outreach
|

|
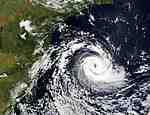
Because the MODIS Rapid Response System can create an
image of an event such as a major fire the same day it happens, the images are ideal for news and
outreach. The MODIS Rapid Response System provides regular images of storms, fires, and other events as they happen to the NASA Public Affairs Office
and the media. MODIS Rapid Response images have been featured in major newspaper and television networks across the world. NASA's Earth Observatory web site posts regular MODIS images of significant events around the
world in the Natural Hazards section and as Image of the Day. MODIS Rapid Response images have also appeared on the NASA portal, the Goddard home page, and on Goddard TV. MODIS Rapid Response images are also displayed on NASA's Visible Earth.
The American Museum of Natural History incorporates MODIS Rapid Response images into a regularly
updated exhibit about the Earth called Science Bulletins. Displayed on interactive kiosks and on high-definition video, the Science Bulletins provide a way for museums to exhibit stories and information about
current science, and are intended to show that science is dynamic with new discoveries being made constantly. There are three Science Bulletins: Astro Bulletin, which is about astrophysics and astronomy, Bio Bulletin, about biodiversity and conservation, and Earth Bulletin, about Earth and climate. In addition to being displayed at the
American Museum of Natural History, the Bulletins are also made available for display to other science museums, universities, and NASA visitor centers
around the United States and Canada. Currently, 21 institutions are participating. The American Museum of Natural History is developing the Bulletins
online to give more people access to the Bulletins. The Bulletin sites offer additional information, not available in the exhibits, as well as an
archive of past Bulletins. The museum is also developing an educational component to the site so that teachers can use the Science Bulletins in the
classroom starting in 2005.
|
| |
|
Air Quality
|
|
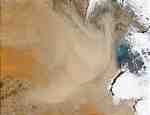 The United States Air Force Weather Agency and the U.S. Naval Research Laboratory have relied on MODIS Rapid Response images to monitor and predict
dust storms in the Middle East and Southwest Asia. Dust storms, such as the one blowing over Kuwait and Iraq in this MODIS image from April 16, 2003,
can interfere with troop and equipment movement and with aircraft safety.
The military is also given access to near-real-time imagery from other
areas in the world where weather conditions, snow cover, smoke, fires,
volcanic eruptions, and other things could impact military operations. The
United States Environmental Protection Agency and the U.S. Naval Research Laboratory monitor for smoke that
might be a health threat. For example, in July 2003, MODIS monitored a
plume of toxic sulfur dioxide smoke from sulfur fires burning in
Iraq.
The United States Air Force Weather Agency and the U.S. Naval Research Laboratory have relied on MODIS Rapid Response images to monitor and predict
dust storms in the Middle East and Southwest Asia. Dust storms, such as the one blowing over Kuwait and Iraq in this MODIS image from April 16, 2003,
can interfere with troop and equipment movement and with aircraft safety.
The military is also given access to near-real-time imagery from other
areas in the world where weather conditions, snow cover, smoke, fires,
volcanic eruptions, and other things could impact military operations. The
United States Environmental Protection Agency and the U.S. Naval Research Laboratory monitor for smoke that
might be a health threat. For example, in July 2003, MODIS monitored a
plume of toxic sulfur dioxide smoke from sulfur fires burning in
Iraq. The MODIS Rapid Response System also provides data to the Aerosol
Robotic Network (AERONET) program. The program is a collaboration of
agency, institute, and university partners designed to monitor aerosols,
liquid or solid particles suspended in the atmosphere. AERONET is a
worldwide network of ground based sensors that monitor the air for
aerosols to understand the impact of aerosols on climate change. The MODIS
Rapid Response system provides daily near real time
imagery of the sensor sites here. By comparing satellite and ground-based
observations, scientists can learn how aerosols reflect and absorb
light and can validate satellite-based aerosol observations. This will
improve the tools scientists use to monitor aerosols over the entire
Earth.
|
|
|
SensorWeb
|
|
 The MODIS Rapid Response System plays a central role in NASA's SensorWeb. The SensorWeb project seeks to tie the array of NASA sensors currently
orbiting the Earth into a virtual web of sensors, so that when one sensor detects an event, it automatically alerts the other sensors in the web to
record the event. Because the Rapid Response System can locate a fire within a few hours after the satellite flies over it, MODIS is used as a trigger
sensor. When MODIS sees a fire, it will send the location information to other sensors, so that they can target the area to collect additional
information.
The MODIS Rapid Response System plays a central role in NASA's SensorWeb. The SensorWeb project seeks to tie the array of NASA sensors currently
orbiting the Earth into a virtual web of sensors, so that when one sensor detects an event, it automatically alerts the other sensors in the web to
record the event. Because the Rapid Response System can locate a fire within a few hours after the satellite flies over it, MODIS is used as a trigger
sensor. When MODIS sees a fire, it will send the location information to other sensors, so that they can target the area to collect additional
information.
Without SensorWeb, someone on the ground has to interpret the data from MODIS, and then program the other sensors to monitor the event--a
time-consuming process. SensorWeb has the potential to provide data about a fire from multiple sensors within 24 to 48 hours verses the typical 14 days
for pre-planned observations.
SensorWeb was used in October and November 2003 when MODIS detected massive wildfires in Southern California. On November 2, MODIS data taken while
the fires burned was used to target the Hyperion and the Advanced Land Imager, high-resolution instruments on the Earth Observing-1 (EO-1) satellite, to
collect highly detailed images of the newly burned areas. All of this information was sent to the USDA Forest Service to make Burn Area Emergency
Response Maps.
|
|
|
Ice
|
|
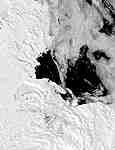 In December 2004, the MODIS Rapid Response team began producing daily images of the Ross Sea in Antarctica for Raytheon Polar, which supports the U.S.
Antarctic Program. The images are being used to plot new courses for the Coast Guard icebreaker and fuel and cargo ships bringing supplies to McMurdo
Station, the American research station on Antarctica. In December 2004 and January 2005, three massive icebergs, the largest of which measured 129
kilometers (80 miles) in length, surrounded McMurdo Sound. The largest, called B-15A, trapped sea ice in McMurdo Sound, changing the conditions in which
the ships normally navigate. Daily images are crucial to chart a safe course around the drifting icebergs and through the sea ice that covers McMurdo
Sound. The images are also being used by scientists who are tracking the movement of the icebergs.
In December 2004, the MODIS Rapid Response team began producing daily images of the Ross Sea in Antarctica for Raytheon Polar, which supports the U.S.
Antarctic Program. The images are being used to plot new courses for the Coast Guard icebreaker and fuel and cargo ships bringing supplies to McMurdo
Station, the American research station on Antarctica. In December 2004 and January 2005, three massive icebergs, the largest of which measured 129
kilometers (80 miles) in length, surrounded McMurdo Sound. The largest, called B-15A, trapped sea ice in McMurdo Sound, changing the conditions in which
the ships normally navigate. Daily images are crucial to chart a safe course around the drifting icebergs and through the sea ice that covers McMurdo
Sound. The images are also being used by scientists who are tracking the movement of the icebergs.
The Canadian Ice Service also uses MODIS images to chart out the
daily ice conditions in the lakes, bays, and ocean around Canada.
|
|
|
Direct Broadcast
|
|
 A small group of MODIS Rapid Response users have stations to receive MODIS data directly from the Aqua and Terra satellites. The MODIS Rapid Response
team provides code to allow these users to process images quickly. In Australia, the Commonwealth Science and Industrial Research Organization (CSIRO)
uses the Rapid Response fire code to monitor for fires. The CSIR Satellite Applications Center in South Africa also has a direct link to the MODIS data.
They use the data to watch for fires, particularly around power lines. In the United States, the University of Alaska, Fairbanks has a direct broadcast
system. Because of its northern location, the station can collect data from the satellites several times daily, which means that they get data more
quickly than most other locations. This is particularly valuable in monitoring for fires.
A small group of MODIS Rapid Response users have stations to receive MODIS data directly from the Aqua and Terra satellites. The MODIS Rapid Response
team provides code to allow these users to process images quickly. In Australia, the Commonwealth Science and Industrial Research Organization (CSIRO)
uses the Rapid Response fire code to monitor for fires. The CSIR Satellite Applications Center in South Africa also has a direct link to the MODIS data.
They use the data to watch for fires, particularly around power lines. In the United States, the University of Alaska, Fairbanks has a direct broadcast
system. Because of its northern location, the station can collect data from the satellites several times daily, which means that they get data more
quickly than most other locations. This is particularly valuable in monitoring for fires.
|
|
|