|
| |||

|
Texas General Land Office Oil Spill Prevention & Response |
Texas
Automated
Buoy
System
Real Time Ocean Observations Supporting Oil Spill Prevention and Response since 1995 |
|
|
| |||
|
||||||||||||
|
TABS Data Products TABS Home Real Time Data Analysis Current Summary Buoy Status TABS Model Results Navy Wave Model (NAVO) Weather Hurricane Tracks Marine Forecasts TX LA Offshore MRF 10 day forecast (UNiSYS) TABS Information IMPORTANT: Notice to Mariners TABS News TABS Web Site Stats Comments Articles & Publications Development of TABS paper(pdf) Ten Years of TABS paper(pdf) Oceans 2001 TABS paper(pdf) Links GCOOS (Member) TGLO Oilspill Division NDBC Home West Gulf TWBD Tide Forecasts National Hurricane Center Houston/Galveston PORTS Texas Parks Harmful Algal Blooms AVHRR Images (Johns Hopkins) TCOON (TAMUCC) WAVCIS (LSU) |
In the map below, click on each of the TABS buoys to access
their half-hourly data for the last 5 days or to perform database searches.
| ||||||||||||||||||||||||
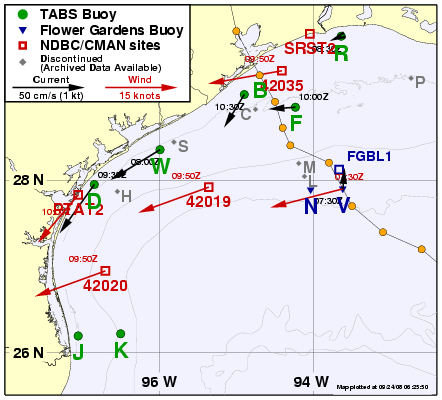
Bathymetric contours shown for these depths(meters): 20, 50, 200, 2000, 3500 The vectors on the map point toward the direction that the currents or winds are flowing and represent the average for the last three hours of the available data. The date and time at each station indicates the end of the three-hour average. |
Last Data Reported | ||||||||||||||||||||||||
|---|---|---|---|---|---|---|---|---|---|---|---|---|---|---|---|---|---|---|---|---|---|---|---|---|---|
|
|||||||||||||||||||||||||
![]()

