
Overview of the U.S. Economy: Perspective from the BEA Accounts
BEA produces some of the most closely watched economic statistics that influence decisions of government officials, business people, and individuals. These statistics provide a comprehensive, up-to-date picture of the U.S. economy. The data on this page are drawn from featured BEA economic accounts.
National Economic Accounts:
Gross Domestic Product (GDP)
Current Numbers:
- 2nd quarter 2008: +3.3 percent
- 1st quarter 2008: +0.9 percent
Next release:
September 26, 2008
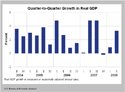
Quarterly data:
Real gross domestic product -- the output of goods and services produced by labor and property
located in the United States -- increased at an annual rate of 3.3 percent in the second quarter of 2008,
(that is, from the first quarter to the second quarter), according to preliminary estimates released by the
Bureau of Economic Analysis. In the first quarter, real GDP increased 0.9 percent.

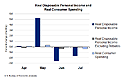
Personal Income
Current Numbers:
- July 2008: -0.7 percent (personal income)
- June 2008: +0.1 percent (personal income)
Next release:
September 29, 2008
Monthly data:
In July 2008, real disposable personal income decreased 1.7 percent.
Industry Economic Accounts:
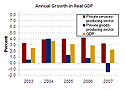
Annual Industry Accounts: GDP by Industry
Annual Data: A downturn in the finance and insurance industry group accounted for nearly half of the slowdown in economic growth in 2007, according to preliminary statistics on industry contributions to real gross domestic product (GDP) growth.
- Highlights (PDF • 42KB)
- Detailed Press Release
- Previous Releases
Annual Growth in Real GDP
View Larger Image
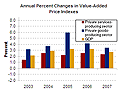
Annual Percent Changes in Value-Added Price Indexes
View Larger Image
View Larger Image
Annual Percent Changes in Value-Added Price Indexes
View Larger Image
International Economic Accounts:
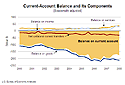
U.S. Balance of Payments (International Transactions)
Current Account Balance:
- 1st quarter 2008: -$176.4 billion
- 4th quarter 2007: -$167.2 billion
Next release:
September 17, 2008
Quarterly data:
The U.S. current-account deficit increased to $176.4 billion (preliminary) in the first quarter of 2008 from $167.2 billion (revised) in the fourth quarter of 2007.
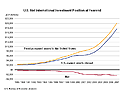
International Investment Position
Annual data:
The U.S. net international investment position at yearend 2007 was -$2,441.8 billion (preliminary), as the value of foreign investments in the United States exceeded the value of U.S. investments abroad.
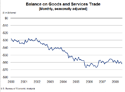
International Trade in Goods and Services
Trade Balance:
- July 2008: -$62.2 billion
- June 2008: -$58.8 billion
Next release:
October 10, 2008
Monthly data:
Total July exports of $168.1 billion and imports of $230.3 billion resulted in a goods and services deficit of $62.2 billion.
(Joint release with the U.S. Census Bureau)
Regional Economic Accounts:
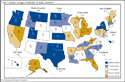
Gross Domestic Product (GDP) by State
Next release: June 2009
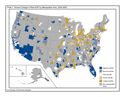
Annual data: New estimates released today by the U.S. Bureau of Economic Analysis show that economic growth slowed in most states and regions of the U.S. in 2007. Real GDP growth slowed in 36 states, with declines in construction and finance and insurance restraining growth in many states. Nationally, real economic growth slowed from 3.1 percent in 2006 to 2.0 percent in 2007, one percentage point below the average growth of 3.0 percent for 2002-2006.
- Highlights (PDF • 129KB)
- Detailed Press Release
- Previous Releases
Gross Domestic Product (GDP) by Metropolitan Area
Next release: Fall 2008
Annual data: Today, the U.S. Bureau of Economic Analysis released experimental measures of economic output produced in the Nation’s metropolitan areas. In 2005, metropolitan areas produced 90 percent of U.S. GDP
- Highlights (PDF • 114KB)
- Detailed Press Release
- Previous Releases
State Personal Income (SPI)
Next release: September 18, 2008
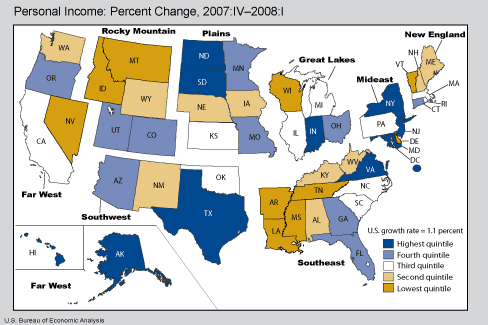
Quarterly data: U.S. personal income grew 1.1 percent in the first quarter of 2008, after growing 1.2 percent in the last quarter of 2007.
- Highlights (PDF • 112KB)
- Detailed Press Release
- Previous Releases
State Per Capita Personal Income
Next release: September 18, 2008
Annual data: U.S. per capita income grew 5.2 percent in 2007, down from 5.6 percent in 2006, but equal to the average of the last four years (2004-07).
- Highlights (PDF • 123KB)
- Detailed Press Release
- Previous Releases
Metropolitan Area Personal Income
Annual data: Personal income growth slowed in 2007 in most of the nation’s metropolitan statistical areas.
- Highlights (PDF • 134KB)
- Detailed Press Release
- Previous Releases
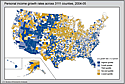
Local Area Personal Income
Annual data: The percent change from 2005 to 2006 in county personal income ranged from 648 percent in St. Bernard Parish, Louisiana to -43 percent in Slope County, North Dakota.
- Highlights (PDF • 205KB)
- Detailed Press Release
- Previous Releases
County Estimates of Compensation by Industry, 2004-2006
Annual data: The Bureau of Economic Analysis released county estimates of compensation by industry for 2004-2006.