|
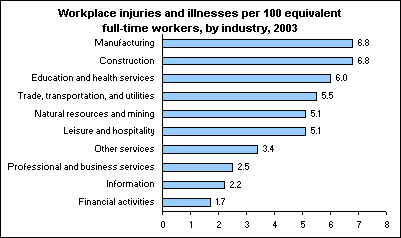
December 15, 2004 (The Editor’s Desk is updated each business day.) Occupational injuries and illnesses by industry, 2003The incidence rate for on-the-job injuries and illnesses declined in private industry from 5.3 cases per 100 equivalent full-time workers in 2002 to 5.0 in 2003. Goods-producing industries as a whole had a rate of 6.7 cases per 100 equivalent full-time workers while service-providing industries as a whole had a rate of 4.4 cases per 100 equivalent full-time workers. Manufacturing and construction both had the highest incidence rate among the industry supersectors: 6.8. Financial activities had the lowest rate: 1.7. These data come from the BLS Injuries, Illnesses, and Fatalities program. Additional information is available from "Workplace Injuries and Illnesses in 2003" (PDF) (TXT), news release USDL 04-2486. Note on industry classification: Beginning with the 2003 reference year, the Survey of Occupational Injuries and Illnesses began using the 2002 North American Industry Classification System (NAICS). Prior to 2003, the program used the Standard Industrial Classification (SIC) system. The substantial differences between these systems result in breaks in series for industry data. Users are advised against making comparisons between the 2003 industry categories and the results from previous years. Happy 10th Birthday, TED!The very first issue of The Editor's Desk (TED) was posted on September 28, 1998. TED was the first online-only publication of the Bureau of Labor Statistics. For 10 years, BLS has been committed to posting a new TED article each business day, for a total of over 2,400 articles so far. |
Tools |
Calculators |
Help |
Info |