|
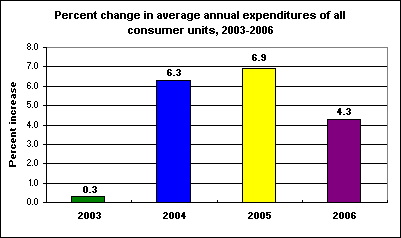
October 29, 2007 (The Editor’s Desk is updated each business day.) Consumer expenditures in 2006Average annual expenditures per consumer unit, which is similar to a household, rose 4.3 percent in 2006, following an increase of 6.9 percent in 2005. The increase in expenditures from 2005 to 2006 was larger than the 3.2-percent rise in the annual average Consumer Price Index (CPI) over this period. Increases in spending on housing (7.9 percent), the largest component of spending, and on food (3.0 percent), contributed to the overall increase in 2006. Among the other major components, spending increased for healthcare (3.8 percent), transportation (2.0 percent), and personal insurance and pensions (1.3 percent), while spending decreased for apparel and services (-0.6 percent) and entertainment (-0.5 percent). These data come from the Consumer Expenditure Survey. Find out more in "Consumer Expenditures in 2006," news release 07-1644. Happy 10th Birthday, TED!The very first issue of The Editor's Desk (TED) was posted on September 28, 1998. TED was the first online-only publication of the Bureau of Labor Statistics. For 10 years, BLS has been committed to posting a new TED article each business day, for a total of over 2,400 articles so far. |
Tools |
Calculators |
Help |
Info |