|
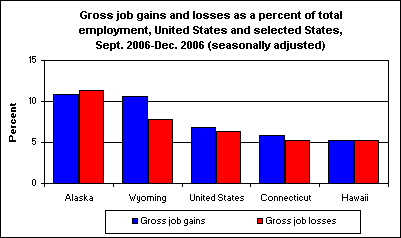
August 31, 2007 (The Editor’s Desk is updated each business day.) Gross job gains and losses by StateBLS has introduced Business Employment Dynamics statistics by State. The new data track the number of jobs gained from opening and expanding establishments and the number of jobs lost at contracting and closing establishments during each quarter from September 1992 to December 2006 for the 50 states, the District of Columbia, Puerto Rico, and the Virgin Islands. Gross job gains are the sum of increases in employment from expansions at existing units and the addition of new jobs at opening units. Gross job losses are the result of contractions in employment at existing units and the loss of jobs at closing units. The difference between the number of gross jobs gained and the number of gross jobs lost is the net change in employment. Business Employment Dynamics data at the State level can be used to help identify how one State’s rate of gross job gains or gross job losses compares to another State’s. For example, from September 2006 to December 2006, Alaska had the highest rate of gross job gains (10.9 percent) and gross job losses (11.4 percent). In contrast, Hawaii and Connecticut had the lowest rate of gross job losses (5.3 percent each). These data are from the Business Employment Dynamics program. To learn more, see "New Quarterly Data from BLS on Business Employment Dynamics by State" (TXT) (PDF), news release USDL 07-1323. Happy 10th Birthday, TED!The very first issue of The Editor's Desk (TED) was posted on September 28, 1998. TED was the first online-only publication of the Bureau of Labor Statistics. For 10 years, BLS has been committed to posting a new TED article each business day, for a total of over 2,400 articles so far. |
Tools |
Calculators |
Help |
Info |