|
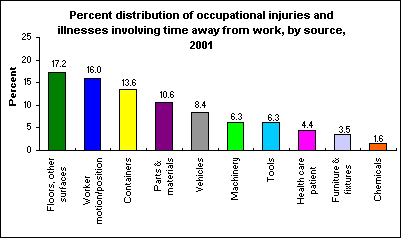
April 02, 2003 (The Editor’s Desk is updated each business day.) Sources of lost-worktime injuries and illnesses in 2001Floors and other surfaces, worker motion or position, and containers, and parts and materials were the sources of 57.4 percent of the occupational injuries and illnesses involving time away from work in 2001. Floors, walkways, and ground surfaces accounted for 17.2 percent of lost-worktime injuries and illnesses, and worker motion or position accounted for 16.0 percent. Containers were the source of 13.6 percent of the injuries and illnesses resulting in time away from work and parts and material accounted for 10.6 percent. Among other sources of injury or illness were vehicles (8.4 percent), machinery (6.3 percent), and tools, instruments, and equipment (6.3 percent). The remaining sources each accounted for less than 5 percent of the total: health care patient (4.4 percent), furniture and fixtures (3.5 percent), and chemicals and chemical products (1.6 percent). These data are from the BLS Injuries, Illnesses, and Fatalities program. Additional information is available from "Lost-Worktime Injuries and Illnesses: Characteristics and Resulting Days Away From Work, 2001", news release USDL 03-138. Related Articles: Happy 10th Birthday, TED!The very first issue of The Editor's Desk (TED) was posted on September 28, 1998. TED was the first online-only publication of the Bureau of Labor Statistics. For 10 years, BLS has been committed to posting a new TED article each business day, for a total of over 2,400 articles so far. |
Tools |
Calculators |
Help |
Info |