|
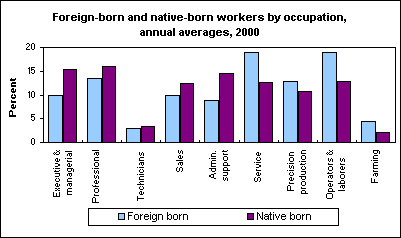
August 02, 2002 (The Editor’s Desk is updated each business day.) Occupations of foreign-born workersThe occupational distribution of foreign-born workers, when compared with that of the native born offers some insights into the economic role of the foreign born in this country. In 2000, the proportion of the foreign born employed in professional specialty occupations (13.5 percent), which usually require a college degree, was fairly close to that of the native born (15.9 percent). In contrast, only 9.9 percent of the foreign born were employed as executives, administrators, and managers, compared with 15.3 percent for the native born. Seniority, and language problems for non-English speakers, are two likely reasons why the foreign born are underrepresented in executive and administrative occupations. The foreign born tend to be overrepresented in low-paying occupations that do not require completion of high school. In 2000, about 19 percent of the foreign born were in service occupations, and another 19 percent worked as operators, fabricators, and laborers. A little less than 13 percent of the native born were employed in each of these categories. Poorer educations, language difficulties, and unfamiliarity with the U.S. job market are likely explanations for the high proportion of foreign born in lower-paying jobs. These data are a product of the Current Population Survey. Find out more in "The role of foreign-born workers in the U.S. economy," by Abraham T. Mosisa, Monthly Labor Review, May 2002. Happy 10th Birthday, TED!The very first issue of The Editor's Desk (TED) was posted on September 28, 1998. TED was the first online-only publication of the Bureau of Labor Statistics. For 10 years, BLS has been committed to posting a new TED article each business day, for a total of over 2,400 articles so far. |
Tools |
Calculators |
Help |
Info |